
한반도 남동부 지역에 발달한 양산단층 비지의 마찰 특성
초록
한반도 남동부에 발달한 주 단층들 가운데 하나인 양산단층의 마찰특성을 이해하기 위하여 단층비지를 대상으로 전단속도변화실험(velocity stepping test)을 실시하였다. 단층비지 시료들은 경남 양산시 상천리 지역과 경북 포항시 보경사 인근에 위치한 단층 노두의 단층핵(fault core)과 부차 단층(subsidiary fault)으로부터 각각 채취하였다. 실내 전단실험 전에 시료의 전처리, X-선 회절분석 및 입도분석을 통해 단층비지 물질의 특성을 파악하였다. 전처리 과정을 거쳐 250 μm 이하의 크기로 선별한 단층비지 분말을 대상으로 수직응력 5, 10, 20 MPa과 전단속도 1-100 μm/s의 조건 하에서 전단실험을 실시하였다. 상천리 지역 단층비지(SCL 1-1, 1-2, 1-3)와 보경사 지역 단층비지(BGS 3-1, 3-2)의 최대마찰계수는 각각 약 0.3-0.5, 0.2-0.3 사이의 값을 보였다. 시료들 가운데 보경사 지역의 단층핵으로부터 채취한 시료(BGS 3-1)에서 가장 낮은 마찰계수(0.2)가 측정되었다. 이는 다른 시료들에 비해 상대적으로 높은 몬모릴로나이트(montmorillonite) 함량에 기인한 것으로 보인다. 또한 실험 후 회수시료의 미구조 분석결과, 다른 시료에 비해 BGS 3-1에서 전단면 전면에 R1-전단띠 뿐만 아니라 Y-전단띠의 발달이 현저한 것으로 보아 이 같은 구조 발달이 시료에서 측정되는 매우 낮은 마찰계수와 직접적으로 관련된 것으로 해석된다. 실험에 이용된 대부분의 시료와 실험조건에서 양의 마찰율 파라미터(friction rate parameter) 값을 갖는 속도 강화(velocity strengthening)거동이 관찰되었다. 단층 미끌림의 시작 깊이에서 단층암의 특성이 지표 노두에서와 유사하다고 가정하면, 이는 시료 채취 지역의 양산단층 분절에서는 단층이 재활될 경우, 지진을 유발하기보다는 안정한 미끌림(aseismic or stable slip) 거동을 보일 것을 지시한다.
Abstract
We have carried out a series of shear velocity stepping tests in the laboratory to study frictional properties of clay-rich fault gouge collected from Yangsan fault which is one of the main faults existing in SE Korea. Fault gouges were collected from the outcrops located at Sangcheon-ri and Bogyeongsa. Two or three gouge samples were collected from each of the outcrops; one from the fault core, and the others from the subsidiary faults developed within the damage zone. The experimental results show that peak friction coefficients measured range between 0.2 and 0.5 for all the samples tested under the normal stresses (5, 10, 20 MPa). Of all the samples tested, the fault gouge (BGS3-1) from the fault core nearby Bogyeongsa exhibits the lowest peak friction coefficient of 0.2. This appears to be resulted from the relatively higher contents of montmorillonite in the sample than the others. The friction rate parameters (a - b) measured for all the samples and experimental conditions are positive, indicating “velocity strengthening” behavior. It suggests that the fault would exhibit stable (or aseismic) slip after its reactivation. The microstructural analysis conducted on the recovered specimens shows that R1-shear bands prevail in all the samples. Especially, noticeable development of both R1-shear and Y-shear bands are observed in the sample (BGS 3-1) which exhibits the lowest value of peak friction coefficient.
Keywords:
Yangsan Fault, fault gouge, double direct shear test, friction coefficient, fault stability키워드:
양산단층, 단층비지, 전단실험, 마찰계수, 단층안정성1. 서 언
단층(fault)은 지각 천부에서 인지되는 대표적인 취성 변형(brittle deformation)의 증거로서 자연 단층은 일반적으로 하나의 면 구조가 아닌 단층대(fault zone)의 형태로 발달한다. 단층대는 주 단층면을 중심으로 응력과 변형이 집중되어 형성된 단층핵(fault core)과 양 옆으로 모암의 형태는 유지하지만 소규모의 단층, 습곡 등의 2차적인 변형이 수반되는 단층손상대(fault damage zone)로 구성된다(Chester et al., 1993). 또한 지각 천부에서 단층핵은 모암이 분쇄되어 형성된 단층비지(fault gouge)와 단층각력(fault breccia)으로 구성되는데, 단층비지는 생성 이후, 열수와 지하수 등의 영향에 따른 기존 물질의 변질로 다량의 점토광물을 포함하고, 단층면의 마찰계수를 낮추어 단층을 역학적으로 불안정하게 만드는 역할을 한다(Saffer et al., 2001; Mair et al., 2002; Ikari et al., 2009; Carpenter et al., 2011; Haines et al., 2013). 이러한 단층비지의 물성은 단층의 미끌림 거동(지진성 미끌림 혹은 비지진성 미끌림) 특성을 좌우한다는 측면에서도 매우 중요하다고 할 수 있다(Vrolijk and Pluijim, 1999; Moore and Saffer, 2001; Saffer and Marone, 2003; Ikari et al., 2007). 또한 이는 기존에 존재하던 단층의 재활성을 의미하고, 자연 지진과 관련된 문제뿐만 아니라, 이산화탄소 지중저장(CCS)과 같은 산업적 측면에서도 적용될 수 있다(Zoback and Gorelick, 2012; Lee and Chang, 2015).
이러한 연구들은 인공적으로 만든 단층비지를 이용한 전단실험을 통해 물질의 일반적인 마찰특성을 정립하는 방식과 대규모 단층대에서 직접 채취한 단층비지를 실내 전단실험에 이용하여 연구하는 방식으로 진행되어 왔다(Marone et al., 1990; Mair and Marone, 1999; Mair et al., 2002; Numelin et al., 2007; Collettini et al., 2009; Carpenter et al., 2011).
이번 연구의 목적은 한반도 남동부에 발달하는 대규모의 단층인 양산단층을 역학적인 측면에서 해석하는데 있다. 한반도 남동부에 분포하는 양산단층계는 서쪽에서 동쪽으로 자인, 밀양, 모량, 양산, 동래, 일광단층의 북북동방향의 단층들로 구성되어 있으며(그림 1), 백악기-고신생기 퇴적암과 화성암류를 절단하고 있다. 지표상에서 약 200 km 정도의 연장성과 수 km 폭의 파쇄대를 가지는 양산단층은 양산단층계를 구성하는 단층들 중에 가장 연장성이 우세한 단층으로서, 이를 따라 백악기에서 제4기까지 여러 번의 활동이 있었음이 다수의 연구자들에 의해 보고된 바 있다(Son et al., 2002; Choi et al., 2009; Kang and Ryoo, 2009).
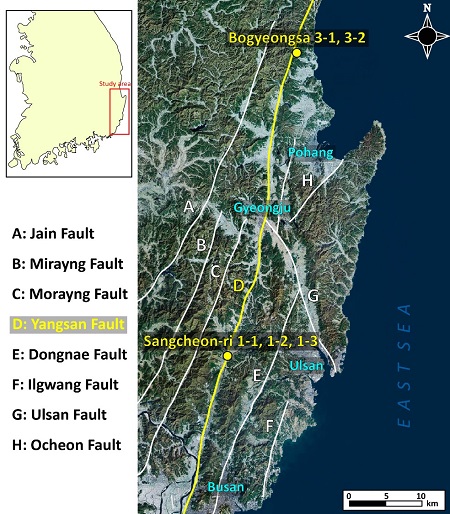
Location map of sampling sites from which fault gouges were collected. The white lines indicate the Yangsan fault systems. The thick and yellow line (indicated by “D”) is Yangsan fault along which sampling sites are indicated by yellow circle.
기존의 많은 연구자들에 의한 양산단층의 구조(architecture)와 관련된 지질학적(구조지질학, 지구물리학)인 접근이 있었지만, 단층의 안정성과 관련된 마찰특성에 대한 정량적인 연구는 여전히 부족하다. 따라서 이번 연구는 양산단층에서 채취한 단층비지를 이용하여 실내 전단실험을 통해 양산단층의 역학적인 특성을 이해하고자 하였으며, 단층비지의 광물학적인 특징과 마찰특성에 대한 정량적인 해석을 시도하였다. 또한 전단실험을 마친 시료의 연마 박편(polished thin section)을 이용하여 미구조 분석을 실시하였다.
2. 실험 대상 물질 및 실험 방법
2.1 실험 대상 물질
이번 연구에서는 양산단층대의 남쪽에 위치하는 경남 양산시 울주군 언양읍 상천리 지역(이하 SCL)과 북쪽에 위치하는 경북 포항시 북구 송라면 보경사 인근(이하 BGS)에서 채취한 단층비지를 연구 대상으로 선정하였다. 야외노두에서 단층의 자세, 변형구조, 모암 등의 주요 특징을 파악하고, 단층핵과 주변 부차 단층(subsidiary fault)의 단층비지를 각각 채취하였다.
상천리 지역은 하양층군의 퇴적암과 유천층군의 화산암류 그리고 불국사 화강암류가 주로 분포한다. 양산단층을 기준으로 동쪽지괴에는 주로 사암과 셰일로 이루어진 하양층군 퇴적암류가 분포하고, 서쪽지괴에는 유천층군의 화산암류와 불국사화강암류가 분포한다(Choi et al., 2009). 시료를 채취한 곳은 양산단층을 가로지르는 동서방향의 가천천을 따라 노출된 노두로 단층핵과 혼합대(mixed zone) 그리고 손상대가 연속적으로 잘 노출되는 지역이다(그림 2a, 2b; Choi et al., 2009). 주단층면의 자세는 N06°E/ 73°SE이며, 단층핵의 모암은 대부분 화성기원의 안산암질 응회암으로 우수향 전단을 지시하는 S-C fab-ric이 흔히 인지된다. 실험을 위해 단층핵에서 두 개의 시료(SCL 1-1, 1-2)와 부차 단층에서 하나의 시료(SCL 1-3)를 채취하였다.
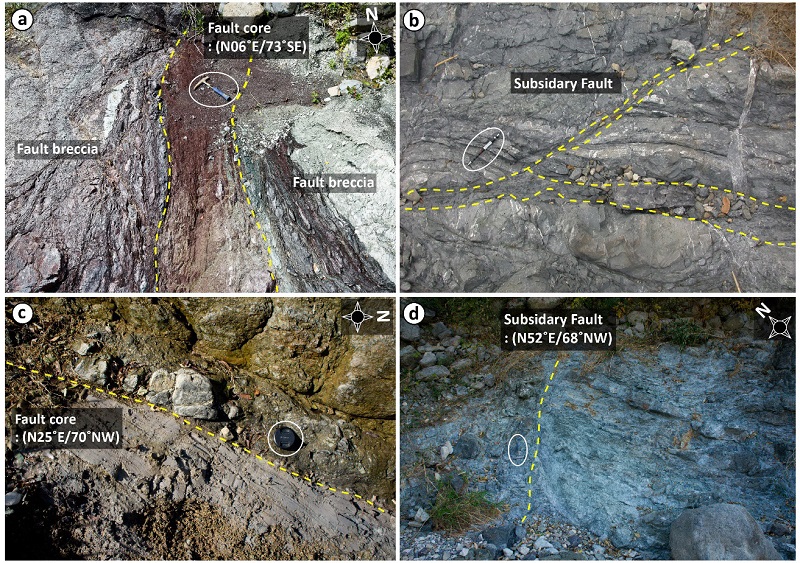
Photograph of outcrops where fault gouges, (a) SCL 1-1, (b) SCL 1-3, (c) BGS 3-1, and (d) BGS 3-2, were collected. SCL 1-1 and BGS 3-1 are fault gouges collected from the fault core zone, and SCL 1-3 and BGS 3-2 are from the subsidiary fault within the damage zone. The white circle on each of the photographs indicates scale.
보경사 지역에서 확인되는 양산단층대는 서쪽지괴의 유천층군인 안산암질 응회암과 동쪽지괴의 하양층군 퇴적암을 가로지르고 있다(Kim et al., 1968; Yun et al., 2000). 주단층면의 자세는 N25°E/70°NW이며, 양산단층의 주향방향과 유사하다. 주단층면에서 확인되는 단층비지는 주로 경상분지 백악기 퇴적암 기원의 단층암이다(Kim et al., 2015). 시료는 북북동방향의 주단층면을 따라 확인되는 단층비지(BGS 3-1)와 퇴적암 기원의 단층비지를 가지는 북동방향의 부차단층(BGS 3-2)에서 채취하였다(그림 2c, 2d).
야외 단층 노두에서 채취한 단층비지를 실내 전단실험에 사용하기 위해 전처리 과정을 거쳐 분말형태로 만들었다. 먼저 채취한 단층비지를 #60체(250 μm)에 놓고 증류수를 부으면서 거른다. #60체를 통과한 시료들을 60℃ 오븐 내에서 건조한 후, 뭉쳐있는 단층비지 분말 덩어리를 손으로 분쇄하여 다시 #60체로 걸러 최종 단층비지 분말을 제작한다. 최종단층비지 분말은 XRD 정량분석(표 1), 입도분석(그림 3), 그리고 전단실험에 이용하였다.
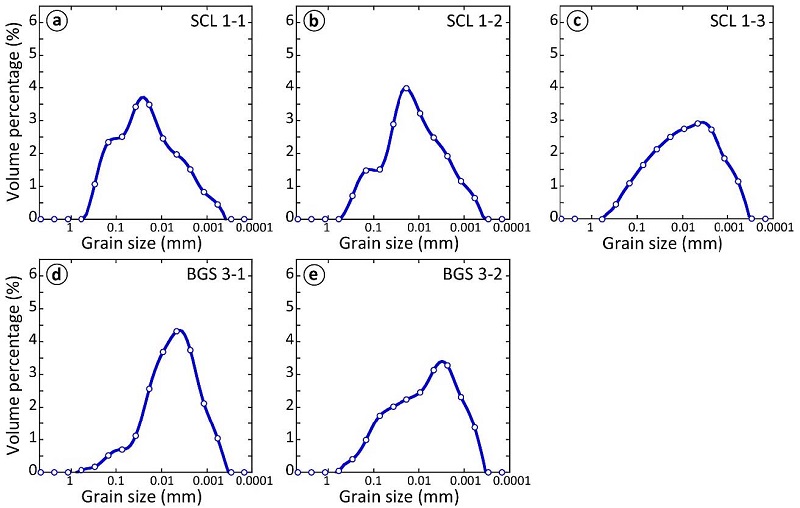
Grain size distribution of the fault gouges. The SCL 1-1 has a similar grain size distribution to SCL 1-2, and it appears they consist of relatively larger grains. Both SCL 1-3 and BGS 3-2 have a similar grain size distribution and have relatively smaller grains. The BGS 3-1 has a relatively narrower grain size distribution compared to that of other samples.
이번 연구에서는 단층비지 내의 주된 점토광물인 일라이트(illite), 녹니석(chlorite) 이외에 몬모릴로나이트(montmorillonite)를 식별하기 위해 별도의 전처리(즉, 에틸렌글리콜 처리) 과정을 실시하였고, 절차는 다음과 같다. 먼저 전체 시료에 대해 XRD 정량분석 후, 몬모릴로나이트의 피크가 인지되는 시료들을 따로 선별하였다. 이후 선별한 시료에서 점토광물의 층간을 최대로 팽창시키는 에틸렌글리콜 처리 후, 정성분석을 통해 몬모릴로나이트의 존재 여부를 식별하였다. 몬모릴로나이트의 존재가 확인된 시료에 대해서만 XRD 정량분석 시, 몬모릴로나이트를 추가로 입력하여 산출하였다.
에틸렌글리콜 처리 방법은 앞서 설명한 처리과정으로 제작한 분말시료를 물과 섞어 현탁액을 만든 후, 원심분리를 통해 비커의 맨 위에 떠다니는 점토광물을 따로 건져내었다. 이후, 슬라이드글라스에 올려서 건조시킨 후, 에틸렌글리콜을 한방울 떨어뜨리고 다시 5시간 건조시켰다.
XRD 정량분석결과는 표 1에 제시하였다. SCL 1-1는 석영 함량이 51.4 wt%로 다른 시료들에 비해 가장 높은 함량으로 산출되었고, 장석 함량과 합하여 가장 높은 비점토광물 함량을 보였다. 점토광물의 총 함량은 35.6 wt%로 가장 낮게 산출되었다. SCL 1-2는 석영 함량이 SCL 1-1보다 적지만, 장석을 많이 함유하여, 총 비점토광물과 점토광물 함량은 SCL 1-1과 유사하게 각각 62.5 wt%와 37.5 wt%로 산출되었다. SCL 1-3의 경우, 비점토광물 함량은 51.2 wt%로 앞선 시료들보다 적지만, 총 점토광물 함량은 48.8 wt%로 상대적으로 많이 산출되었다. BGS 3-1의 경우, 장석 함량은 3 wt%미만으로 거의 산출되지 않았지만 석영이 43.0 wt%로 산출되었다. 총 비점토광물 함량은 52.6 wt%이고, 점토광물의 총 함량은 47.4 wt%로 산출되었으며, 특징적으로 몬모릴로나이트가 9.5 wt%로 산출되었다. BGS 3-2는 BGS 3-1과 비점토광물과 점토광물의 총 함량은 비슷하지만, 몬모릴로나이트는 존재하지 않았다. 따라서 XRD 정량분석에 근거할 때, 광물조성이 유사한 시료들은 총 비점토광물 함량과 점토광물 함량이 유사한 상천리 주 단층비지대(SCL 1-1, 1-2)에서 채취한 두 시료와 상천리와 보경사 인근의 부차 단층(SCL 1-3과 BGS 3-2)에서 채취한 두 시료로 구분 가능하다.
입도분석은 Malvern 사의 Mastersizer 2000 장비를 이용하여 실시하였고, 그 결과를 입도크기와 부피 비율의 함수로 그림 3에 제시하였다. 그래프에서 정점(peak)의 X축 위치는 가장 높은 비율을 차지하는 평균 입자의 크기를 의미하고, Y축 위치는 평균 입자들이 차지하고 있는 비율을 나타낸다.
상천리에서 채취한 시료들(SCL 1-1, 1-2, 1-3)은 각각 0.025, 0.018 그리고 0.004 mm의 평균 입자크기를 가지며, 시료마다 정점의 양 옆으로 분산되어 있는 것으로 다양한 크기의 입자들이 분포함을 보여준다. 이는 SCL 1-3에서 가장 현저하게 나타나며, 분급이 좋지 않음을 의미한다. 보경사 인근에서 채취한 시료(BGS 3-1, 3-2)는 각각 0.004, 0.003 mm의 평균 입자크기 갖는 것으로 나타났다. BGS 3-1의 경우 다른 시료들과 비교했을 때, 정점 주변으로 집중되는 경향이 가장 현저하게 나타나며, 이는 평균입자크기로 입자들이 균질하게 분포하여 분급이 좋음을 의미한다. 따라서 다른 시료들에 비해 BGS 3-1은 상대적으로 세립의 입자들이 높은 비율을 차지하고, 분급도 우세하다. 반면, BGS 3-2의 평균 입자크기는 BGS 3-1과 유사하지만, 정점에 집중되는 경향을 보이지 않기 때문에 불량한 분급을 갖고, SCL 1-3과 유사한 입도분포를 보인다.
2.2 마찰계수 측정
전단실험에 사용되는 단층비지 분말은 그림 4에서 보는 바와 같이 암석 블록(측면블록, 4×5×2 cm, 2개, 중앙블록, 4×8×2 cm, 1개) 사이에 2 mm 두께의 샌드위치 형태로 채워 넣어 샘플 조립체(sample as-sembly)를 만들었다. 암석 블록으로 제작한 재료는 암석역학 실내시험에서 보편적으로 이용되는 표준시료인 Berea 사암 또는 전북 황등 지역에서 산출되는 석영, 사장석, K-장석 및 흑운모가 주 구성광물인 세립질의 황등화강암을 이용하였다. 암석 블록의 슬립면(slip surface)은 샘플결합에 앞서 실리콘 카바이드(# 80)로 연마하였다. 전단면의 연마는 암석 블록의 표면을 거칠게 만듦으로써, 단층의 전단면에 형성되는 굴곡면(asperity)을 재현하여, 단층비지 내부에서만의 미끌림을 유도하기 위함이다(Marone et al., 1990). 또한 단층비지의 손실을 막기 위해, 암석블록의 접합부 주변에 테이핑을 하여, 24시간 동안 증류수에 침수시켜 단층비지 분말을 포화 상태로 만들었다.
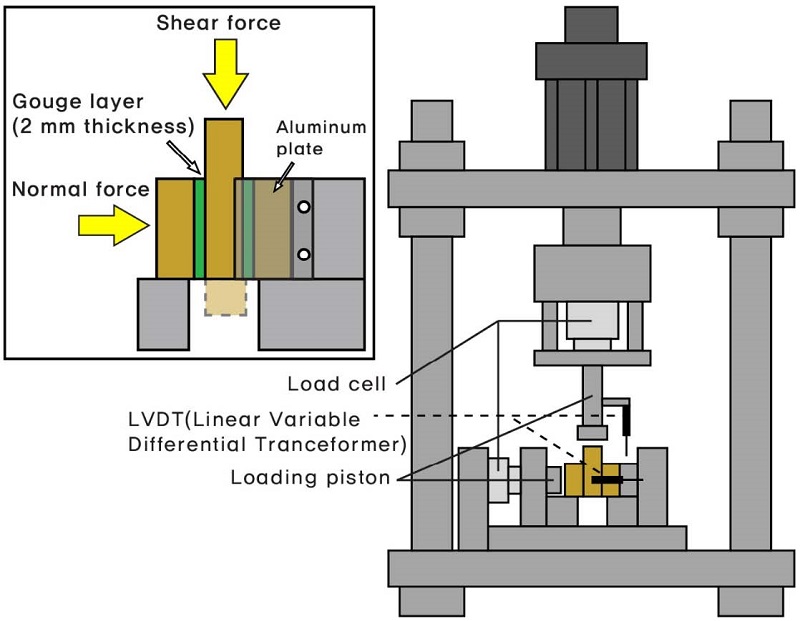
Schematic diagram of biaxial loading apparatus consisting of a vertical loading frame for applying shear force and a horizontal frame for normal force. The inset shows a magnified sample assembly which is made up by sandwiching a gouge layer of 2 mm thickness in between the center forcing block (4 cm × 8 cm × 2 cm) and the side forcing block (4 cm × 5 cm × 2 cm). For running a double direct shear test, the sample assembly is positioned just below the loading piston equipped under the shear load cell.
그림 4에 삽입된 모식도와 같이 전단실험 동안 옆으로 단층비지가 새어 나오는 것을 최소화하기 위해, 마찰력에 영향을 주지 않는 알루미늄으로 제작한 덮개판을 부착하였다. 이후 전단면에 수직응력을 가하는데 이용된 수평으로 놓인 로딩프레임(loading frame)에 장착하였다. 또한 전단실험 동안 수직 및 전단변위(normal and shear displacement)를 측정하기 위해 LVDT (linear variable differential trans-former)를 장착하였다.
이후 일정한 가력 속도(loading rate, 0.01 tonf/s)로 전단면에 수직응력(normal stress)을 증가시키고, 정해진 수직응력에 도달한 후, 서보-컨트롤러(servo-con-troller)의 제어를 통해 전단실험을 마칠 때까지 일정하게 유지하였다. 실험에 사용된 수직응력은 5, 10, 20 MPa이다. 이후 수직방향으로 놓인 로딩프레임을 이용하여 전단변위속도를 제어, 변화시키면서 전단면에 전단력(shear force)을 가하였다(velocity stepping test). 수직응력 5, 10 MPa에서는 전단변위속도(1-10-100-10-1 μm/s)를 이용하였고, 수직응력 20 MPa에서는 전단변위속도(1-3-10-30-60-100 μm/s)를 이용하였다. 각 실험에서 정해진 전단변위속도를 총 4회 반복하면서 전단실험을 실시하였다. 전단실험 동안의 수직, 수평 방향의 응력과 변위를 80-100 Hz로 기록하였다.
실내 전단실험을 통해 얻은 자료로부터, 마찰거동 특성을 지시하는 파라미터(constitutive parameter)를 산출하기 위해서 Dieterich (1978, 1979)와 Ruina (1983)가 제안한 Rate and state friction law (수식 1)를 적용하였다. Rate and state friction law는 (1) 전단실험 동안 전단 속도의 변화에 따라 마찰계수도 동시에 변화하는 효과인 direct effect (rate)와 (2) direct effect 이후, 변화하는 마찰계수를 나타내는 효과인 evolution effect (state)의 조합으로 표현된다(그림 5a; 수식 1).
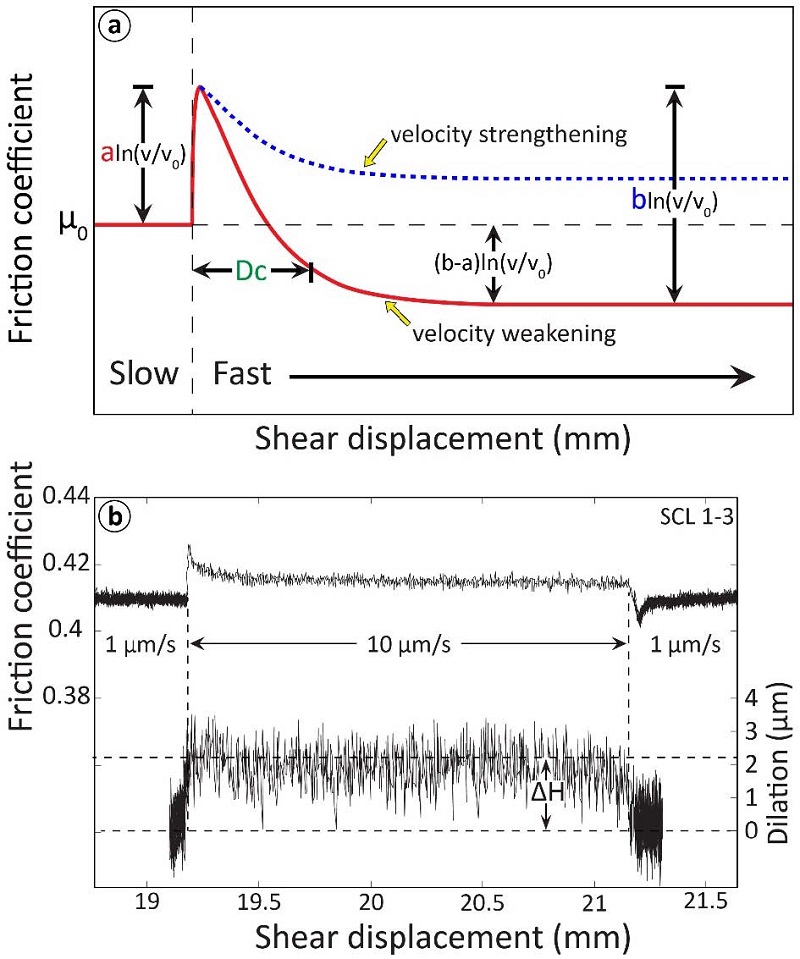
(a) Behavior of sliding friction coefficient in response to sliding velocity increase. “a” and “b” are experimental constants. “a” represents the magnitude of the instantaneous increase in the sliding friction coefficient. “b” represents the magnitude of the subsequent decay in the sliding friction coefficient. Dc is the critical distance over which sliding friction coefficient evolves from one steady state value to another. Note that the discrepancy between velocity weakening (indicated by solid line) and velocity strengthening (indicated by dotted line). Velocity weakening (a-b<0) indicates unstable sliding, and velocity strengthening (a-b>0) indicates stable sliding (modified from Samuelson, 2010). (b) Enlargement of a velocity step test (SCL 1-3) showing the variation of sliding friction coefficient in response to an upstep velocity and the accompanying dilation of the gouge layer (ΔH).
| (1) |
수식 1에서 μ0 는 전단 속도가 변화하기 전의 마찰계수이고, V0는 전단 속도가 변화하기 전의 속도, V는 전단 속도가 변화한 후의 속도이다. Dc는 임계전단거리(critical slip distance)로 전단속도 변화 후, 마찰계수가 새로운 평형상태에 도달하는데 필요한 거리를 의미한다. θ는 상태변수(state valuable)로써 임계전단거리(Dc)와 속도의 함수로 표현된다. 따라서 θ는 임계전단거리 동안 어떤 속도로 움직인 평균 이동 시간(average time of asperity contact, Dieterich, 1979)을 의미한다. “a” 와 “b” 는 전단실험을 통해 산출되는 상수(experimental constants)이다. 전단속도의 제어를 통한 속도단계실험(velocity stepping test)에서 전단속도의 증가 혹은 감소와 동시에 마찰계수가 증가 혹은 감소하는 direct effect의 정도를 나타내는 실험상수는 “a” 이고, Dc를 이동하는 동안 마찰계수가 감소 혹은 증가 하는 evolution effect의 정도를 나타내는 실험상수는 “b” 이다(그림 5a).
또한 “a” 와 “b” 는 단층의 안정성 판별에 이용된다. “velocity weakening”, (a-b<0)인 경우 파괴 후 단층은 불안정한 지진성 전단거동을 유발하게 된다. “velocity strengthening”, (a-b>0)인 경우, 단층은 안정한 비지진성(aseismic) 전단거동을 보인다. 위에서 설명한 파라미터들과 더불어 전단실험 동안의 단층비지 두께변화를 측정하여, 산출할 수 있는 ΔH가 있다(그림 5b). ΔH는 전단속도 변화에 따라 샘플 조립체 사이에 끼운 단층비지 체적의 증가(dilatancy) 또는 감소(compaction)현상을 표현한 것이다. 이는 전단실험 동안, 단층비지 두께변화로 단층비지 내부에서의 변형 정도를 지시한다. 이러한 파라미터를 구하기 위해 전단실험을 마친 데이터에서 속도변화가 일어난 구간을 따로 선별하여, 곡선 맞춤(curve fitting)을 하여 계수를 산출하였다.
2.3 미구조 분석
전단실험 중 변형된 단층비지의 미구조 분석을 위해 실험 후 각 샘플조립체를 회수하고 이를 슬라이드글라스 크기로 절단하여 연마 박편(polished thin section)을 제작하였다. 이후 전계방출형 주사전자현미경(field-emission scanning electron mi-croscope) 하에서 단층비지를 관찰하였다. 관찰한 연마 박편 시료는 모두 수직응력 5 MPa 조건에서 최종 전단변위가 20-25 mm에 도달할 때까지 변형된 것들이다.
3. 결과 및 해석
3.1 마찰계수
자연 단층비지를 이용한 실내 전단실험을 통해 얻어진 마찰 거동은 그림 6과 그림 7에 제시되어 있고, 각 실험에서 얻어진 최대마찰계수(peak friction co-efficient)는 표 2에 정리되어 있다. 실험 결과, 수직응력(5, 10, 20 MPa)에 따라 다른 마찰거동이 관찰되었다. 상천리 인근에서 채취한 단층비지 시료의 경우, 대체적으로 수직응력이 5, 10 MPa 조건에서 모든 시료(SCL 1-1, 1-2, 1-3)는 “slip weakening” 거동을 보였다. 즉 마찰계수가 최대마찰강도까지 급격하게 증가한 뒤, 점진적으로 마찰계수가 감소하여 새롭게 안정된 정상마찰계수에 도달하게 된다. 한편 수직응력이 20 MPa 조건에서는 마찰계수가 최대마찰강도에 도달한 이후, 전단변위가 증가함에 따라 계속 증가하는 “slip hardening” 거동을 보였다(그림 6).
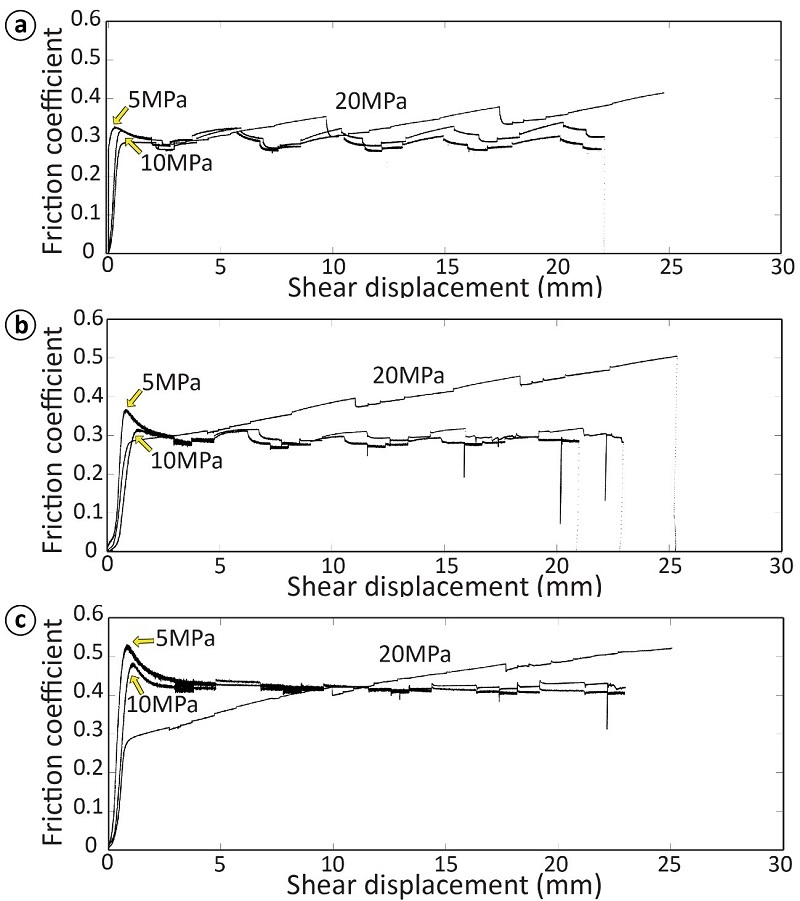
Coefficient of sliding friction as a function of shear displacement for Sangcheon-ri fault gouges, (a) SCL 1-1, and (b) SCL 1-2, and (c) SCL 1-3, tested at σn=5, 10, and 20 MPa and with varying shear velocity.
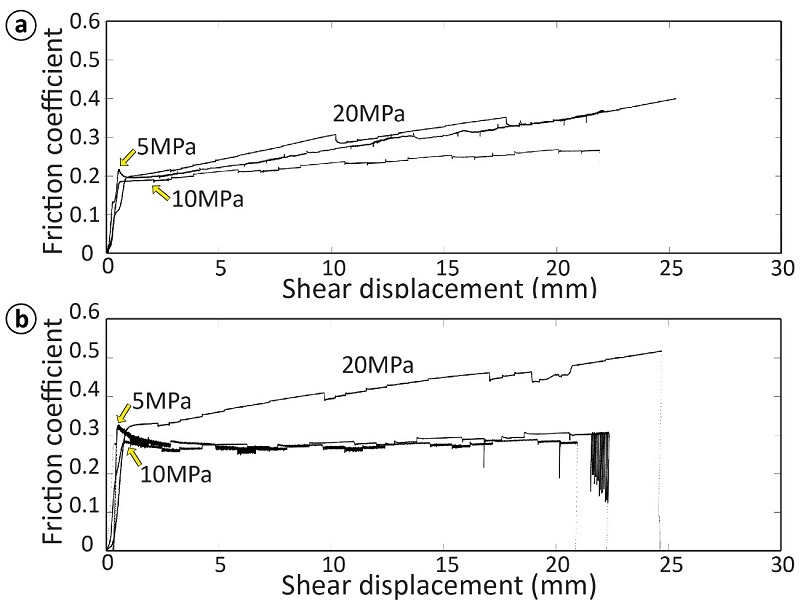
Coefficient of sliding friction as a function of shear displacement for Bogyeongsa fault gouges, (a) BGS 3-1 and (b) BGS 3-2, tested at σn=5, 10, and 20 MPa and with varying shear velocity.

Experimental conditions of double direct shear tests and sliding friction coefficients obtained from each of the tests (SCL: Sangcheon-ri, BGS: Bogyeongsa).
한편, 보경사 인근 단층노두에서 채취한 BGS 3-1의 경우 수직응력 5, 10, 20 MPa 조건에서 모두 “slip hardening” 거동을 보였다(그림 7a). 하지만, BGS 3-2의 경우 상천리 시료들과 유사하게 수직응력 5, 10 MPa 조건에서는 “slip weakening” 거동을 보였고, 수직응력 20 MPa 조건에서는 “slip hard-ening” 거동을 보였다(그림 7b).
최대마찰계수(peak friction coefficient)는 그림 8과 표 2에 제시하였다. 그림 8에서 보는 바와 같이 전반적으로 수직응력이 클수록 최대마찰계수가 작아지는 경향을 보인다. 단층핵으로부터 채취한 상천리 시료(SCL 1-1, 1-2)의 경우, 실험에 이용된 모든 수직응력(5, 10, 20 MPa) 하에서 최대마찰계수(μpeak)는 0.284-0.364의 범위로 측정되었고, 두 시료의 마찰거동과 마찰계수는 유사한 것으로 나타났다(표 2). 반면에, 단층손상대내 부차단층으로부터 채취한 SCL 1-3은 수직응력 5, 10 MPa에서 진행된 전단실험에서 최대마찰계수가 가장 높게 측정되었다. 같은 수직응력 조건(5-20 MPa)에서 보경사 인근 단층노두의 단층핵으로부터 채취한 시료 BGS 3-1은 모든 시료 중에서 가장 낮은 최대마찰계수가 측정되었고, 단층손상대내 부차단층으로부터 채취한 BGS 3-2는 SCL 1-1, 1-2와 유사한 범위로 측정되었다(그림 8; 표 2).
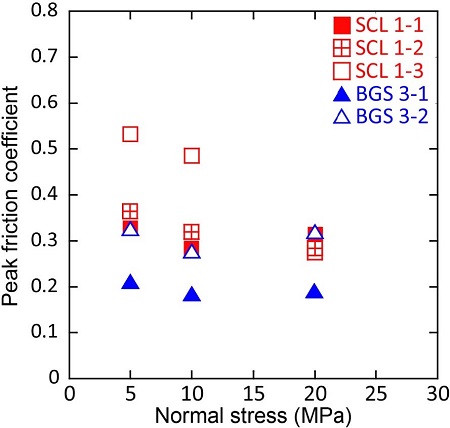
Peak friction coefficient versus normal stress. Note that the larger normal stress is applied, the lower peak friction coefficient is measured. The lowest peak friction coefficient of 0.2 was observed in BGS 3-1. coefficients obtained from each of the tests (SCL: Sangcheon-ri, BGS: Bogyeongsa).
일반적으로 단층비지 내에서 총 입자(total clast)의 함량이 많아지고, 총 점토광물(total clay)의 함량이 적어지면 마찰계수는 증가한다(Brown et al., 2003; Tembe, 2007). XRD 정량분석결과와 전단실험결과를 비교해보면, SCL 1-1과 SCL 1-2의 경우, 총 비점토광물의 함량과 점토광물의 함량이 서로 유사하게 산출되었다(표 1). 따라서 SCL 1-1과 SCL 1-2는 유사한 마찰계수를 가질 것으로 예상되며, 전단실험결과에서도 마찰계수가 큰 차이를 보이지 않았다. SCL 1-3의 경우, 총 비점토광물의 함량이 SCL 1-1과 SCL 1-2 보다 약 10 wt% 적고, 총 점토광물의 함량은 약 10 wt% 많게 산출되었다. 따라서 단층암 구성광물에 따른 마찰계수의 일반적인 경향으로 볼 때, SCL 1-3에서 두 시료(SCL 1-1, 1-2)보다 더 낮은 마찰계수가 측정되어야 한다. 하지만, 전단실험결과 SCL 1-3의 마찰계수는 모든 시료 중 가장 높은 값을 보였다(표 2). 이를 규명하기 위해서는 추가적인 연구가 필요하다.
BGS 3-1과 BGS 3-2의 경우, 비점토광물의 총 함량이 SCL 1-1과 SCL 1-2 보다 약 10 wt% 낮게 산출되었고, 점토광물의 총 함량은 약 10 wt% 높게 산출되었다(표 1). 단층암 구성광물에 따른 마찰계수의 일반적인 경향으로 볼 때, BGS 3-1과 BGS 3-2은 SCL 1-1과 SCL 1-2보다 마찰계수가 낮게 측정되어야 한다. 하지만 BGS 3-1은 낮게 측정된 반면, BGS 3-2는 SCL 1-1과 SCL 1-2와 유사하게 측정되었다. 따라서 이번 연구에서 XRD 정량분석에서 산출된 총 비점토광물의 함량과 총 점토광물의 함량에서 10 wt% 차이는 마찰계수에 큰 영향을 미치지 않는 것으로 보인다. 반면, BGS 3-2와 유사한 총 조암 및 점토광물 함량을 보인 BGS 3-1은 모든 시료 중에서 가장 낮은 마찰계수가 측정되었다. 이는 몬모릴로나이트 함량에 기인한 것으로 보인다(표 1).
XRD 정량분석에서 BGS 3-1은 몬모릴로나이트가 9.5 wt%로 가장 많이 산출되었다. SCL 1-2에서 2.1 wt%로 산출된 것을 제외하고, 다른 모든 시료들(SCL 1-1, SCL 1-3 그리고 BGS 3-2)에는 몬모릴로나이트가 없는 것으로 나타났다.
3.2 미구조 특성
두 지역(SCL, BGS)의 시료 모두 기질부(matrix)는 주로 판상의 점토광물(일라이트, 녹니석)로 이루어져 있고, 입자들은 대부분 XRD 정량분석결과와 일치하는 석영, 장석 등으로 관찰되었다. 미구조분석은 전단방향에 따라 발달하는 전단띠 형태로 구분하였고, 명명법(Logan et al., 1992)과 전단방향은 그림 9에 삽입된 모식도와 같다.
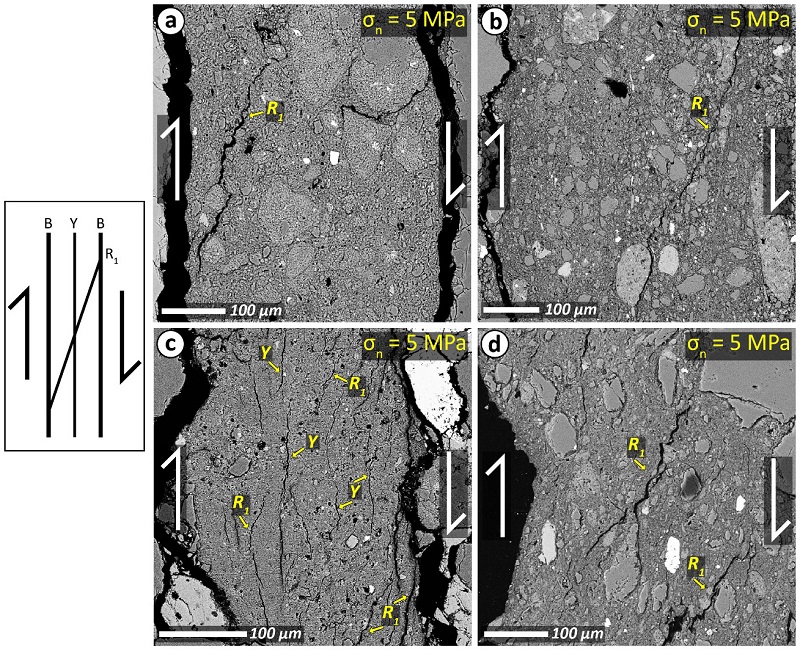
BSE photograph of the samples subjected to σn=5 MPa and deformed up to a shear displacement of 20-25 mm. (a) SCL 1-1, (b) SCL 1-3, (c) BGS 3-1, and (d) BGS 3-2. The sense of shear is indicated by the arrows on each of the photographs. A schematic diagram (following Logan et al., 1992) shows typical shear localizations formed in a deformed gouge layer. Following distributed shear, evolution progress form R1 (Riedel shear), to B (boundary shear), and Y (boundary-parallel shears). Note that BGS 3-1 shows a noticeable development of R1 and Y-shear compared to other samples.
SCL 1-1의 경우, 10-100 μm 크기의 입자들이 관찰되고, 주로 20 μm 크기의 입자가 주로 분포한다. 전단띠의 발달 정도는 미미하며, R1-전단띠가 발달한 것이 관찰되었다(그림 9a). SCL 1-3은 5-200 μm 정도의 입자들이 불량한 분급을 갖는 것으로 관찰되며, 30-50 μm 크기의 입자가 주로 관찰된다. 또한 단층비지 전면에 걸쳐 입자들이 산발적으로 분포하는 것이 현저하게 관찰된다. 전단띠의 발달은 미미하고, R1-전단띠가 발달한 것이 관찰되었다(그림 9b).
반면, BGS 3-1의 경우, 다른 시료들에 비해 상대적으로 단층비지 내에 입자들이 차지하는 비율이 뚜렷하게 적으며, 좋은 분급을 보이는 주로 5 μm 크기의 입자들이 관찰된다. 또한 다른 시료들에 비해 현저한 전단띠의 발달이 관찰된다. 주로 R1-전단 방향의 얇고 짧은 다수의 전단띠가 전단면 전면에 걸쳐 발달해 있는 것이 특징이다(그림 9c). 또한 R1-전단띠의 발달 이후 계속적인 변형으로 서로 연결되어 전단방향과 거의 평행한 Y-전단띠의 발달도 확인된다. BGS 3-2의 경우 입도분석 결과에서 SCL 1-3과 유사한 입자크기분포를 보였지만, 입자크기가 10-20 μm 정도의 입자들이 주로 분포하는 것이 관찰되며, R1-전단띠의 발달이 관찰되었다(그림 9d).
다른 시료들에 비해 상대적으로 R1-전단띠와 Y-전단띠의 발달이 현저하게 관찰되는 BGS 3-1의 경우, 기질부를 이루고 있는 점토광물이 전단변위 증가와 함께 전단띠 형성에 용이한 방향으로 배열되었음을 의미한다. 또한 단층비지에 존재하는 포화된 몬모릴로나이트도 전단띠를 발달시키는 과정을 더욱 심화시켰을 것으로 판단된다. 몬모릴로나이트는 물에 노출될 경우, 층간(inter-layer) 사이에 물을 함유하게 됨으로써 팽창되는 광물(expendable min-eral)이다. 몬모릴로나이트의 층간에서 흡착된 물은 얇은 막을 형성하여 윤활제 역할을 한다. 이러한 물성 때문에 단층면에 전단력이 가해질 때, 단층비지 내에서 R1-전단띠와 Y-전단띠과 같은 변형구조의 발달을 촉진시켰을 것으로 해석된다. 즉, 단층비지 내부에서 마찰력의 약화를 유발하여, 마찰계수를 낮추게 된다(Summers and Byerlee, 1977; Moore and Lockner, 2004).
그러므로 BGS 3-1의 상대적으로 낮은 마찰계수는 다음과 같이 설명 가능하다. 단층비지 내에 존재하는 물에 포화된 몬모릴로나이트는 전단변위가 증가함에 따라 전단에 유리한 방향으로 배열되는 것을 심화시켜 마찰계수를 낮추는 역할을 한 것으로 보인다. 즉, 마찰계수가 낮다는 것은 단층비지가 잘 미끄러진다는 것을 의미하고, 이는 곧 전단띠의 발달이 잘 이루어 졌음을 지시한다. 미구조 관찰결과 역시 이를 잘 반영하고 있으며, BGS 3-1은 다른 시료들에 비해 전단띠의 발달이 현저하게 관찰된다(그림 9c).
3.3 마찰율 파라미터(a-b)
마찰율 파라미터(friction rate parameter, 이하 a-b)는 기존 단층이 재활성(즉, 파괴) 된 후에 발생하는 슬립거동의 안정성을 해석하는데 이용된다. a-b 값은 전단속도변화(velocity stepping)에 따른 마찰계수의 변화를 실험적으로 측정함으로써 산출된다(그림 5a). 만약 전단속도를 증가시켰을 때 발생하는 마찰계수가 속도변화 전의 마찰계수(μ0)보다 높으면, 즉 a-b>0 (velocity strengthening), 그 단층은 재활성 된 후 안정한 슬립거동(stable slip or aseis-mic slip)을 보인다. 하지만 전단속도를 증가시켰을 때 발생하는 마찰계수가 속도변화 전의 마찰계수(μ0)보다 낮아진다면, 즉 a-b<0 (velocity weakening), 그 단층은 재활성 되어 지진을 유발할 수 있는 불안정한 거동(seismic slip)을 보일 가능성이 있다.
이번 연구에서 각 단층비지의 a-b 값을 산출하기 위해 전단속도변화 실험(velocity stepping test)을 실시하였으며, 그 결과는 그림 10에 제시되어 있다. 수직응력 5 MPa 하에서 BGS 3-1에서 음의 a-b 값이 관찰된 것을 제외하고, 다른 모든 시료 및 실험조건 하에서 양의 a-b 값이 관찰되었다. 즉, 시료를 채취한 단층 분절(segment)에서 단층의 재활이 발생하더라도 지진을 유발하기보다는 안정한 마찰거동을 보일 것으로 판단된다.
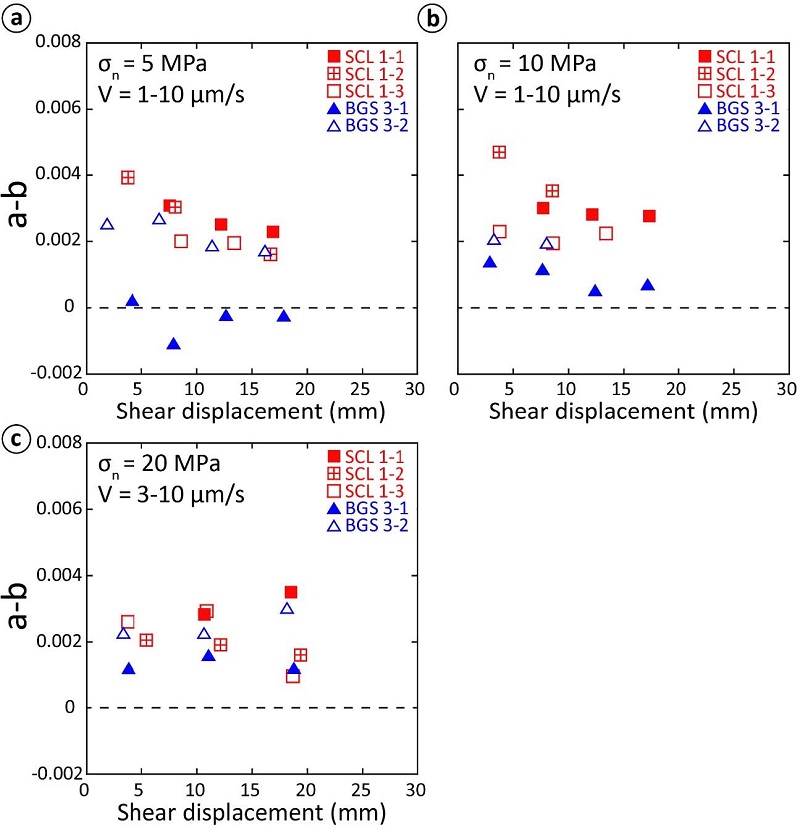
Friction rate parameter (a-b) as a function of shear displacement for the normal stresses, (a) σn=5 MPa, (b) σn=10 MPa, and (c) σn=20 MPa. Note that besides the case of BGS 3-1 at σn=5 MPa, friction rate parameters measured are positive for all the samples and test conditions, suggesting frictional slip after the fault fails exhibits an aseismic (or stable) slip. Additionally, except the case of σn=20 MPa, the friction rate parameter decreases with shear displacement.
또한 전단변위 증가에 따른 마찰율 파라미터의 변화와 관련하여, 수직응력이 5, 10 MPa의 경우 모든 시료에서 전단변위가 증가함에 따라 a-b 값이 감소하는 경향이 관찰(그림 10a, 10b)되었다. 한편 수직응력이 20 MPa의 경우, 전단변위가 증가함에 따라 오직 SCL 1-2와 BGS 3-1에서만 a-b 값이 감소하는 경향이 관찰된다(그림 10c). 전반적으로 전단변위가 증가하면서 a-b 값은 점진적으로 감소하는 경향이 관찰된다. 이는 기존 연구결과와 일치한다. a-b 값은 전단변위가 증가할수록 감소하는 경향을 보이는 것으로 알려져 있고, 이는 전단변위가 지속적으로 단층비지에 축적되면서 전단띠가 발달하는 것과 관련이 있다(Marone, 1998; Mair and Marone, 1999; Saffer and Marone, 2003; Numelin et al., 2007; Ikari et al., 2009, 2011). 즉 이번 연구에서 실험한 시료들은 전반적으로 단층비지 내에 전단띠의 발달이 이루어졌음을 지시하고, 이는 미구조분석에서도 R1-과 Y-전단띠의 형태로 관찰된다.
한편 이상의 결과는 이산화탄소 지중저장과 관련하여 다음과 같은 시사점이 있다. 지하 저장층 내로 CO2 주입은 저장층 내 공극수압의 상승을 초래할 뿐만 아니라 저장층 주변에 존재하는 단층대 내에 공극수압의 상승을 유발한다. 공극수압이 임계압 이상으로 상승할 경우, 단층의 재활성을 초래 할 수 있으며, 이는 지진을 수반할 수 있다. 따라서 지하에서의 단층암이 지표 노두에서의 단층암과 특성이 유사하다면, 이번 연구에서 관찰된 양의 a-b 값은 단층비지를 채취한 양산단층 분절에서 CO2 지중주입에 따른 공극수압 상승으로 인한 단층 재활성이 발생되더라도, 지진을 유발하기 보다는 안정한 슬립거동을 보일 것이라는 것을 지시한다.
4. 토의 및 결론
한반도 남동부에서 인지되는 대표적인 단층 중 하나인 양산단층을 대상으로 마찰특성 연구를 하였다. 시료의 채취는 양산단층이 잘 노출된 상천리(SCL 1-1, 1-2, 1-3)와 보경사(BGS 3-1, 3-2) 인근에 위치한 단층노두에서 이루어졌다. 이번 연구에서 실시한 XRD 정량분석, 입도분석, 실내전단실험, 그리고 미구조분석 결과는 단층 물질에 대한 마찰특성을 설명해줄 수 있다.
단층비지의 광물조성은 마찰계수에 영향을 미치며, 특히 몬모릴로나이트는 팽창성 점토광물로서 물에 포화되면 층간에 흡착된 물이 윤활제 역할을 함으로써 잘 미끄러지기 때문에 마찰계수가 낮은 광물이다. BGS 3-1에서 몬모릴로나이트 함량(표 1)은 다른 시료들에 비해 상대적으로 많고, 이는 다른 시료에 비해 더 잘 미끄러질 수 있는 광물조성을 가지고 있다는 것을 지시한다. 입도분석결과는 실험에 이용된 단층비지의 입도크기가 대체로 0.003-0.025 mm 범위에 속하는 것으로 나타났다. 특징적으로 BGS 3-1의 경우 다른 시료들에 비해 상대적으로 분급이 좋은 세립질의 단층물질로 판단된다.
실내전단실험을 통해 측정된 최대마찰계수는 모든 실험조건(5, 10, 20 MPa)에서 상천리 시료(SCL 1-1, 1-2, 1-3)와 보경사 시료(BGS 3-1, 3-2)의 경우 각각 0.28-0.53, 0.18-0.32의 범위로 측정되었다(그림 8). BGS 3-1은 약 0.2의 마찰계수 값으로 가장 낮은 마찰계수를 갖는다. 미구조 분석결과 대부분의 시료에서는 R1-전단띠의 발달이 관찰된 반면, 마찰계수가 가장 낮은 BGS 3-1은 전단면 전면에 R1-전단띠의 발달과 더불어 Y-전단띠의 발달이 가장 현저하게 관찰된다. 따라서 BGS 3-1의 낮은 마찰계수는 단층비지내의 몬모릴로나이트가 전단에 유리한 방향으로 배열되는 것을 심화시켜 전단띠의 발달을 촉진시킨 결과로 해석된다(그림 9c).
곡선맞춤을 통한 데이터처리로 산출한 마찰율 파라미터는 단층비지의 마찰 안정성과 관련이 있다. 수직응력이 5 MPa 조건에서 BGS 3-1을 제외한 모든 시료와 실험조건에서 양의 a-b값(velocity strength-ening)을 갖는 거동을 보인다(그림 10). 따라서 단층 미끌림의 시작 깊이에서 단층암의 특성이 지표 노두에서와 유사하다고 가정하면, 시료 채취 지역의 양산단층 분절에서 단층의 재활성이 발생하였을 경우, 지진을 유발하지 않는 안정한 거동을 보일 것으로 판단된다.
추후 이번 연구 결과와 시료를 채취한 지역 주변의 현생응력장 크기, 방향, 단층의 자세 등의 자료들과의 종합적인 연구가 필요할 것으로 판단된다. 이번 연구는 실내 전단실험을 통해 양산단층 비지의 마찰특성을 정량적으로 제시함에 의의가 있으며, 추후 CO2 감축을 위한 CO2 포집과 저장(CCS: Carbon Capture and Storage)기술과 관련하여 저장층에 CO2 주입 시, 단층대 주변의 공극압 증가로 인한 단층의 재활성의 평가에도 적용할 수 있을 것으로 전망된다.
Acknowledgments
본 연구는 한국지질자원연구원에서 수행중인 ‘포항분지 해상 소규모 CO2 주입실증 프로젝트(No.2013 2010021760)’의 일환으로 진행된 연구이다. 아울러 이 연구는 기상청 지진기술개발사업(KMIPA2015- 7050)에 의해 부분적으로 지원되었다. 전단실험결과의 해석에 사용된 Matlab 코드를 제공한 일본 JAMSTEC의 Hiroyuki Noda 박사에게 감사를 표한다. 심사과정에서 세심한 의견을 주신 강원대학교 이희권 교수님 그리고 익명의 심사위원께 깊이 감사드린다.
References
-
Brown, K.M., Kopf, A., Underwood, M.B., and Weinberger, J.L., (2003), Compositional and fluid pressure controls on the state of stress on the Nankai subduction thrust: A weak plate boundary, Earth and Planetary Science Letters, 214, p589-603.
[https://doi.org/10.1016/S0012-821X(03)00388-1]

-
Carpenter, B.M., Marone, C., and Saffer, D.M., (2011), Weakness of the San Andreas Fault revealed by samples from the active fault zone, Nature Geoscience, p251-254.
[https://doi.org/10.1038/ngeo1089]

-
Chester, F.M., Evans, J.P., and Biegel, R.L., (1993), Internal Structure and Weakening Mechanisms of the San Andreas Fault, Journal of Geophysical Research, 8, p771-786.
[https://doi.org/10.1029/92JB01866]

- Choi, J.H., Yang, S.J., and Kim, Y.S., (2009), Fault zone classification and structural characteristics of the southern Yangsan fault in the Sangcheon-ri area, SE Korea, Journal of Geological Society of Korea, 45, p9-28, (in Korean with English abstract).
-
Collettini, C., Viti, C., Smith, S.A.F., and Holdsworth, R. E., (2009), Development of interconnected talc networks and weakening of continental low-angle normal faults, Geology, 37, p567-570.
[https://doi.org/10.1130/G25645A.1]

-
Dieterich, J.H., (1978), Time-Dependent Friction and the Mechanics of Stick-Slip, Pure and Applied Geophysics, 116, p790-806.
[https://doi.org/10.1007/BF00876539]

-
Dieterich, J.H., (1979), Modeling of Rock Friction 1. Experimental Results and Constitutive Equations, Journal of Geophysical Research, 84, p2161-2168.
[https://doi.org/10.1029/JB084iB05p02161]

-
Haines, S.H., Kaproth, B., Marone, C., Saffer, D., and van der Pluijm, B., (2013), Shear zones in clay-rich fault gouge: A laboratory study of fabric development and evolution, Journal of Structural Geology, 51, p206-255.
[https://doi.org/10.1016/j.jsg.2013.01.002]

-
Ikari, M.J., Marone, C., and Saffer, D.M., (2011), On the relation between fault strength and frictional stability, Geology, 39, p83-86.
[https://doi.org/10.1130/G31416.1]

-
Ikari, M.J., Saffer, D.M., and Marone, C., (2007), Effect of hydration state on the frictional properties of montmorillonite- based fault gouge, Journal of Geophysical Research, 112, B06423.
[https://doi.org/10.1029/2006JB004748]

-
Ikari, M.J., Saffer, D.M., and Marone, C., (2009), Frictional and hydrologic properties of clay-rich fault gouge, Journal of Geophysical Research, 114, B05409.
[https://doi.org/10.1029/2008JB006089]

- Kang, J.H., and Ryoo, C.R., (2009), The movement history of the southern part of the Yangsan Fault Zone interpreted from the geometric and kinematic characteristics of the Shinheung Fault, Eonyang, Gyeongsang Basin, Korea, Journal of the Petrological Society of Korea, 18, p19-30.
- Kim, C.M., Han, R., and Son, M., (2015), Internal structure of the Yangsan Fault, Bogyeongsa, Pohang: Preliminary results, 2015 Fall Joint Conference of the Geological Science in Korea (Abstracts), Jeju, October 28-31, p322, (in Korean).
- Kim, O.J., Yoon, S., and Gil, Y.J., (1968), Explanatory text of the geological map of Cheonha-sheet, Scale 1:50,000, Technical Report Sheet-7022-I, Geological Survey of Korea (GSK), Seoul, Korea, p36, 1 map sheet (in Korean and English).
-
Lee, S., and Chang, C., (2015), Laboratory experimental study on fracture shear-activation induced by carbon dioxide injection, Journal of Geological Society of Korea, 51, p281-288, (in Korean with English abstract).
[https://doi.org/10.14770/jgsk.2015.51.3.281]

-
Logan, J.M., Dengo, C.A., Higgs, N.G., and Wang, Z.Z., (1992), Fabrics of Experimental Fault Zones: Their Development and Relationship to Mechanical Behavior, In: Evan, B., and Wong, T.F. (eds.), Fault mechanics and transport properties of rocks, Elsevier, New York, p33-67.
[https://doi.org/10.1016/S0074-6142(08)62814-4]

-
Mair, K., Frye, K.M., and Marone, C., (2002), Influence of grain characteristics on the friction of granular shear zones, Journal of Geophysical Research, 107, ECV 4-1-ECV 4-9.
[https://doi.org/10.1029/2001JB000516]

-
Mair, K., and Marone, C., (1999), Friction of simulated fault gouge for a wide range of velocities and normal stresses, Journal of Geophysical Research, 104, p28899-28914.
[https://doi.org/10.1029/1999JB900279]

-
Marone, C., (1998), Laboratory-derived friction laws and their application to seismic faulting, Annual Review of Earth and Planetary Sciences, 26, p643-696.
[https://doi.org/10.1146/annurev.earth.26.1.643]

-
Marone, C., Raleigh, C.B., and Scholz, C.H., (1990), Frictional Behavior and Constitutive Modeling of Simulated Fault Gouge, Journal of Geophysical Research, 95, p7007-7025.
[https://doi.org/10.1029/JB095iB05p07007]

-
Moore, D.E., and Lockner, D.A., (2004), Crystallographic controls on the frictional behavior of dry and water- saturated sheet structure minerals, Journal of Geophysical Research, 109, B03 401.
[https://doi.org/10.1029/2003JB002582]

-
Moore, J.C., and Saffer, D., (2001), Updip limit of the seismogenic zone beneath the accretionary prism of southwest Japan: An effect of diagenetic to low-grade metamorphic processes and increasing effective stress, Geology, 29, p183-186.
[https://doi.org/10.1130/0091-7613(2001)029<0183:ULOTSZ>2.0.CO;2]

-
Numelin, T., Marone, C., and Kirby, E., (2007), Frictional properties of natural fault gouge from a low-angle normal fault, Panamint Valley, California. Tectonics, 26, TC2004.
[https://doi.org/10.1029/2005tc001916]

-
Ruina, A., (1983), Slip Instability and State Variable Friction Laws, Journal of Geophysical Research, 88, p10359-10370.
[https://doi.org/10.1029/JB088iB12p10359]

-
Saffer, D.M., Frye, K.M., Marone, C., and Mair, K., (2001), Laboratory results indicating complex and potentially unstable frictional behavior of smectite clay, Geophysical Research Letters, 28, p2297-2300.
[https://doi.org/10.1029/2001GL012869]

-
Saffer, D.M., and Marone, C., (2003), Comparison smectiteand illite-rich gouge frictional properties: application to the updip limit of the seismogenic zone along subduction megathrusts, Earth and Planetary Science Letters, 215, p219-235.
[https://doi.org/10.1016/S0012-821X(03)00424-2]

- Samuelson, J.E., (2010), Laboratory measurement of shear induced fault zone dilatancy, and numerical estimation of its influence on friction constitutive parameters in quasiundrained scenarios, Ph.D. thesis, The Pennsylvania State University, University Park, p205.
- Son, M., Chong, H.Y., and Kim, I.S., (2002), Geology and Geological Structures in the Vicinities of the Southern Part of the Yonil Tectonic Line, SE Korea, Journal of the Geological Society of Korea, 38, p175-197, (in Korean with English abstract).
-
Summers, R., and Byerlee, J., (1977), A Note on the Effect of Fault Gouge Composition on the Stability of Frictional Sliding, International Journal of Rock Mechanics and Mining Sciences and Geomechanics Abstracts, 14, p155-160.
[https://doi.org/10.1016/0148-9062(77)90007-9]

- Tembe, S., (2007), Experimental constraints on the frictional properties of fault zones through the San Andreas Fault observatory at depth scientific drilling project, Ph.D. thesis, The Stony Brook University, New York, p149.
-
Vrolijk, P., and van der Pluijm, B.A., (1999), Clay gouge, Journal of Structural Geology, 21, p1039-1048.
[https://doi.org/10.1016/S0191-8141(99)00103-0]

- Yun, S.H., Lee, M.W., Koh, J.S., Kim, Y.L., and Han, M.K., (2000), Petrology of the Bokyeongsa Volcanics in the northeast Gyeongsang Basin, Journal of Korea Earth Science Society, 21, p595-610, (in Korean with English abstract).
-
Zoback, M.D., and Gorelick, S.M., (2012), Earthquake triggering and large-scale geologic storage of carbon dioxide, Proceedings of the National Academy of Sciences of the United States of America, 26, p10164-10168.
[https://doi.org/10.1073/pnas.1202473109]

