Impact of rising air temperature on groundwater temperature in Korea

Abstract
Groundwater constitutes the largest reservoir of unfrozen freshwater globally, offering broader accessibility. Consequently, groundwater is in high demand as a resource for irrigation and serves as a significant source of drinking water. Preserving both the quality and quantity of groundwater is therefore a major concern, and groundwater temperature is one of the key factors influencing these attributes. However, compared to surface water, the impact of rising air temperatures on groundwater thermal regimes has not been sufficiently investigated. This study aims to assess the influence of increasing air temperature on groundwater environments by analyzing long-term groundwater temperature data (1996–2022) from 25 monitoring wells across seven metropolitan cities in Korea (Seoul, Incheon, Daejeon, Daegu, Ulsan, Busan, and Gwangju), along with corresponding air temperature data obtained from Korea Meteorological Administration stations. The magnitude and statistical significance of trends in annual mean, maximum, and minimum groundwater and air temperatures were determined using linear regression and the Mann-Kendall test, respectively, while their interrelationship was quantified with Pearson correlation. The analysis revealed an overall increasing trend in groundwater temperatures, with observed warming rates ranging from 0.04 to 1.58℃ per decade. Notably, the most pronounced increase was observed in the minimum groundwater temperature. These findings provide empirical evidence that groundwater warming is not a prospective threat but a contemporary phenomenon, underscoring the necessity of revising national strategies for sustainable water resource management in the context of a changing climate.
초록
지하수는 전 세계에서 동결되지 않은 담수 중 가장 큰 저장고로서 접근성이 높다. 이에 따라 지하수는 농업용수로 널리 이용될 뿐만 아니라 중요한 식수원으로 활용되고 있다. 따라서 지하수의 수질과 수량을 보전하는 것은 매우 중요한 과제이며, 지하수 온도는 이러한 특성에 영향을 미치는 주요 요인 중 하나이다. 그러나 지표수에 비해 기온 상승이 지하수의 열적 특성에 미치는 영향에 대한 연구는 아직 충분하지 않다. 본 연구는 우리나라 7개 대도시(서울, 인천, 대전, 대구, 울산, 부산, 광주)에 위치한 25개 관측정에서 수집된 장기 지하수 온도 자료(1996–2022년)와 기상청 관측소의 기온 자료를 활용하여, 기온 상승이 지하수 환경에 미치는 영향을 평가하였다. 연평균, 최고 및 최저 지하수 온도와 기온의 변화 경향과 통계적 유의성은 각각 선형회귀분석과 Mann–Kendall 검정을 통해 분석하였으며, 두 변수 간의 상관성은 Pearson 상관분석을 통해 정량화 하였다. 분석 결과, 지하수 온도는 전반적으로 상승 경향을 보였으며, 관측된 온난화 속도는 약 0.04 ~ 1.58℃/10년의 범위를 보였다. 특히 최저 지하수 온도에서 가장 두드러진 증가가 관찰되었다. 이러한 결과는 지하수 온난화가 미래의 잠재적 위협이 아니라 현재 진행 중인 현상임을 보여주며, 기후변화에 대응한 지속가능한 수자원 관리 전략의 재검토 필요성을 시사한다.
Keywords:
groundwater thermal regime, air temperature, trend analysis, correlation analysis, climate change키워드:
지하수 열적 특성, 기온, 경향 분석, 상관분석, 기후변화1. Introduction
Global warming is regarded as one of the most pressing environmental issues, primarily driven by human activities such as fossil fuel combustion and large-scale deforestation (Houghton, 2005). Human-induced greenhouse gas emissions have unequivocally contributed to global warming, with the global surface temperature rising by 1.1 ℃ between 2011 and 2020 compared to 1850-1900 levels (IPCC, 2023). Since the Industrial Revolution, the increase in carbon dioxide emissions has amplified the greenhouse effect, which in turn has accelerated global warming (Wadanambi et al., 2020). Global warming can alter the hydrological cycle through mechanisms such as increased cloud cover and latent heat fluxes, thereby intensifying the frequency and severity of extreme weather events such as droughts, storms, and floods (Wang and Liu, 2023). While most global climate models overlook groundwater flows, recent studies suggest that shallow aquifers can significantly influence the climate system by contributing to evapotranspiration, particularly in water-limited regions (Colin et al., 2023). As greenhouse gas concentrations continue to rise, climate change is expected to persist, with potentially profound impacts on groundwater quantity and quality (Earman and Dettinger, 2011). Previous studies have demonstrated that groundwater temperature is strongly influenced by both climate change and urbanization. International studies have reported significant groundwater warming trends. For example, Benz et al. (2018) reported an average temperature increase of approximately 0.36℃ per decade in shallow groundwater across Austria, while Hemmerle and Bayer (2020) observed groundwater warming rates ranging from 0.09 to 0.28℃ per decade depending on depth in Bavaria, Germany. In addition, Turkeltaub et al. (2026) reported that groundwater warming progresses more rapidly in urban areas than in rural regions, suggesting that urbanization can accelerate increases in groundwater temperature. Moreover, even small increases in groundwater temperature may induce changes in groundwater quality, including shifts in dissolved oxygen concentration and pH, highlighting groundwater warming as an important environmental concern (Rie del, 2019). Although previous studies in Korea have also reported increasing groundwater temperature trends in some regions, consistent with findings from other countries (Park et al., 2011; Lee and Han, 2013), studies that systematically compare long-term groundwater temperature variations across multiple metropolitan cities and quantitatively evaluate their relationship with air temperature remain limited.
Groundwater, excluding frozen water, represents the largest freshwater reservoir on Earth (Bovolo et al., 2009). With increasing accessibility to pumping wells, groundwater development for urban, industrial, and agricultural purposes has expanded dramatically worldwide (Konikow and Kendy, 2005; Karunakalage et al., 2024). Consequently, the importance of groundwater withdrawals in global freshwater supply has grown steadily (Siebert et al., 2010). The greater resilience of groundwater to quality degradation and droughts, compared to surface water, makes it a highly demanded source of drinking water, even in regions where surface water is abundant (Jasechko et al., 2024). However, the subtle yet profound impacts of climate change on groundwater systems and their emerging vulnerabilities have become increasingly evident in recent years (Egidio et al., 2024). Ongoing global warming is expected to further intensify the hydrological cycle, not only by increasing variability but also by influencing global monsoon precipitation and seasonal extremes associated with very wet or very dry climates (IPCC, 2023). Research on the impacts of climate change and variability on groundwater has primarily focused on changes in recharge, discharge, and storage, as well as the physical processes that control groundwater flow (Green et al., 2011). Previous multi-continental synthesis studies on subsurface warming have provided critical insights into climate dynamics, but the implications for groundwater resources have been largely overlooked (Benz et al., 2024). This is particularly concerning given that groundwater is a primary source of drinking water in many parts of the world and plays a vital role in sustaining the ecological value of local environments (Kumar, 2012; Lee and Kim, 2021).
Rising groundwater temperatures can lead to problems such as decreased dissolved oxygen, increased Dissolved Organic Carbon (DOC), and elevated manganese (Mn) concentrations (Riedel, 2019). Current groundwater temperatures have increased by up to +1℃ compared to pre-industrial levels and are projected to rise by as much as +10℃ by the end of the 21st century (Neidhardt and Shao, 2023). With ongoing climate warming, subsurface temperatures continue to rise, and by the end of the century, millions of people are expected to live in regions where groundwater temperatures exceed the maximum threshold for drinking water (Klepikova, 2024). Even if current changes appear minor and impacts remain tolerable, groundwater temperatures are likely to continue increasing as a delayed response to past air temperature changes and are expected to rise further under future atmospheric warming scenarios (Hemmerle and Bayer, 2020).
This study investigates the influence of rising air temperatures on groundwater temperature by comprehensively analyzing long-term groundwater temperature data from the national groundwater monitoring network and air temperature records provided by the Korea Meteorological Administration across seven major metropolitan areas in South Korea. The analysis draws on long-term observational data accumulated since 1996, focusing on annual mean, maximum, and minimum groundwater temperatures. A series of statistical approaches, including time-series analysis, the Mann–Kendall test, Pearson correlation analysis, and linear regression, was applied to assess long-term groundwater temperature trends and to evaluate the correlation and sensitivity between air and groundwater temperatures. The limited availability of long-term groundwater temperature records or thermal logs has constrained progress in understanding the thermal dynamics of groundwater systems. This study addresses this gap by presenting an extensive dataset of long-term groundwater temperature observations from metropolitan cities in Korea and provides a cross-sectional analysis of the correlated behavior between air temperature and groundwater temperature.
2. Methods and materials
2.1. Study area
Korea is a peninsula located at the eastern end of the Asian continent, situated to the northwest of Japan and southeast of China (Fig. 1). Geographically, it lies within the mid-latitude temperate climate zone, characterized by four distinct seasons. Its territory spans between 33° and 43° N latitude and 124° and 132° E longitude, with approximately 70% of the country covered by mountainous terrain. As of 2024, the national annual mean temperature was 14.5℃, which is 0.8℃ higher than the previous record of 13.7℃ in 2023. The total annual precipitation was 1,414.6 mm, comparable to the climatological norm of 1,193.2–1,444.0 mm (KMA, 2025). Notably, summer rainfall accounts for about 54% of the annual total.

Locations of the studied metropolitan cities in the Republic of Korea.
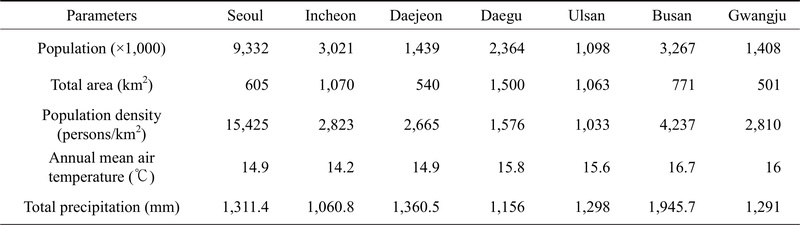
The study area encompasses seven major metropolitan cities in the Republic of Korea (hereafter Korea): Seoul, Incheon, Daejeon, Daegu, Ulsan, Busan, and Gwangju. Among them, Seoul and Incheon are located in the northwestern high-latitude region of the country, Daejeon lies in the central region, Daegu in the southeastern inland, Ulsan and Busan along the southeastern coast bordering the East Sea, and Gwangju in the southwestern inland. Table 1 presents basic information for each study region, including population, area, population density, annual mean air temperature and total annual precipitation. Seoul, the capital of Korea, is situated in a basin surrounded by mountains, with the Han River flowing east to west across the city. As of 2024, its population is 9.33 million, with a total area of 605 km², yielding a population density of 15,425 persons/km². In 2024, the city’s annual mean temperature was 14.9℃ and the total annual precipitation was 1,311.4 mm. The geology of Seoul can be divided into three geologic eras: the Precambrian, Jurassic, and Quaternary (Yun et al., 2007). Incheon, located adjacent to Seoul in the northwest, had a population of 3.02 million in 2024, with a total area of 1,070 km² and a population density of 2,823 persons/km². The city’s annual mean temperature in 2024 was 14.2℃, with a total annual precipitation of 1,060.8 mm. The geology of Incheon is classified into four eras: the Precambrian, Jurassic, Cretaceous, and Quaternary (Yun et al., 2007).

Basic and climatic information of studied metropolitan cities in Korea (as of 2024).
Daejeon is an inland city located in the central region of Korea. As of 2024, the city has a population of 1.44 million, with a total area of 540 km² and a population density of 2,665 persons/km². In 2024, Daejeon recorded an annual mean temperature of 14.9℃ and a total annual precipitation of 1,360.5 mm. The geology of Daejeon can be classified into five geologic eras: Precambrian, undetermined age, Jurassic, Cretaceous, and Quaternary (Yun et al., 2008). Daegu, located in the southeastern inland region of Korea, is characterized by a basin-like topography. Following the incorporation of Gunwi County in 2023, it became the largest metropolitan city in terms of land area. As of 2024, Daegu’s population is 2.36 million, with a total area of 1,500 km² and a population density of 1,576 persons/km². In 2024, the city’s annual mean temperature was 15.8℃, with a total annual precipitation of 1,156.4 mm. The geology of Daegu is broadly classified into two geologic eras: the Cretaceous and the Quaternary (Yun et al., 2010).
Ulsan is located in the southeastern part of South Korea, bordered by the East Sea to the east and Busan to the south. As of 2024, the city has a population of 1.10 million, with a total area of 1,063 km² and a population density of 1,033 persons/km². In 2024, Ulsan recorded an annual mean temperature of 15.6℃ and a total annual precipitation of 1,298 mm. The geology of Ulsan can be classified into three geologic eras: the Cretaceous, Tertiary, and Quaternary (Yun et al., 2011). Busan, also situated in the southeastern region of South Korea, is a coastal city bordered by the East Sea to the east and Ulsan to the north. As of 2024, Busan has a population of 3.27 million, covering a total area of 771 km², with a population density of 4,237 persons/km². In 2024, the city’s annual mean temperature was 16.7℃, and the total annual precipitation was 1,945.7 mm. The geology of Busan is also divided into the Cretaceous, Tertiary, and Quaternary periods (Yun et al., 2011). The final study area, Gwangju, is an inland city located in the southwestern part of South Korea. As of 2024, Gwangju has a population of 1.41 million, with a total area of 501 km² and a population density of 2,810 persons/km². In 2024, the city recorded an annual mean temperature of 16.0℃ and a total annual precipitation of 1,291 mm. The geology of Gwangju can be categorized into five geologic eras: Precambrian, undetermined age, Jurassic, Cretaceous, and Quaternary (Yun et al., 2013). These regional characteristics were considered in interpreting the spatial variability of groundwater temperature trends.
2.2. Collection of groundwater and air temperature data
Groundwater temperature data were obtained from the National Groundwater Information Center, which is part of the national groundwater monitoring network operated under the authority of the Ministry of Environment. The Korean government has annually published reports on groundwater development and use nationwide since 1994, which include information such as well location, groundwater use purpose, well diameter, well depth, and groundwater withdrawal volume (Lee et al., 2021). According to the official notification on the installation and operation of the national groundwater monitoring network, K-water is responsible for operating and maintaining the National Groundwater Monitoring Network, including the measurement, management, and reporting of groundwater level, temperature, and electrical conductivity data (Lee and Kwon, 2016; Ministry of Environment, 2022). The monitoring network is divided into national and auxiliary networks, with groundwater temperature automatically recorded at the national monitoring wells within the national network. As of 2024, the available data span from 1996 to 2022. The observation period varies by site, and in some cases, the records contain gaps or errors. For this study, annual data were used, consisting of three categories, mean, maximum, and minimum groundwater temperatures, for each monitoring well. When both bedrock and alluvial aquifer data were available at the same site, records from both settings were collected. In addition, according to the official response from the National Groundwater Information Center, groundwater temperature is first recorded at an hourly interval and then converted into daily mean values, from which the annual mean, maximum, and minimum temperatures are derived.
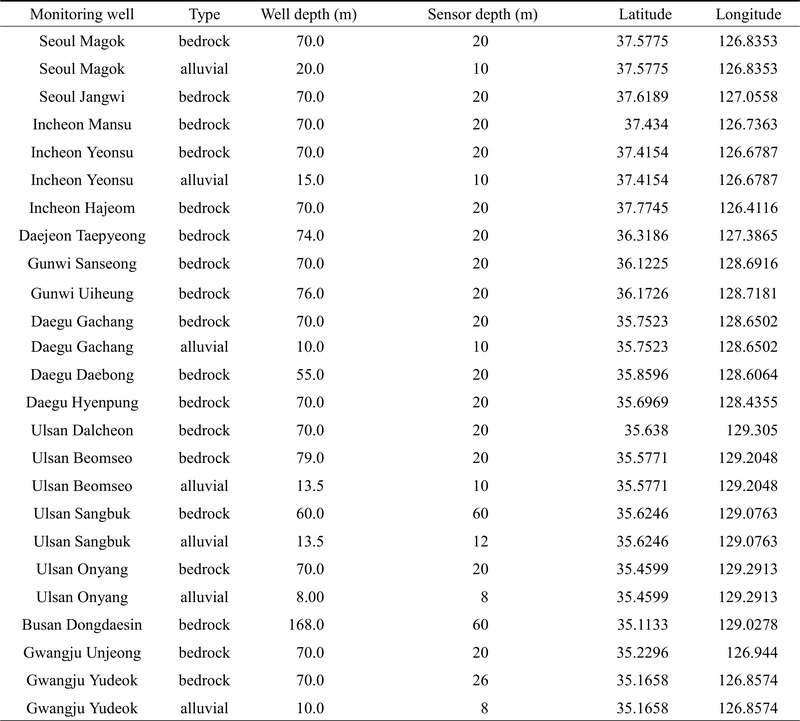
Groundwater temperature data were classified into two aquifer types: deeper bedrock aquifers and shallower alluvial aquifers. Specifications for each monitoring well were obtained from the National Groundwater Information Center’s national network database. The well name, aquifer type, installation depth of the automatic observation device, and geographic coordinates (latitude and longitude) are summarized in Table 2. All depth-related measurements, including well depth and sensor installation depth, are expressed relative to ground level (GL). For the bedrock aquifers, the total well depth ranges from 55 to 168 m, while the automatic observation device is typically installed at 20 m. Exceptions include Ulsan-Sangbuk and Busan-Dongdaeshin, where the device is installed at 60 m, and Gwangju-Yudeok, where it is installed at 25.94 m. For the alluvial aquifers, the well depths range from 8 to 20 m, with the automatic observation device generally installed at 8–10 m. Groundwater temperatures are measured automatically by these devices, and further technical details on each monitoring well can be accessed through the National Groundwater Information Center’s database.
Specifications of the groundwater monitoring wells in the study area.
To ensure consistency in the analysis, all data were collected in 2024, and only monitoring wells with more than 15 years of long-term records were selected for analysis. Upon examination of the collected data, it was found that, in some instances, the relationships among maximum, mean, and minimum groundwater temperatures did not follow the expected physical order. Specifically, cases were identified where the maximum temperature was lower than the mean temperature, or the minimum temperature exceeded the maximum temperature, deviating from the typical temperature relationship (minimum ≤ mean ≤ maximum). In this study, such cases were defined as outliers, and the same criteria were consistently applied to all monitoring wells. Data that lacked physical consistency were considered unreliable, and the corresponding annual records were excluded from the analysis. If outliers accounted for more than 25% of the total observation period for a given well, the well was considered unsuitable for representing long-term variability and was excluded from the analysis. As a result, the Daegu Gunwi-uiheung alluvial monitoring well was excluded. Because the exclusion criteria were limited to records showing physically inconsistent temperature relationships, rather than statistically extreme but physically plausible values, the potential for introducing significant bias into the long-term trend analysis was considered low. Therefore, when outliers accounted for less than 25% of the total observation period, only the affected years were excluded and the remaining data were retained for analysis. The excluded years varied by monitoring well; for example, the Seoul Magok alluvial well (2022), Busan Dongdaesin bedrock well (2000), Incheon Hajeom bedrock well (2001 and 2002), and Ulsan Sangbuk alluvial well (1999, 2000 and 2002-2005) were affected. After this screening process, a total of 25 monitoring wells were selected across the study regions: three in Seoul, four in Incheon, one in Daejeon, six in Daegu, seven in Ulsan, one in Busan, and three in Gwangju.
Air temperature data were obtained from the Automated Surface Observing System (ASOS) operated by the Korea Meteorological Administration (KMA). The ASOS, one of the automatic meteorological observation systems, is installed at official weather stations and automates the observation of meteorological elements, excluding those that require visual observation (KMA, 2024). According to the Standards for the Installation of Meteoro-logical Instruments (Article 3, Paragraph 2) issued by the KMA (2019), air temperature sensors are installed inside Stevenson screens or ventilated radiation shields. The bottom of the Stevenson screen is positioned at a height of 1.0–1.2 m above the ground surface, and the air temperature sensor inside is mounted 1.2–1.5 m above the ground. The radiation shield is installed at a height of 1.2–2.0 m above the ground to ensure adequate air circulation and protection from direct solar radiation.
In this study, annual air temperature data (mean, maximum, and minimum) for each region were collected for the period 1970–2020 to analyze long-term temperature variations and assess the impacts of climate change. Each groundwater monitoring well was paired with the nearest ASOS station based on geographic location, and no additional corrections were applied for differences in elevation or spatial heterogeneity, as the primary objective was to evaluate long-term temperature trends rather than local-scale variability. However, spatial mismatches, including differences in distance and elevation between groundwater monitoring wells and meteorological stations, may introduce some uncertainty in the interpretation of air–groundwater temperature relationships; nevertheless, the selected ASOS stations were considered representative of regional atmospheric conditions.
2.3. Correlation analysis
Correlation is a statistical measure that describes the linear association between two variables. A monotonic relationship implies that as one variable increases, the other tends to either consistently increase or decrease (Schober et al., 2018). Pearson’s correlation coefficient measures the strength of the linear relationship between two continuous random variables (Hauke and Kossowski, 2011). It is a dimensionless statistic ranging from –1 to +1, indicating both the strength and the direction of the linear association (Ratner, 2009). A positive value signifies a direct (proportional) relationship, whereas a negative value indicates an inverse relationship between the variables.
| (1) |
In this study, Pearson correlation analysis was performed to examine the relationship between annual air temperature and groundwater temperature. Pearson correlation is useful for intuitively assessing linear relationships between variables, and in the case of the annual data used in this study, short-term seasonality and lag effects are reduced. Although the relationship between groundwater and air temperature may involve nonlinear or delayed responses, Pearson correlation was used as a first-order approach to evaluate the general association and long-term warming trends between the two variables. Therefore, it was considered an appropriate metric for evaluating the long-term linkage between air temperature and groundwater temperature. The correlation analysis was conducted using three paired datasets: mean air temperature–mean groundwater temperature (mean–mean), maximum air temperature–maximum groundwater temperature (max–max), and minimum air temperature–minimum groundwater temperature (min–min). These pairings were selected to maintain physical consistency between air temperature and groundwater temperature and to assess the consistency of correlation patterns across different temperature metrics (mean, maximum, and minimum). However, it should be noted that Pearson correlation assumes a linear relationship and may not fully capture nonlinearity or complex lag effects in the air–groundwater temperature relationship.
2.4. Trend analysis
The groundwater temperature (GWT) data used in this study constitute a time-series dataset, representing continuous measurements collected over time, which is suitable for analyzing long-term variations (Fulcher et al., 2013). To evaluate these trends, two commonly used approaches were applied: a parametric method (linear regression) and a non-parametric method (Mann–Kendall test) (Hamed and Rao, 1998; Yadav et al., 2014).
To quantitatively assess the long-term variations in groundwater temperature, two statistical analyses were performed in this study: (1) the Mann–Kendall test was applied to examine the statistical significance of monotonic trends, and (2) simple linear regression analysis was used to estimate the rate of change over time. The Mann–Kendall test is a non-parametric method used to determine the statistical significance of monotonic trends. It does not require assumptions about the data distribution and is less sensitive to outliers. In addition, although the Mann–Kendall test is known to be influenced by autocorrelation in time-series data, the use of annually aggregated data in this study reduces short-term serial dependence. Therefore, no additional correction for autocorrelation was applied. However, it is acknowledged that some residual autocorrelation may still exist, which could introduce uncertainty in the interpretation of trend significance.
For the linear regression analysis, the observation year (x) was set as the independent variable, and groundwater temperature (y) as the dependent variable. The slope (β₁) and the coefficient of determination (R²) were calculated for annual mean, maximum, and minimum groundwater temperatures at each monitoring well (Kumari and Yadav, 2018). Although the analysis was based on time-series data, this study did not include a full time-series modeling procedure that accounts for seasonality or autocorrelation. Instead, the focus was placed on evaluating the long-term linear trend in annual groundwater temperatures based on the temporal data. However, simple linear regression has limitations in fully capturing seasonality, autocorrelation, and structural changes inherent in time-series data. Therefore, the estimated slopes (β₁) in this study were interpreted as approximate indicators of long-term trends rather than precise representations of complex temporal dynamics.
3. Results and discussion
3.1. Temporal variations of air temperature in major metropolitan cities
Fig. 2 illustrates the time series of annual mean air temperature variations in seven major metropolitan cities of Korea from 1970 to 2020. Air temperature data were collected in three categories: mean, maximum, and minimum. The results indicate a general increase in air temperature across all study regions. For maximum temperature, little change was observed in Ulsan (0.05 °C/decade), whereas the other cities showed slight upward trends (Seoul: 0.29 °C/decade, Incheon: 0.19℃/decade, Daejeon: 0.19℃/decade, Daegu: 0.13℃/decade, Busan: 0.39℃/decade, Gwangju: 0.30 °C/decade). Annual mean temperature also increased consistently (Seoul: 0.32℃/decade, Incheon: 0.38℃/decade, Daejeon: 0.38℃/decade, Daegu: 0.37℃/decade, Ulsan: 0.30℃/decade, Busan: 0.28℃/decade, Gwangju: 0.10℃/decade). Similarly, minimum temperatures exhibited rising trends in all study regions (Seoul: 0.35℃/decade, Incheon: 0.45℃/decade, Daejeon: 0.47℃/decade, Daegu: 0.53℃/decade, Ulsan: 0.40℃/decade, Busan: 0.42℃/decade, Gwangju: 0.41℃/decade). Among the three categories, the rate of increase in minimum temperature was the most pronounced across the study areas. Overall, Fig. 2 clearly demonstrates that air temperatures in the metropolitan cities of Korea have shown a steadily increasing trend over the past five decades.

Annual variations in maximum, mean, and minimum air temperatures in seven metropolitan cities of South Korea from 1970 to 2020. (a) Seoul, (b) Incheon, (c) Daejeon, (d) Daegu, (e) Ulsan, (f) Busan, (g) Gwangju.
The increase in air temperature in urban areas can be influenced not only by climatic factors but also by the urban heat island (UHI) effect (Kim and Baik, 2002). The UHI effect refers to the phenomenon in which air temperature in urban areas is higher than that in the surrounding suburban or rural areas. This effect tends to be more pronounced at nighttime than during the daytime and is reported to be stronger in inland regions than in coastal regions (Kim and Baik, 2004). In addition, previous studies have suggested that minimum temperature is a sensitive indicator of the UHI effect, and a similar pattern was observed in this study (Hua et al., 2007). These characteristics of the UHI provide important insights into the differences in temperature increase rates among cities observed in this study. As shown in Fig. 2, relatively higher temperature increase rates were observed in some inland cities (e.g., Daejeon and Daegu), although this pattern was not consistent across all inland cities. In contrast, for maximum and mean temperatures, higher increase rates were found in some coastal cities such as Busan and Incheon. These results suggest that the UHI effect alone may not fully explain the differences in temperature increase rates among cities. Instead, these differences are likely influenced by a combination of factors, including oceanic effects, regional meteorological conditions, and city-specific geographic characteristics. Further studies are required to better understand these complex interactions.
According to the 2050 Carbon Neutral Strategy of the Republic of Korea (Government of the Republic of Korea, 2020), the national mean temperature has increased by approximately 1.8℃ over the past century, exceeding the global average (0.8–1.2℃). In particular, the mean temperature has risen by 1.4℃ during the past three decades, indicating an intensified warming trend across the Korean Peninsula. Similarly, Kim and Kim (2011) reported that the mean temperature across South Korea increased by about 1.37℃ between 1954 and 2008, with warming rates exceeding 0.2℃ per decade in highly industrialized metropolitan areas such as Seoul, Incheon, Daegu, Pohang, and Ulsan, demonstrating that urbanization and industrialization have accelerated regional warming. These previous findings are consistent with the upward trend in air temperature observed in this study during 1970–2020. The air temperature warming rates observed in this study ranged from approximately 0.05 to 0.53℃ per decade, which were comparable to, and in some regions higher than, the previously reported warming rate of approximately 0.2℃ per decade. However, these differences may be influenced by variations in study period, regional climatic characteristics, and analytical methods among studies; therefore, direct comparisons should be interpreted with caution.
3.2. Trend analysis of groundwater temperature from bedrock monitoring wells
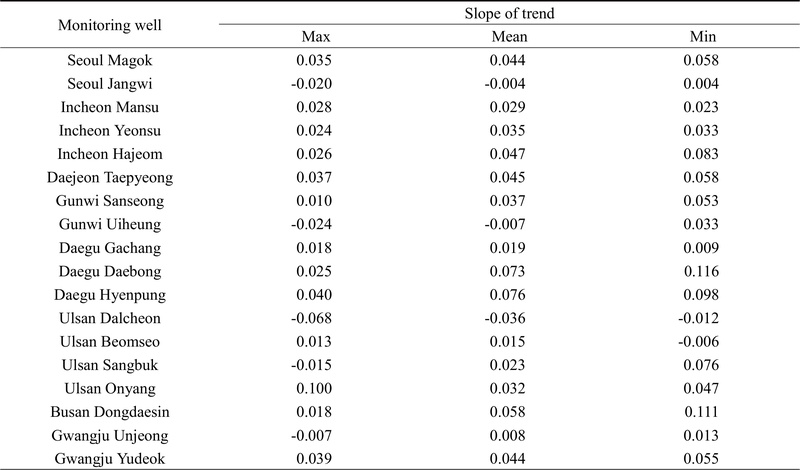
To examine the temporal variations in groundwater temperature, a time-series analysis was conducted. The analysis was performed separately for bedrock and alluvial aquifers, and, as with air temperature, the groundwater temperature data were categorized into three variables: mean, maximum, and minimum. Fig. 3 presents the annual variations in groundwater temperature at representative bedrock wells selected from each study area, with the slope of the trend line indicating the rate of change over time. The axis ranges were adjusted individually for each site to better represent local variability in groundwater temperature. The slope values derived from the time-series analysis of all bedrock wells are summarized in Table 3. A positive slope indicates an increasing trend in groundwater temperature over time, while a negative slope indicates a decreasing trend. Among the 18 bedrock monitoring wells analyzed, 83% (15 wells) showed positive slopes for mean groundwater temperature, 72% (13 wells) for maximum groundwater temperature, and 89% (16 wells) for minimum groundwater temperature. These results suggest that groundwater temperatures at most bedrock monitoring wells are currently exhibiting an overall warming trend. Similar warming trends in groundwater temperature have also been reported in previous studies conducted in various regions, including Europe and East Asia (Kurylyk et al., 2014; Benz et al., 2017). These findings collectively indicate that subsurface thermal regimes are responding sensitively to long-term atmospheric warming. Although a majority of bedrock monitoring wells exhibited positive slopes, indicating an overall warming tendency, caution is required when interpreting these results due to the relatively small sample size and uneven spatial distribution of the wells. In addition, several wells showed negative trends, suggesting the presence of spatial and hydrogeological heterogeneity in groundwater temperature responses. These variations may be influenced by site-specific conditions such as geological characteristics, groundwater flow regimes, and local environmental factors.

Annual variations in maximum, mean, and minimum groundwater temperatures in bedrock monitoring wells. (a) Seoul Magok, (b) Incheon Yeonsu, (c) Daejeon Taepyeong, (d) Daegu Hyenpung, (e) Ulsan Onyang, (f) Busan Dongdaesin, (g) Gwangju Yudeok.
Groundwater temperature trend slopes in bedrock monitoring wells.
3.3. Trend analysis of groundwater temperature from alluvial monitoring wells
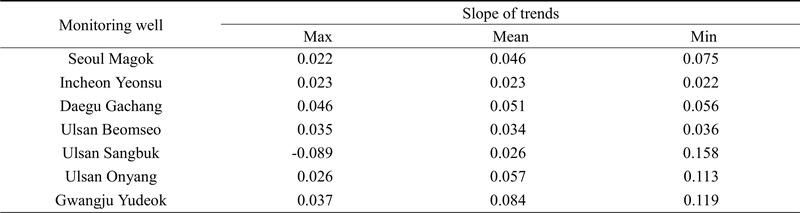
Fig. 4 illustrates the annual variations in groundwater temperature for alluvial aquifers, with the slopes of the trend lines summarized in Table 4. The axis ranges were adjusted individually for each site to better represent local variability in groundwater temperature. Unlike bedrock aquifers, where data were available from all monitoring wells, groundwater temperature measurements in alluvial aquifers were obtained only from a limited number of sites. To ensure the reliability of the long-term trend analysis, only wells with more than 15 years of continuous records were selected, resulting in a total of seven monitoring wells. The selected wells included one each in Seoul, Incheon, Daegu, and Gwangju, and three in Ulsan, representing five of the seven study regions. Groundwater temperature data for alluvial aquifers were not available in Daejeon and Busan, as no monitoring wells with sufficient long-term records existed in these areas. As shown in Table 4, most wells displayed a gradual increase in groundwater temperature. The only exception was the Ulsan-Sangbuk well, which exhibited a decreasing trend in maximum groundwater temperature. As noted in Table 2, alluvial aquifer wells are shallower than bedrock wells, with observation devices installed closer to the ground surface, making them more strongly influenced by air temperature. Consequently, groundwater temperatures in alluvial aquifers tend to respond more sensitively to atmospheric temperature changes.

Annual variations in maximum, mean, and minimum groundwater temperatures in alluvial monitoring wells. (a) Seoul Magok, (b) Incheon Yeonsu, (c) Daegu Gachang, (d) Ulsan Beomseo, (e) Ulsan Sangbuk, (f) Ulsan Onyang, (g) Gwangju Yudeok.
Groundwater temperature trend slopes in alluvial monitoring wells.
This depth-dependent thermal response has also been reported in previous studies, which demonstrated that shallow or near-surface aquifers exhibit more rapid and pronounced temperature variations in response to surface heat flux and atmospheric temperature fluctuations (Kurylyk et al., 2014; Menberg et al., 2014; Benz et al., 2017). These previous findings support the present observation that alluvial aquifers, being shallower and hydraulically connected to the surface, are more thermally sensitive to atmospheric influences than deeper bedrock systems.
3.4. Mann-Kendall test of groundwater temperature
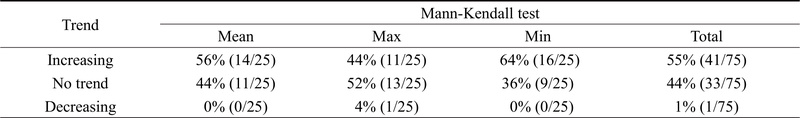
To evaluate the monotonic trends of annual groundwater temperature time series without assuming a specific distribution, the Mann–Kendall test was applied. Similar to the time-series analysis, the Mann–Kendall test was performed using three categories of annual groundwater temperature data; mean, maximum, and minimum. The results are presented in Fig. 5 and Table 5. Fig. 5 displays the Mann–Kendall outcomes as a stacked bar chart, with three categories distinguished increasing trends (orange), no trend (blue), and decreasing trends (gray). These results suggest that groundwater warming may be more sensitive to changes in lower temperature ranges than to variations in mean temperature.

Results of the Mann-Kendall test for groundwater temperature.
Results of the Mann-Kendall tests for annual groundwater temperatures.
Among the 25 monitoring wells, 56% (14 wells) showed increasing trends in mean groundwater temperature, while 44% (11 wells) exhibited no significant trend. No decreasing trends were observed for mean groundwater temperature. For maximum groundwater temperature, 44% (11 wells) indicated increasing trends, 52% (13 wells) showed no trend, and 4% (1 well) exhibited a decreasing trend. In the case of minimum groundwater temperature, 64% (16 wells) displayed increasing trends and 36% (9 wells) showed no trend, with no decreasing trends observed. When combining all three categories (mean, maximum, and minimum), 55% (41 cases) exhibited increasing trends, 44% (33 cases) showed no trend, and only 1% (1 case) indicated a decreasing trend. The Mann–Kendall test results revealed that the proportion of increasing trends was highest for minimum groundwater temperature, indicating a pronounced monotonic warming tendency. This finding suggests that groundwater temperatures at the lower range are the most responsive and sensitive indicators of long-term atmospheric warming, strongly implying that the overall subsurface thermal environment is gradually shifting toward warmer conditions.
Meanwhile, the Mann–Kendall test is designed to determine the existence and direction of a trend rather than quantifying the magnitude of change. Therefore, in this study, the slopes of the time-series trend lines were also presented to complement the quantitative interpretation (Tables 3 and 4). Overall, the slopes were predominantly positive, consistent with the directional outcomes of the Mann–Kendall test. The predominance of positive slopes indicates that the thermal regime of groundwater in the study areas is gradually but persistently shifting toward warmer conditions. However, the amount and continuity of groundwater temperature data varied among monitoring sites, suggesting that trends may be less distinct at locations with shorter or discontinuous records. As the statistical power of the Mann–Kendall test is known to increase with sample size and trend magnitude, shorter or incomplete time series may reduce the detectability of trends (Yue et al., 2002). Accordingly, while the results demonstrate a gradual rise in the thermal background of groundwater across the study areas, more refined follow-up studies are needed to enhance interpretive reliability. In particular, future investigations should include seasonal trend analyses and depth-dependent assessments to more comprehensively capture temporal variability. Furthermore, incorporating spatial analyses that examine the relationships among groundwater temperature variation, atmospheric warming, land-use change, and hydrogeological characteristics would provide a clearer understanding of the mechanisms driving subsurface thermal evolution and improve the reliability of long-term trend interpretations.
3.5. Correlation between air and groundwater temperatures
By synthesizing the results of the time-series analysis and the Mann–Kendall test, it was confirmed that both air temperature and groundwater temperature in the seven metropolitan cities of South Korea exhibit predominant increasing trends. To further evaluate the linear relationship between these two variables, which displayed similar patterns, Pearson correlation analysis was conducted.
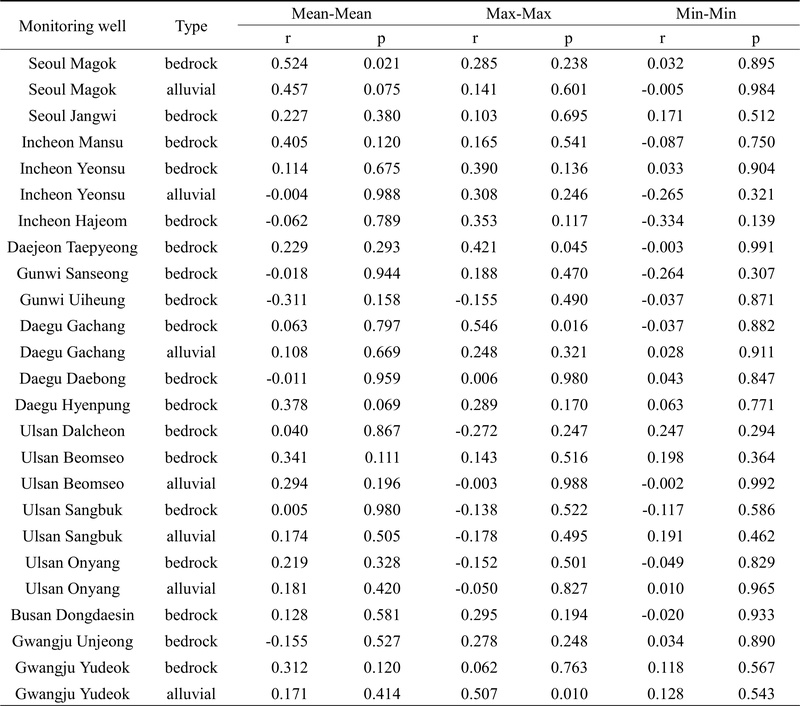
The results for the 25 monitoring wells are summarized in Table 6, which presents the correlation coefficients (r) and corresponding p-values. According to Table 6, mean-mean showed positive correlations in 19 out of 25 wells (76%), with r values ranging from 0.006 to 0.524. Max-max exhibited positive correlations in 18 wells (72%), with r values ranging from 0.006 to 0.547. Min-min showed positive correlations in 13 wells (52%), with r values rangings from 0.01 to 0.247. Although most monitoring wells exhibited positive correlations between air temperature and groundwater temperature, statistical significance was limited at several sites. This pattern can be attributed to the intrinsic thermal properties of the subsurface. Menberg et al. (2014) reported that thermal signals generated at the land surface become damped and delayed as they propagate through the unsaturated zone due to heat conduction and the high thermal capacity of subsurface materials. Similarly, Figura et al. (2011) demonstrated that climatic signals reaching groundwater systems are weakened and delayed relative to atmospheric or river temperature variations. Patton et al. (2025) further showed that groundwater temperatures reflect an attenuated and damped form of the land surface temperature waveform. These time-lag and amplitude-damping effects diminish the direct year-to-year correspondence between air and groundwater temperatures, thereby contributing to the limited statistical significance observed despite the overall predominance of positive relationships. However, the relatively weak correlations, particularly in the min–min comparison, may also reflect the combined influence of other factors, including differences in observation periods, data screening procedures, seasonal variability, groundwater recharge, and site-specific hydrogeological flow conditions.
Pearson correlation coefficients (r) and p-values between annual air temperature and groundwater temperature at the study area.
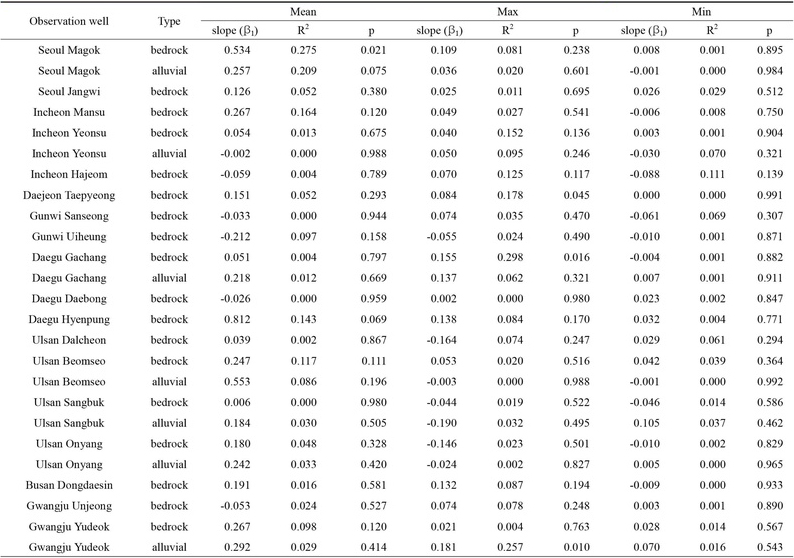
Based on the Pearson correlation analysis, which confirmed positive associations between air temperature and groundwater temperature, a linear regression analysis was additionally performed to quantify the influence of air temperature on groundwater temperature. Scatter plots were constructed for each pairing of mean, maximum, and minimum air and groundwater temperatures, as shown in Fig. 6, and regression lines were fitted accordingly. The resulting regression coefficients are summarized in Table 7. However, despite the overall tendency toward positive regression coefficients, only a few sites demonstrated statistically significant relationships. For mean-mean, significance was observed at only one site: Seoul Magok (bedrock), where β1 = 0.534, R2 = 0.275, and p = 0.022. At most other sites, R2 values were low and p-values exceeded the significance threshold, indicating that the linear relationship based on mean values was generally weak or not statistically significant. In contrast, regression analysis between max-max revealed significant relationships at several sites. Specifically, Daegu Gachang (bedrock) (R2 = 0.299, p = 0.016), Gwangju Yudeok (alluvial) (R2 = 0.257, p = 0.010), and Daejeon Taepyeong (bedrock) (R2 = 0.178, p = 0.046) all showed p-values below 0.05, suggesting that under maximum temperature conditions, groundwater temperature exhibits a statistically significant linear relationship ith air temperature. The coefficients of determination at these sites (R2 > 0.15) further indicate that maximum air temperature can explain a certain proportion of groundwater temperature variability. For min-min, no site yielded p-values below 0.05, and thus no statistically significant relationships were identified. The negative regression coefficients with very low R2 values may arise from the temporal lag and attenuation of atmospheric thermal signals as they propagate into the subsurface. Previous studies have shown that air-temperature variations become progressively damped and delayed with depth (Egidio et al., 2024), resulting in groundwater temperatures that respond with a shifted phase relative to surface conditions. In addition, non-conductive processes such as recharge and advective heat transport can distort the seasonal groundwater-temperature signal, producing deviations from the conduction-only sinusoidal response and leading to non-sinusoidal or skewed patterns in the time series (Patton et al., 2025). Under such conditions, the statistical relationship between minimum air temperature and groundwater temperature may appear weak or even negative, particularly when subsurface hydrological processes exert stronger control than immediate atmospheric forcing. Differences between aquifer types were also observed. For example, while Seoul Magok (bedrock) showed significance in the mean-mean analysis, the corresponding alluvial well at the same location produced results just above the threshold (R2 = 0.21, p = 0.075). Gwangju Yudeok (alluvial) was the only alluvial site with a significant relationship in the maximum–maximum analysis, illustrating that some shallow aquifers can also respond sensitively to atmospheric temperature changes.

Scatter plots of air temperature and groundwater temperature at the Seoul Magok bedrock well: (a) mean, (b) maximum, and (c) minimum values.
Linear regression results between air temperature and groundwater temperature (Values are rounded to three decimal pla
However, the generally low R2 values and lack of statistical significance observed at most sites suggest that groundwater temperature cannot be explained solely by variations in air temperature and is instead influenced by a range of additional factors. This interpretation is consistent with previous findings indicating that groundwater thermal responses are shaped by multiple controls-such as soil moisture content, snowpack depth, precipitation, and site-specific microclimatic conditions-which regulate the transfer of atmospheric thermal signals into the subsurface (Smith, 2023).
4. Conclusion
In conclusion, this study quantitatively assessed the influence of climate change on groundwater temperature by analyzing long-term records (1996–2022) from 25 national monitoring wells in seven major metropolitan cities of South Korea, together with ASOS air temperature data from the Korea Meteorological Administration. Through time-series analysis, the Mann–Kendall test, Pearson correlation, and linear regression, the study comprehensively evaluated long-term trends and the interrelationship between air and groundwater temperatures.
First, the results of the trend analysis and the Mann–Kendall test revealed an overall increasing trend in groundwater temperature, which is consistent with previous studies conducted in Korea (Park et al., 2011; Lee and Han, 2013). In particular, the most pronounced increase was observed in minimum groundwater temperature. This indicates that even at lower thermal ranges, the subsurface environment is gradually warming, suggesting a long-term shift of groundwater systems toward sustained warming. Second, Pearson correlation analysis confirmed positive correlations between air temperature and groundwater temperature at most monitoring wells, although statistically significant results were limited to a subset of sites. Notably, the correlations were more evident under maximum temperature conditions than under mean values, implying that extreme air temperature fluctuations exert stronger influences on the thermal regime of groundwater. Third, linear regression analysis showed predominantly positive slopes across the monitoring wells, suggesting an overall positive association between air temperature and groundwater temperature. However, statistically significant regression relationships were identified only at a few sites: Seoul Magok (bedrock), Daegu Gachang (bedrock), Daejeon Taepyeong (bedrock), and Gwangju Yudeok (alluvial). Most sites exhibited low R2 and high p-values, highlighting that groundwater temperature cannot be fully explained by air temperature alone.
Groundwater warming trends observed in this study ranged from approximately 0.04 to 1.58℃ per decade, depending on monitoring site and aquifer type. Previous international studies have reported comparable warming trends; for example, Benz et al. (2018) reported an average groundwater warming rate of approximately 0.36℃ per decade in Austria, while Hemmerle and Bayer (2020) observed warming trends ranging from 0.09 to 0.28℃ per decade in Germany depending on monitoring depth. Compared with these previous studies, groundwater warming trends observed in Korea showed a broader range. However, these differences are likely attributable to variations in monitoring depth, study period, climatic conditions, and levels of urbanization among studies. In particular, given that this study focused on monitoring networks located in metropolitan areas and that some extreme values were derived from specific temperature metrics (e.g., minimum groundwater temperature), direct comparison with the average warming rates reported in international studies should be interpreted with caution. Nevertheless, such cross-country comparisons provide an important basis for understanding how groundwater warming observed in Korea fits within broader global climate change patterns and for interpreting its relative characteristics.
The true significance of this study lies not only in identifying long-term variations in groundwater temperature but also in empirically demonstrating the impacts of climate change on the thermal stability of groundwater systems. Groundwater is not only a vital resource for drinking water, industry, and agriculture, but it is also closely linked to diverse environmental processes, including the maintenance of baseflow in rivers, the preservation of groundwater-dependent ecosystems, and the regulation of water quality and aquatic biogeochemical cycles. Thus, the long-term warming of groundwater represents more than a simple physical change; it poses profound implications for the availability of water resources, the health of ecosystems, and ultimately the sustainable development of local communities. By focusing on major metropolitan areas in Korea, this study highlights that groundwater warming is no longer a potential risk of the future but an ongoing reality, thereby providing critical scientific evidence that must be taken into account in future water resource management policies and climate change adaptation strategies.
Acknowledgments
We would like to thank the National Groundwater Information Center (GIMS) and the Korea Meteorological Administration (KMA) for providing access to the groundwater and meteorological datasets used in this study. This research was supported by Basic Science Research Program through the National Research Foundation of Korea (RS-2019-NR040076) funded by the Ministry of Education (2026). This work was supported by the National Research Foundation of Korea (NRF) grant funded by the Korea government (MSIT) (RS-2024-00352562).
References
-
Benz, S.A., Bayer, P. and Blum, P., 2017, Global patterns of shallow groundwater temperatures. Environmental Research Letters, 12, 034005.
[https://doi.org/10.1088/1748-9326/aa5fb0]

-
Benz, S.A., Bayer, P., Winkler, G. and Blum, P., 2018, Recent trends of groundwater temperatures in Austria. Hydrology and Earth System Sciences, 22, 3143-3154.
[https://doi.org/10.5194/hess-22-3143-2018]
-
Benz, S.A., Irvine, D.J., Rau, G.C., Bayer, P., Menberg, K., Blum, P., Jamieson, R.C., Griebler, C. and Kurylyk, B.L., 2024, Global groundwater warming due to climate change. Nature Geoscience, 17, 545-551.
[https://doi.org/10.1038/s41561-024-01453-x]
-
Bovolo, C.I., Parkin, G. and Sophocleous, M., 2009, Groundwater resources, climate and vulnerability. Environmental Research Letters, 4, 035001.
[https://doi.org/10.1088/1748-9326/4/3/035001]
-
Colin, J., Voldoire, A., Decharme, B. and Krinner, G., 2023, Groundwater feedbacks on climate change in the CNRM global climate model. Journal of Climate, 36, 7219-7234.
[https://doi.org/10.1175/JCLI-D-22-0767.1]
-
Earman, S. and Dettinger, M., 2011, Potential impacts of climate change on groundwater resources - a global review. Journal of Water and Climate Change, 2, 213-229.
[https://doi.org/10.2166/wcc.2011.034]
-
Egidio, E., De Luca, D.A. and Lasagna, M., 2024, How groundwater temperature is affected by climate change: A systematic review. Heliyon, 10, e27762.
[https://doi.org/10.1016/j.heliyon.2024.e27762]
-
Figura, S., Livingstone, D.M., Hoehn, E. and Kipfer, R., 2011, Regime shift in groundwater temperature triggered by the Arctic Oscillation. Geophysical Research Letters, 38, L23401.
[https://doi.org/10.1029/2011GL049749]
-
Fulcher, B.D., Little, M.A. and Jones, N.S., 2013, Highly comparative time-series analysis: The empirical structure of time series and their methods. Journal of The Royal Society Interface, 10, 20130048.
[https://doi.org/10.1098/rsif.2013.0048]
- Government of the Republic of Korea, 2020, Korea’s 2050 Carbon Neutrality Strategy. Government of the Republic of Korea.
-
Green, T.R., Taniguchi, M., Kooi, H., Gurdak, J.J., Allen, D.M., Hiscock, K.M., Treidel, H. and Aureli, A., 2011, Beneath the surface of global change: Impacts of climate change on groundwater. Journal of Hydrology, 405, 532-560.
[https://doi.org/10.1016/j.jhydrol.2011.05.002]
-
Hamed, K.H. and Rao, A.R., 1998, A modified Mann-Kendall trend test for autocorrelated data. Journal of Hydrology, 204, 182-196.
[https://doi.org/10.1016/S0022-1694(97)00125-X]
-
Hauke, J. and Kossowski, T., 2011, Comparison of values of Pearson’s and Spearman’s correlation coefficients on the same sets of data. Quaestiones Geographicae, 30, 87-93.
[https://doi.org/10.2478/v10117-011-0021-1]
-
Hemmerle, H. and Bayer, P., 2020, Climate change yields groundwater warming in Bavaria, Germany. Frontiers in Earth Science, 8, 575894..
[https://doi.org/10.3389/feart.2020.575894]
-
Houghton, J., 2005, Global warming. Reports on Progress in Physics, 68, 1343-1403.
[https://doi.org/10.1088/0034-4885/68/6/R02]
-
Hua, L.J., Ma, Z.G. and Guo, W.D., 2007, The impact of urbanization on air temperature across China. Theoretical and Applied Climatology, 93, 179-194.
[https://doi.org/10.1007/s00704-007-0334-3]
-
IPCC., 2023, Climate Change 2023: Synthesis Report. Contribution of Working Groups I, II and III to the Sixth Assessment Report of the Intergovernmental Panel on Climate Change [Core Writing Team, H. Lee & J. Romero (eds.)]. IPCC.
[https://doi.org/10.59327/IPCC/AR6-9789291691647]
-
Jasechko, S., Perrone, D., Befus, K.M., Yu, K. and Rohde, M.M., 2024, Rapid groundwater-level decline and some cases of recovery in aquifers globally. Nature, 626, 833-839.
[https://doi.org/10.1038/s41586-023-06879-8]
-
Karunakalage, A., Lee, J.Y., Daqiq, M.T., Cha, J., Jang, J. and Kannaujiya, S., 2024, Characterization of groundwater drought and understanding of climatic impact on groundwater resources in Korea. Journal of Hydrology, 634, 131014.
[https://doi.org/10.1016/j.jhydrol.2024.131014]
-
Kim, M.-K. and Kim, S., 2011, Quantitative estimates of warming by urbanization in South Korea over the past 55 years (1954–2008), Atmospheric Environment, 45, 5778-5783.
[https://doi.org/10.1016/j.atmosenv.2011.07.028]
-
Kim, Y.-H. and Baik, J.-J., 2002, Maximum urban heat island intensity in Seoul. Journal of Applied Meteorology, 41, 651-659.
[https://doi.org/10.1175/1520-0450(2002)041<0651:MUHIII>2.0.CO;2]
-
Kim, Y.-H. and Baik, J.-J., 2004, Daily maximum urban heat island intensity in large cities of Korea. Theoretical and Applied Climatology, 79, 151-164.
[https://doi.org/10.1007/s00704-004-0070-7]
-
Klepikova, M., 2024, Groundwater warming. Nature Geoscience, 17, 487-488.
[https://doi.org/10.1038/s41561-024-01461-x]
-
Konikow, L.F. and Kendy, E., 2005, Groundwater depletion: A global problem. Hydrogeology Journal, 13, 317-320.
[https://doi.org/10.1007/s10040-004-0411-8]
- Korea Meteorological Administration, 2019, Standards for the installation of meteorological instruments. Korea Meteorological Administration, 3 p.
- Korea Meteorological Administration, 2024, Guidelines for surface meteorological observations. Korea Meteorological Administration, 328 p.
- Korea Meteorological Administration, 2025, 2024 annual climate characteristics. Korea Meteorological Administration, 27 p.
- Kumar, C.P., 2012, Climate change and its impact on groundwater resources. Research Inventy International Journal of Engineering and Science, 1, 43-60.
-
Kumari, K. and Yadav, S., 2018, Linear regression analysis study. Journal of the Practice of Cardiovascular Sciences, 4, 33-36.
[https://doi.org/10.4103/jpcs.jpcs_8_18]
-
Kurylyk, B.L., MacQuarrie, K.T.B. and Voss, C.I., 2014, Climate change impacts on the temperature and magnitude of groundwater discharge from shallow, unconfined aquifers. Water Resources Research, 50, 3253-3274.
[https://doi.org/10.1002/2013WR014588]
-
Lee, J.Y., Cha, J. and Raza, M., 2021, Groundwater development, use and its quality in Korea: tasks for sustainable use: Water Policy, 23, 1375-1387.
[https://doi.org/10.2166/wp.2021.088]
-
Lee, J.-Y. and Han, J., 2013, Evaluation of groundwater monitoring data in four megacities of Korea: Implication for sustainable use. Natural Resources Research, 22, 103-120.
[https://doi.org/10.1007/s11053-013-9205-9]
-
Lee, J.Y. and Kim, H., 2021, Review and suggestions for sustainable development and conservation of groundwater under changing climate. Journal of the Geological Society of Korea, 57, 855-864 (in Korean with English abstract).
[https://doi.org/10.14770/jgsk.2021.57.6.855]
-
Lee, J.Y. and Kwon, K., 2016, Current status of groundwater monitoring networks in Korea. Water, 8, 168.
[https://doi.org/10.3390/w8040168]
-
Menberg, K., Blum, P., Kurylyk, B.L. and Bayer, P., 2014, Observed groundwater temperature response to recent climate change. Hydrology and Earth System Sciences, 18, 4453-4466.
[https://doi.org/10.5194/hess-18-4453-2014]
- Ministry of Environment., 2022, Notice on the Installation and Operation of the National Groundwater Monitoring Network. Ministry of Environment Notice, No. 2022-124.
-
Neidhardt, H. and Shao, W., 2023, Impact of climate change-induced warming on groundwater temperatures and quality. Applied Water Science, 13, 235.
[https://doi.org/10.1007/s13201-023-02039-5]
-
Park, Y.C., Jo, Y.J. and Lee, J.Y., 2011, Trends of groundwater data from the Korean National Groundwater Monitoring Stations: indication of any change?. Geosciences Journal, 15, 105-114.
[https://doi.org/10.1007/s12303-011-0006-z]
-
Patton, A., Briggs, M.A., McKenzie, J.M., Lautz, L.K. and Gordon, R.P., 2025, Using groundwater temperature time-series to reveal subsurface thermal and hydraulic processes. Hydrogeology Journal, 33, 1259-1277.
[https://doi.org/10.1007/s10040-025-02930-2]
-
Ratner, B., 2009, The correlation coefficient: Its values range between +1/−1, or do they. Journal of Targeting, Measurement and Analysis for Marketing, 17, 139-142.
[https://doi.org/10.1057/jt.2009.5]
-
Riedel, T., 2019, Temperature-associated changes in groundwater quality. Journal of Hydrology, 572, 206-212.
[https://doi.org/10.1016/j.jhydrol.2019.02.059]
-
Schober, P., Boer, C. and Schwarte, L.A., 2018, Correlation coefficients: Appropriate use and interpretation. Anesthesia & Analgesia, 126, 1763-1768.
[https://doi.org/10.1213/ANE.0000000000002864]
-
Siebert, S., Burke, J., Faures, J.M., Frenken, K., Hoogeveen, J., Döll, P. and Portmann, F.T., 2010, Groundwater use for irrigation—A global inventory. Hydrology and Earth System Sciences, 14, 1863-1880.
[https://doi.org/10.5194/hess-14-1863-2010]
-
Smith, K.A., O'Sullivan, A.M., Kennedy, G., Benz, S.A., Somers, L.D. and Kurylyk, B.L., 2023, Shallow groundwater temperature patterns revealed through a regional monitoring well network. Hydrological Processes, 37, e14975.
[https://doi.org/10.1002/hyp.14975]
-
Turkeltaub, T., Fire, M. and Bernstein, A., 2026, Rapid groundwater warming in an eastern Mediterranean coastal aquifer linked to urbanization. Journal of Hydrology, 672, 135376.
[https://doi.org/10.1016/j.jhydrol.2026.135376]
- Wadanambi, R.T., Wandana, L.S., Chathumini, K.K.G.L., Dassanayake, N.P., Preethika, D.D.P. and Arachchige, U.S.P.R., 2020, The effects of industrialization on climate change. Journal of Research Technology and Engineering, 1, 86-94.
-
Wang, X. and Liu, L., 2023, The impacts of climate change on the hydrological cycle and water resource management. Water, 15, 2342.
[https://doi.org/10.3390/w15132342]
-
Yadav, R., Tripathi, S.K., Pranuthi, G. and Dubey, S. K., 2014, Trend analysis by Mann–Kendall test for precipitation and temperature for thirteen districts of Uttarakhand. Journal of Agrometeorology, 16, 164-171.
[https://doi.org/10.54386/jam.v16i2.1507]
-
Yue, S., Pilon, P. and Cavadias, G., 2002, Power of the Mann–Kendall and Spearman’s rho tests for detecting monotonic trends in hydrological series. Journal of Hydrology, 259, 254-271.
[https://doi.org/10.1016/S0022-1694(01)00594-7]
-
Yun, H.-S., Lee, J.-Y., Hong, S.-S., Yang, D.-Y., Kim, J.-Y. and Cho, D.-L., 2013, GIS-based areal distribution ratios and characteristics of constituent rocks with geologic ages and rock types in Jeonnam and Gwangju areas. The Journal of the Petrological Society of Korea, 22, 153-177. (in Korean with English abstract).
[https://doi.org/10.7854/JPSK.2013.22.2.153]
-
Yun, H.-S., Lee, J.-Y., Hong, S.-S., Yang, D.-Y., Kim, J.-Y. and Yi, S., 2011, Areal distribution ratio and characteristics of constituent rocks with geologic age and rock type by GIS in Gyeongnam–Ulsan–Busan areas. The Journal of the Petrological Society of Korea, 20, 39-59 (in Korean with English abstract).
[https://doi.org/10.7854/JPSK.2011.20.1.039]
- Yun, H.-S., Lee, J.-Y., Yang, D.-Y. and Hong, S.-S., 2007, Areal distribution ratio of rock types with geologic ages in the Gyeonggi–Seoul–Incheon areas. The Journal of the Petrological Society of Korea, 16, 208-216 (in Korean with English abstract).
- Yun, H.-S., Lee, J.-Y., Yang, D.-Y. and Hong, S.-S., 2008, Areal distribution ratios of the constituent rocks with the geologic ages and rock types in the Chungbug–Chungnam–Daejeon areas. The Journal of the Petrological Society of Korea, 17, 191-205 (in Korean with English abstract).
- Yun, H.-S., Lee, J.-Y., Yang, D.-Y., Hong, S.-S., Kim, J.-Y. and Yi, S., 2010, Areal distribution ratios of constituent rocks with geologic ages and rock types by GIS in the Gyeongsangbug-Do and Daegu areas. The Journal of the Petrological Society of Korea, 19, 1-18 (in Korean with English abstract).