Water vapor retrievals from the ground-based direct-Sun measurements based on the spectral Langley method
Copyright ⓒ The Geological Society of Korea 2024
Abstract
Water vapor is one of the most important species in the hydrological cycle, mainly emitted from ocean evaporation. In this study, we deployed the Spectral Measurements for Atmospheric Radiative Transfer-spectroradiometer (SMART-s) and AErosol RObotic NETwork (AERONET) instruments at Suwon, South Korea, during the Airborne and Satellite Investigation of Asian Air Quality (ASIA-AQ) campaign from December 2023 to February 2024. The newly developed SMART-s total precipitable water (TPW) retrieval algorithm utilizes direct-Sun measurements based on the spectral Langley calibration method. The SMART-s retrievals of the TPW showed excellent agreement with the collocated AERONET products (correlation coefficient of 0.99, slope of 1.03, and offset of -0.04). The TPW measurements from globally networked SMART-s or Pandora instruments can provide valuable information for analyzing interactions between trace gases (e.g., H2O, NO2, HCHO, SO2, O3), aerosols, and clouds, thereby contributing to understanding its role in the climate and hydrological systems.
초록
대기 중에 존재하는 수증기는 대부분 바닷물의 증발로 인해 대기로 유입되며, 수문순환에 있어 중요한 인자 중의 하나이다. 본 연구에서는 아시아 국제 공동 대기질 캠페인(Airborne and Satellite Investigation of Asian Air Quality; ASIA-AQ)기간 동안 스마트에스(Spectral Measurements for Atmospheric Radiative Transfer-spectroradiometers) 장비와 에어로넷(AERONET) 장비를 설치하여 2023년 12월부터 2024년 2월까지 운영하였다. 새롭게 개발된 전층 수증기량 산출 알고리즘은 다분광랭리 기법에 기반하여 직달광 관측데이터를 사용하며, 에어로넷 데이터와 비교에서 매우 우수한 일관성을 보였다(상관관계: 0.99, 기울기: 1.03, 절편: -0.04). 본 연구의 수증기 전량 알고리즘이 국제 지상원격관측 네트워크에 적용된다면, 미량기체(예, H2O, NO2, HCHO, SO2, O3), 에어로졸, 구름 간의 상호작용을 이해하고 이들이 기후 및 수문순환 시스템에 미치는 영향을 분석하는 데 중요한 정보를 제공할 수 있을 것으로 기대된다.
Keywords:
total precipitable water, spectral langley method, direct-sun measurement, SMART-s, AERONET키워드:
전층 수증기량, 다분광랭리 기법, 직달광, 스마트에스, 에어로넷1. Introduction
Water vapor is the crucial gas of the atmosphere's hydrological cycle (IPCC, 2013), mainly emitted from ocean evaporation. It affects the water cycle in drylands through absorption by soil (Lopez-Canfin et al., 2022) and impacts the global radiation budget by absorbing infrared light, thereby acting as a natural greenhouse gas (Trenberth et al., 2007). Through water evaporation and condensation, water vapor provides the energy to drive moist convection and subsequent precipitation and determines the potential stability of the atmospheric columns (Fragkos et al., 2019). In particular, condensation of water vapor in the lower troposphere induces latent heat and affects the vertical structure of the tropospheric diabatic heating (Trenberth and Stepaniak, 2003). To accurately predict and analyze the climate, it is essential to have a precise understanding and estimation of water vapor. Water vapor measurements are also useful for analyzing the hygroscopic growth of atmospheric particles, thus affecting aerosol optical properties (e.g., Jeong et al., 2018, 2022).
Total precipitable water vapor (TPW) represents the amount of atmospheric water vapor contained in a vertical column of a unit cross-section and can be accurately measured by ground-based sun-tracking instruments based on Beer’s Law. Radiosonde measurements have been used to measure TPW for a long time. However, this measurement has limitations (e.g., freezing of moisture sensors, the release of latent heat, and phase lag can lead the errors in the estimation of moisture) (Campmany et al., 2010). To consider these limitations and the spatial-temporal coverage, several measurements have been developed, including satellite and ground-based measurements, and complement the TPW from radiosonde (e.g., Halthore et al., 1997; Holben et al., 1998; Dostalek and Schmit, 2001; Mears et al., 2015). In particular, the Aerosol Robotic Network (AERONET), a global network of Cimel sun photometer, retrieves the TPW by measuring the water vapor absorption band around 940 nm (Holben et al., 1998), and Several studies extensively have evaluated the AERONET TPW products using microwave radiometry, GPS, and radiosondes data (Sapucci et al., 2007; Campmany et al., 2010; Pérez-Ramírez et al., 2014). POM instruments deployed for the SKY radiometer NETwork (SKYNET) also measure direct solar irradiance from the ground and provide TPW retrievals with aerosol products (Campanelli et al., 2014).
Recently expanding ground-based hyperspectral remote sensing instruments such as the Pandora and Spectral Measurements for Atmospheric Radiative Transfer-spectroradiometer (SMART-s) also retrieve trace gases, including ozone (O3), nitrogen dioxide (NO2), and formaldehyde (HCHO) in addition to the aerosol and TPW. This study aims to develop a retrieval algorithm of the TPW using the SMART-s measurements based on the spectral Langley calibration method (Jeong et al., 2018) to analyze trace gas-aerosol-cloud interactions. To check consistency, we also compared the retrieved water vapor amount with the collocated AERONET measurements in this study.
2. Method
2.1. Measurements
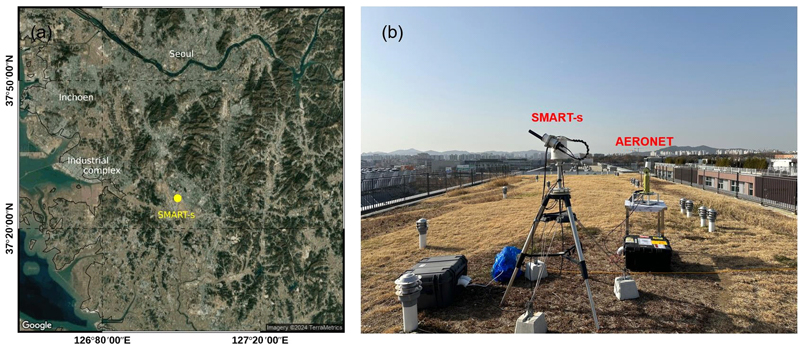
Pandora network group at NASA (National Aeronautics and Space Administration) / GSFC (Goddard Space Flight Center) initially developed the SMART-s instrument (Jeong et al., 2018), and the SMART-s shares most parts of the standard Pandora instrument except for the spectrometer. The same manufacturer (i.e., Avantes; https://www.avantes.com/) built the SMART-s, and the Pandora spectrometer, but the SMART-s covers a wider spectral range (i.e., 280-820 nm) with a lower spectral resolution (~1.0 nm Fullwidth-half-maximum with about ×3.7 oversampling). Detailed information on the SMART-s instrument is summarized in Jeong et al. (2022). We deployed the SMART-s at Suwon, South Korea (37.26°N latitude, 126.99°E longitude), which is a downwind area of the Seoul-Metropolitan area during the Airborne and Satellite Investigation of Asian Air Quality (ASIA-AQ) campaign from 1 December 2023 to 15 February 2024 (see Figure 1). One AERONET instrument was also deployed during this period, and we used the AERONET TPW data (Version 3.0, Level 2.0) to check retrieval consistency in this study.
2.2. Spectral Langley calibration method
The SMART-s algorithm aims to derive information on aerosols and trace gases simultaneously and consists of several retrieval steps from fundamental quantities (i.e., aerosol optical depth and total column amounts of trace gases) to higher-order inversion products (e.g., aerosol optical properties, vertical profiles of atmospheric species) using both the direct-sun and diffuse sky radiances (Jeong et al., 2018, 2020). The spectral Langley calibration method provides total column amounts of aerosols and trace gases based on the Langley method (Jeong et al., 2018, 2022), and Jeong et al. (2018) retrieved spectral aerosol optical depth which showed excellent consistency with the collocated AERONET measurements (Jeong et al., 2018). The SMART-s TPW retrieval algorithm developed in this study utilizes water vapor absorption bands from 550 to 680 nm, whereas the aerosol algorithm uses from 330 to 800 nm. Another difference is that we used the HITRAN (high-resolution transmission molecular absorption database; https://hitran.org/) 2020 water vapor absorption cross-section (Rothman et al., 2013), whereas the aerosol algorithm adopts the Langley optical thickness (Jeong et al., 2018).
3. Results
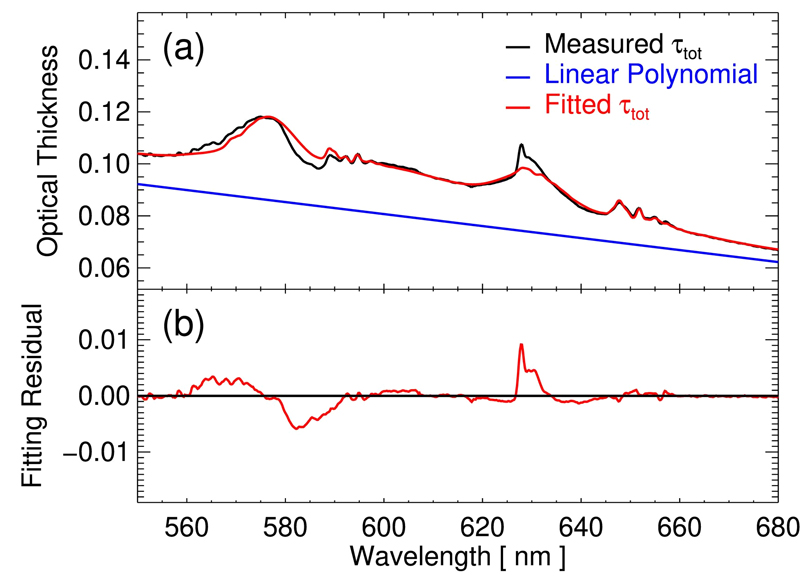
Figure 2a shows an example of the spectral optical thickness fitting result based on the SMART-s algorithm from 550 to 680 nm, where weak water vapor absorption bands are distributed. This sample was measured on 6 January 2024 at 03:37 UTC when the aerosol optical thickness was low. Figure 2b shows the spectral bias of the fitted spectrum from the measured optical thickness, which ranged about ±0.1 at around 380 and 630 nm. These biases are attributable to uncertainties in the calibrated slit function of the instrument and HITRAN database and various broadening processes the SMART-s algorithm does not account for yet. Jeong et al. (2018) adopted 4~5 polynomials for the spectral fitting of the aerosol optical thickness from 330 to 800 nm. In contrast, we adopted two low-order polynomials (i.e., zero and first order) as the fitting window of the TPW spectral fitting is narrower than that of the aerosol algorithm (i.e., 550-680 nm). Note that the low-order polynomials in Figure 2a (blue line) represent aerosol and cloud optical thickness (ACT), which is also useful information for analyzing the water vapor interactions with aerosols and clouds (e.g., Jeong et al., 2018, 2022).

(a) An example of spectral fitting of optical depth in the water vapor absorption band from 550 to 680 nm on 6 January 2024 at 03:37 UTC at Suwon, South Korea. Panel (b) indicates the residual between measured optical thickness and fitting parameters.
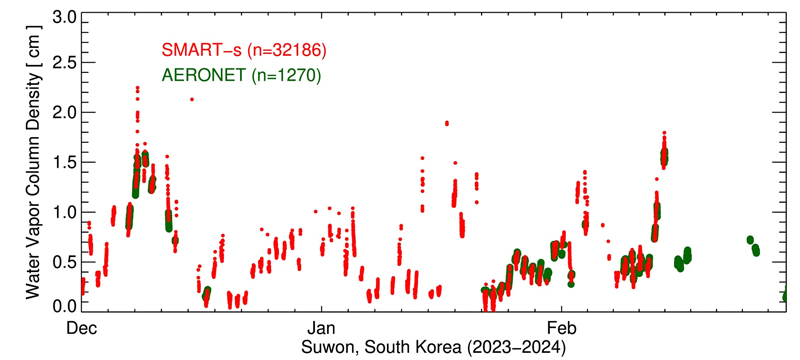
Figure 3 shows temporal variations of the TPW in Suwon retrieved from the AERONET (green) and SMART-s (red) during the measurement period. The AERONET instrument stopped measurements from 16 December 2023 to 22 January 2024 due to connection issues, and the SMART-s stopped operation on 15 February 2024. Wintertime in South Korea is typically dry, and the retrieved TPW data ranges up to 2 cm, as shown in Figure 3. During the measurement period, TPW retrievals from the SMART-s showed excellent consistency with the AERONET products. During the analysis period, 32,186 and 1,270 samples are collected by the SMART-s and AERONET, respectively.

Temporal variation of total precipitable water vapor in Suwon, South Korea, from 1 December 2023 to 28 February 2024.
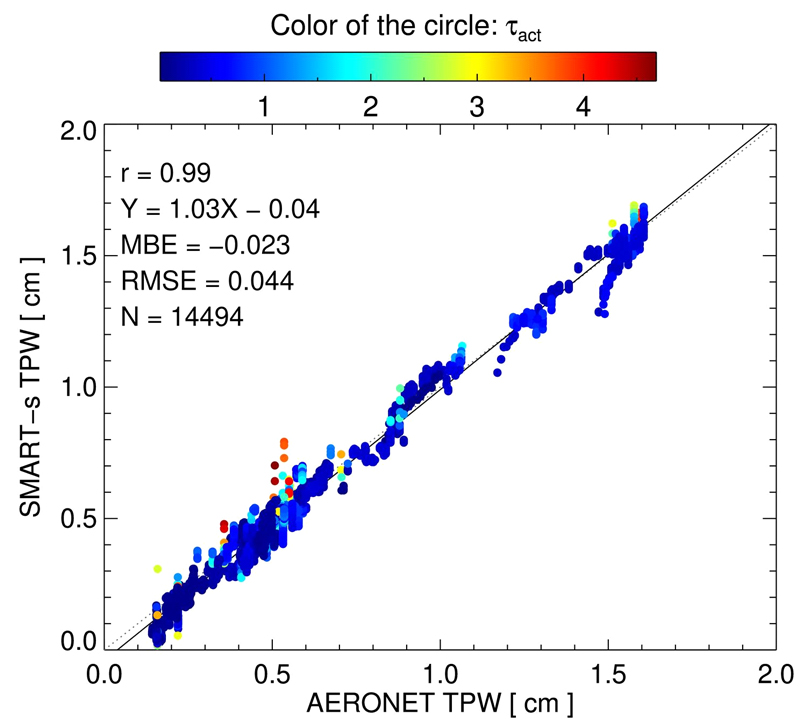
Figure 4 compares retrieved TPW from the SMART-s with the collocated AERONET products during the measurement period. It shows excellent consistency with a correlation coefficient of 0.99 and a mean bias error (MBE) of -0.023. The dotted line depicts a one-to-one line, and the solid line indicates the regression line, which is close together (slope of 1.03 and offset of -0.04). The color of the circles represents the ACT. Relatively higher discrepancies appeared when the ACT is high, as shown in Figure 4. The direct-Sun algorithm assumes all the photons recorded are direct solar irradiance, which is valid when the optical thickness of the atmosphere is low. However, for the thick cloud cases (e.g., ACT > 4.0), measured direct-Sun data could be contaminated by the diffuse sky radiances within the field-of-view (FOV) of the collimator (i.e., ~2.2°). During the quality assurance processes of the SMART-s algorithm, retrievals with optical depths greater than 3.0 and air mass factors higher than 4.0 are screened. In general, the SMART-s direct-Sun TPW retrievals showed good agreement with the benchmark AERONET data.
4. Summary and Discussions
The SMART-s and AERONET were deployed at Suwon, South Korea, during the ASIA-AQ campaign from December 2023 to February 2024. We retrieved the total precipitable water from the SMART-s direct-Sun measurement based on the spectral Langley calibration method in this study. Retrieved TPW from the SMART-s showed excellent agreement with the benchmark AERONET products (correlation coefficient of 0.99, slope of 1.03, and offset of -0.04). In the future, the TPW retrievals, in addition to the previously developed products (e.g., aerosol, cloud, NO2, O3, HCHO) from globally networked instruments, can provide valuable information for analyzing their interactions and impacts on meteorology and climate systems. It also can be used to validate various satellite-based TPW inversion products.
Acknowledgments
이 논문은 2023년도 정부(교육부)의 재원으로 한국연구재단의 G-램프(LAMP) 사업(No. RS-2023-00301702) 및 2024년도 교육부의 재원으로 한국연구재단의 지원을 받아 수행된 지자체-대학 협력기반 지역혁신 사업의 결과입니다(2023RIS-007).
References
-
Campanelli, M., Nakajima, T., Khatri, P., Takamura, T., Uchiyama, A., Estelles, V., Liberti, G.L. and Malvestuto, V., 2014, Retrieval of characteristic parameters for water vapour transmittance in the development of ground-based sun-sky radiometric measurements of columnar water vapour. Atmospheric Measurement Techniques, 7, 1075-1087.
[https://doi.org/10.5194/amt-7-1075-2014]

-
Campmany, E., Bech, J., Rodríguez-Marcos, J., Sola, Y. and Lorente, J., 2010, A comparison of total precipitable water measurements from radiosonde and sunphotometers. Atmospheric research, 97, 385-392.
[https://doi.org/10.1016/j.atmosres.2010.04.016]

-
Lopez-Canfin, C., Lázaro, R. and Sánchez-Cáñete, E.P., 2022, Water vapor adsorption by dry soils: a potential link between the water and carbon cycles. Science of the Total Environment, 824, 153746.
[https://doi.org/10.1016/j.scitotenv.2022.153746]

-
Dostalek, J.F. and Schmit, T.J., 2001, Total precipitable water measurements from GOES sounder derived product imagery. Weather and forecasting, 16, 573-587.
[https://doi.org/10.1175/1520-0434(2001)016<0573:TPWMFG>2.0.CO;2]

-
Fragkos, K., Antonescu, B., Giles, D.M., Ene, D., Boldeanu, M., Efstathiou, G.A., Belegante, L. and Nicolae, D., 2019, Assessment of the total precipitable water from a sun photometer, microwave radiometer and radiosondes at a continental site in southeastern Europe. Atmospheric Measurement Techniques, 12, 1979-1997.
[https://doi.org/10.5194/amt-12-1979-2019]

-
Halthore, R.N., Eck, T.F., Holben, B.N. and Markham, B.L., 1997, Sun photometric measurements of atmospheric water vapor column abundance in the 940-nm band. Journal of Geophysical Research: Atmospheres, 102, 4343-4352.
[https://doi.org/10.1029/96JD03247]

-
Holben, B.N., Eck, T.F., Slutsker, I., Tanŕe, D., Buis, J.P., Setzer, A., Vermote, E., Reagan, J.A., Kaufman, Y.J., Nakajima, T., Lavenu, F., Jankowiak, I. and Smirnov, A., 1998, AERONET-A federated instrument network and data archive for aerosol characterization. Remote Sensing of Environment, 66, 1, 1-16.
[https://doi.org/10.1016/S0034-4257(98)00031-5]

-
Jeong, U., Tsay, S.-C., Giles, D.M., Holben, B.N., Swap, R.J., Abuhassan, N. and Herman, J.R., 2020, The SMART-s trace gas and aerosol inversions: I. Algorithm Theoretical Basis for column property retrievals. Journal of Geophysical Research: Atmospheres, 125.
[https://doi.org/10.1029/2019JD032088]

-
Jeong, U., Tsay, S.-C., Hsu, N.C., Cooper, J.W., Lee, J., Swap, R.J., Holben, B.N., Butler, J.J., Wang, S.-H., Chantara, S., Hong, H., Kim, D. and Kim, J., 2022, Simultaneous retrievals of biomass-burning aerosols and trace gases from UV to near-infrared over northern Thailand during the 2019 pre-monsoon season. Atmospheric Chemistry and Physics, 22, 11957-11986.
[https://doi.org/10.5194/acp-22-11957-2022]

-
Jeong, U., Tsay, S.-C., Pantina, P., Butler, J.J., Loftus, A.M., Abuhassan, N., Herman, J.R., Dimov, A., Holben, B.N. and Swap, R.J., 2018, Langley calibration analysis of solar spectroradiometric measurements: Spectral aerosol optical thickness retrievals. Journal of Geophysical Research: Atmospheres, 123, 4221-4238.
[https://doi.org/10.1002/2017JD028262]

-
Mears, C.A., Wang, J., Smith, D. and Wentz, F.J., 2015, Intercomparison of total precipitable water measurements made by satellite-borne microwave radiometers and ground-based GPS instruments. Journal of Geophysical Research: Atmospheres, 120, 2492-2504.
[https://doi.org/10.1002/2014JD022694]

-
Pérez-Ramírez, D., Whiteman, D.N., Smirnov, A., Lyamani, H., Holben, B.N., Pinker, R., Andrade, M. and Alados-Arboledas, L., 2014, Evaluation of AERONET precipitable water vapor versus microwave radiometry, GPS, and radiosondes at ARM sites. Journal of Geophysical Research: Atmospheres, 119, 9596-9613.
[https://doi.org/10.1002/2014JD021730]

-
Rothman, L.S., Gordon, I.E., Babikov, Y., Barbe, A., Chris Benner, D. and Bernath, P.F., 2013, The HITRAN2012 molecular spectroscopic database. Journal of Quantitative Spectroscopy and Radiative Transfer, 130, 4-50.
[https://doi.org/10.1016/j.jqsrt.2013.07.002]

-
Rubin, J.I., Reid, J.S., Xian, P., Selman, C.M. and Eck, T.F., 2023, A global evaluation of daily to seasonal aerosol and water vapor relationships using a combination of AERONET and NAAPS reanalysis data. Atmospheric Chemistry and Physics, 23, 4059-4090.
[https://doi.org/10.5194/acp-23-4059-2023]

-
Sapucci, L.F., Machado, L.A., Monico, J.F. and Plana-Fattori, A., 2007, Intercomparison of integrated water vapor estimates from multisensors in the Amazonian region. Journal of atmospheric and oceanic technology, 24, 1880-1894.
[https://doi.org/10.1175/JTECH2090.1]

- Stocker, T. (Ed.)., 2014, Climate change 2013: the physical science basis: Working Group I contribution to the Fifth assessment report of the Intergovernmental Panel on Climate Change. Cambridge university press.
-
Trenberth, K.E. and Stepaniak, D.P., 2003, Co-variability of components of poleward atmospheric energy transports on seasonal and interannual time scales. Journal of Climate, 16, 3690-3704.
[https://doi.org/10.1175/1520-0442(2003)016<3691:COCOPA>2.0.CO;2]

- Trenberth, K.E., et al., 2007, Observations: Surface and atmospheric climate change, in Climate Change 2007: The Physical Science Basis. Contribution of Working Group I to the Fourth Assessment Report of the Intergovernmental Panel on Climate Change. edited by S. Solomon et al., Cambridge Univ. Press, Cambridge, U.K., and New York.


