남극 로스해 대륙대 퇴적물의 대자율 이방성 연구: 고수류 변화 복원에 대한 적용 가능성 평가
Copyright ⓒ The Geological Society of Korea 2024
초록
남극 대륙주변부 퇴적물은 기후에 따른 빙하 환경 및 해양 순환 변화의 영향을 받아 고유의 퇴적 특성을 기록한다. 본 연구에서는 로스해 대륙대에서 해류 변동성과 관련된 고환경 복원을 위하여 퇴적상, 입도분포 및 대자율 이방성(Anisotropy of magnetic susceptibility, AMS) 분석을 수행하였다. 퇴적상은 빙운쇄설물이 풍부한 다이아믹트와 조립질 입자가 거의 없는 엽층리 실트로 구분된다. 엽층리 실트 퇴적상에는 파형의 경계부 및 사엽층리가 잘 발달되어 있으며, 이는 지속적인 저층 해류의 영향을 지시한다. 다이아믹트 퇴적상은 생물 교란 구조가 빈번하고 퇴적구조가 뚜렷하지 않지만, 저층 해류의 키질작용에 의한 박층의 역질/사질층이 종종 관찰된다. AMS 분석 결과, 이방성 정도(P')는 퇴적상 및 입도 변화와 연관성을 보이지 않으며, 이는 교란 등에 의한 자성입자의 2차적인 배열의 결과로 판단된다. 따라서 P'의 변동성은 본 연구에서 해류 세기의 직접적인 지시자로 적용하기 어렵다. 그러나 이방성 타원체는 엽층리 실트 및 역질/사질층이 협재된 다이아믹트 구간에서 강화된 편원구조(oblate) 특성을 보이며, 이는 로스해 주변의 지형류에 의한 등수심 퇴적체 형성 모델과 일치한다. 이러한 결과는 자성입자의 배열을 반영하는 자기 이방성 조직이 로스해 저층 해류 순환에 따라 엽층리 형성 및 키질 작용과 같은 퇴적 기작의 변화를 민감하게 반영할 수 있음을 시사하며, 향후 다양한 극지 환경에서의 AMS 연구 및 퇴적 지시자를 이용한 종합적 해석의 필요성을 강조한다.
Abstract
The Antarctic continental margins exhibit unique sedimentary characteristics influenced by climatic changes in glacial environments and oceanic circulation. This study aims to trace the variability of bottom current and associated paleoenvironmental conditions in the Ross Sea continental rise through comprehensive interpretation of sedimentary facies, grain size distribution, and anisotropy of magnetic susceptibility (AMS). The sedimentary facies of the studied core are divided into two, diamictite with abundant ice-rafted debris (IRD) and laminated silt lacking IRD. Silty sediments with well-developed wavy contact and cross laminae indicate the influence of sustained bottom currents. The diamictite layers display faint or absent sedimentary structures and abundant bioturbation, but occasionally contain gravel- and sand-rich layers formed by bottom-current winnowing. AMS results show that the degree of magnetic anisotropy (P') has no consistent relationship with sedimentary facies and grain size variations, probably due to disturbances from secondary magnetic fabrics, and is not regarded as a direct proxy for current intensity. However, enhanced oblate fabrics align with the laminated silts and gravel-rich layers, contourite deposition by geostrophic currents flowing around the Ross Sea. These results imply that magnetic fabrics may sensitively reflect sedimentary processes that vary with bottom current systems in the Ross Sea (e.g., lamination and winnowing), highlighting the need for future magnetic studies in various polar environmental settings.
Keywords:
Antarctica, Ross Sea, paleocurrent variability, anisotropy of magnetic susceptibility, sortable silt키워드:
남극, 로스해, 고수류 변화, 대자율 이방성, 분급성 실트1. 서 론
남극 대륙 주변의 해양 순환은 빙상 하부로 열을 운반함으로써 빙상의 불안정성을 유발하여 전지구 열염순환과 해수면 변화에 중요한 영향을 미친다(Joughin and Alley, 2011; Golledge et al., 2012). 특히 남극종단산맥(Transantarctic Mountains) 서쪽의 서남극(West Antarctica) 지역은 빙상의 대부분이 해수면 아래에 잠겨 있어 동남극에 비해 기후 변화에 더욱 민감하게 반응한다(Hughes, 1973). 서남극과 동남극의 경계에 위치한 로스해(Ross Sea)는 빙붕(ice shelf)과 대륙붕이 넓게 발달한 지역으로(그림 1), 빙상의 성장과 후퇴에 따라 많은 양의 남극저층수(Antarctic Bottom Water)를 형성하여 전지구 해양 순환과 기후 조절 체계에 중추적인 역할을 한다(Orsi et al., 2002; Orsi and Wiederwohl, 2009). 이러한 독특한 지리·해양학적 조건으로 인해 로스해는 과거, 현재, 미래의 기후 변화를 이해하기 위한 주요 연구지역으로 알려져 있다(e.g., Jacobs et al., 2002; Anderson et al., 2014; Schmidtko et al., 2014; McKay et al., 2019).
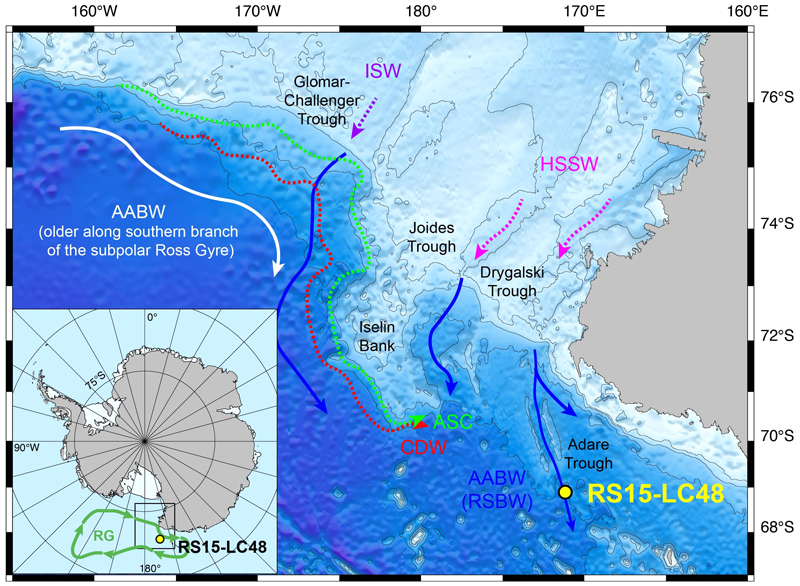
Map of the Ross Sea continental margin and location of the studied core RS15-LC48 (modified from McKay et al., 2017). The principal water masses are illustrated by arrows. ISW (purple): Ice Shelf Water formed by Ross ice shelf melting; HSSW (pink): High Salinity Shelf Water produced on the continental shelf; CDW (red): Circumpolar Antarctic Deep Water; ASC (green): Antarctic Slope Current; AABW (blue and white): Antarctic Bottom Water; RSBW: Ross Sea Bottom Water which is a newly formed AABW from mixture of HSSW and CDW. In the inset: Ross Sea Gyre (RG) modified from Dotto et al. (2018) and the study area (black rectangle).
로스해 대륙주변부의 퇴적작용은 주로 빙상의 전진과 후퇴에 따라 다양한 표층, 사면, 심층 해류의 상호작용에 의해 조절되며, 빙하쇄설류, 저탁류, 등수심 퇴적체 등 고유의 퇴적 기록을 형성한다(Pudsey, 2000; Lucchi et al., 2002; Lucchi and Rebesco, 2007). 빙상의 전진 및 후퇴에 직접적인 영향을 받는 로스해 대륙붕에서는 많은 고기후·고해양 연구가 이루어졌으나, 대륙대 퇴적물은 비교적 지속적인 퇴적 기록을 통해 심해 순환에 대한 정보를 제공할 수 있는 장점이 있음에도 연구결과가 부족한 실정이다. 로스해에서 수행된 이전의 퇴적·지구물리학적 연구는 대륙사면-대륙대의 퇴적 지형 및 구조를 기반으로 마이오세 이후 강화된 저층 해류(bottom current)의 장기 진화를 밝혔다(De Santis et al., 1999; McKay et al., 2019; Conte et al., 2021). 하지만 이러한 퇴적 구조가 항상 뚜렷하게 식별되는 것은 아니며, 남극해 퇴적물의 특성상 유공충 등 생물 기원 탄산염 입자를 이용한 상세한 연대층서 정립의 어려움으로 인해 플라이스토세 동안의 로스해 해류 순환에 대한 정보는 여전히 제한적이다. 선행 연구에 따르면, 플라이스토세 동안 로스해 대륙붕에 접지된 빙상은 기후 전이기(climate transition)에 따라 진화하여, 중기 플라이스토세 전이기(Mid-Pleistocene Transition, MPT; ~700-1,200 ka)에 걸쳐 그 범위가 확장되고 중기 브룬스 전이기(Mid-Brunhes Transition, MBT; ~400-600 ka) 이후 감소한 것으로 추정된다(McKay et al., 2012). 이러한 빙상의 진화는 로스해 해류 체계 또한 기후 전이기에 따라 변화하였을 가능성을 나타낸다(e.g., Albot, 2016; Bollen et al., 2022).
대자율(magnetic susceptibility)은 외부 자기장에 비례하는 시료의 자화 능력을 나타내며, 대자율 이방성(Anisotropy of Magnetic Susceptibility, AMS)은 측정방향에 따라 달라지는 대자율 값에 기반하여 입자의 통계적인 배열상태를 빠르게 추정할 수 있는 지구물리학적 분석 방법이다(Ellwood and Ledbetter, 1979; Doh, 1991; Tarling and Hrouda, 1993; Son et al., 2000). 이러한 원리를 기반으로 해성 퇴적층의 대자율 이방성 분석은 퇴적물 입자의 배열을 제어하는 고수류 방향 및 세기를 재구성하는 데 성공적으로 적용되었다(e.g., Joseph et al., 1998, 2002; Parés et al., 2007; Ohneiser and Wilson, 2018). 그러나 남극 대륙주변부와 같은 고위도 지역에서는 지구자기장의 수평 성분이 작아 고지자기 편각(paleomagnetic declination)의 정확도가 낮기 때문에 퇴적물 시추 코어에 기록된 자북(paleomagnetic north) 방향을 결정하기 어렵고, 이 때문에 편각을 이용한 입자 배열 방향 보정 및 고수류 방향 복원은 제한적이다. 또한 극지의 역동적인 퇴적환경, 즉 빙상의 전진 및 후퇴에 따른 다양한 퇴적작용으로 인한 측정·해석상의 어려움 때문에 남극해 퇴적물에서 대자율 이방성을 적용한 연구는 거의 없다. 본 연구에서는 지난 ~70만년 동안 형성된 남극 로스해 대륙대 퇴적물에서 퇴적상, 입도분포 및 대자율 이방성 분석에 기반한 종합적인 정보를 바탕으로 해류 순환과 관련된 과거 퇴적환경을 추정한다. 또한, 일반적으로 저층 해류 세기 지시자로 이용되는 분급성 실트(sortable silt)와 대자율 이방성 결과의 비교를 통하여 저층 해류 변동성 지시자로서 자기 이방성 조직(magnetic fabric)의 적용 가능성을 평가하고자 한다.
2. 연구시료 및 방법
2.1. 연구지역 및 시료
연구시료는 극지연구소의 2014/2015 남극 탐사(ANA05B) 동안 로스해 서부 대륙대(68°53.9289'S, 171°09.8914'E)에서 회수한 퇴적물 중력코어 RS15-LC48(수심 3,167 m; 길이 1,472 cm)을 이용하였다. 연구 정점은 남극저층수의 주요 유출 경로 중 하나인 Adare Trough의 약 100 km 북쪽에 위치하며(Orsi and Wiederwohl, 2009; Morrison et al., 2020), 저층수 상층에는 고온, 고염의 두꺼운 순환심층수(Circumpolar Deep Water)층이 존재한다(Orsi and Wiederwohl, 2009). 남극사면류(Antarctic Slope Current)는 대륙사면을 따라 서향하는 지형류(geostrophic current)이며, 로스환류(Ross Gyre)의 남쪽 경계와 상호작용한다(Whitworth et al., 1985). 대륙붕에서는 해빙 형성과 염분 방출로 인해 고염대륙붕수(High Salinity Shelf Water)가 생성되며, 고염대륙붕수가 순환심층수와 혼합되어 로스해 남극저층수 의 기원이 되는 고밀도 대륙붕수(Dense Shelf Water)가 심층으로 유출된다(Orsi et al., 1999; Gordon et al., 2009). 이렇게 로스해에서 형성된 남극저층수는 지형을 따라 서쪽으로 확산되어 전지구 심해에 산소를 공급한다(Jacobs, 2004; Orsi et al., 1999).
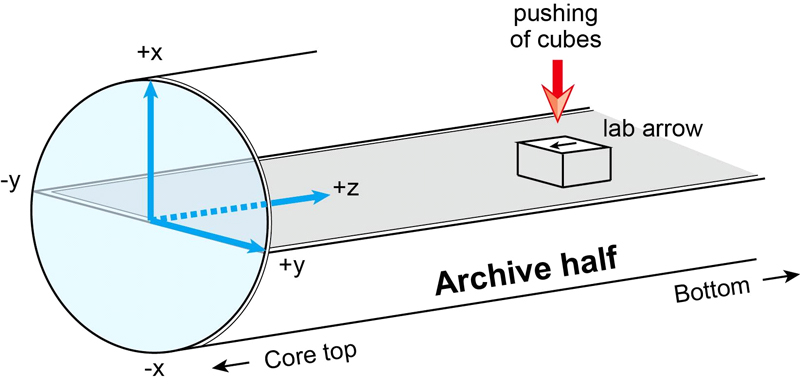
연구 코어 RS15-LC48의 U-channel 시료를 이용한 고지자기 결과에 의하면(Ohneiser et al., 2019), 해당 코어의 최하부는 약 250만 년 전에 해당하며 마지막 지자기 역전 기록인 브룬스-마쓰야마 경계(78만년 전)는 약 430 cm 깊이에서 확인된다(평균 퇴적율 약 0.55 cm/kyr). 본 연구에서는 대자율 이방성 분석을 위하여 코어의 최상부 약 340 cm 구간에서 플라스틱 큐브(7 cm3)를 이용하여 거의 연속적으로 총 152개의 부시료를 채취하였다. 부시료 채취 과정에서 각각의 큐브는 표시된 화살표가 코어 상부 방향을 가리키도록 하여 퇴적물 표면에 부드럽게 밀어 넣었다(그림 2).
2.2. 대자율 이방성 측정
본 연구를 위하여 코어 RS15-LC48의 큐브 시료를 대상으로 한국지질자원연구원이 보유한 Agico MFK1-A Kappabridge의 시료 자동회전·측정 장치를 이용하여 대자율 이방성을 측정하였다. 또한 해당 코어의 부피 대자율(κ)은 코어 스캐닝을 통해 측정되었으며 Ohneiser et al. (2019) 에 의하여 보고된 바 있다. 각 시료에 대해 3차원 대자율 이방성 타원체(AMS ellipsoid)는 서로 수직인 최대(K1), 중간(K2), 최소(K3) 대자율 값을 주축으로 하여 정의된다(Tarling and Hrouda, 1993). 평균 부피 대자율(Km)은 Km = (K1 + K2 + K3)/3으로 계산되며, κ와 유사한 경향성을 비교할 수 있다. 이방성 타원체는 퇴적물의 자기조직(sediment magnetic fabric)을 평가하기 위해 활용되며, 세 주축을 기반으로 계산된 매개변수는 다음과 같다(Jelinek, 1981; Hrouda, 1982): 자기 선구조(L) = K1/K2, 자기 엽리구조(F) = K2/K3, 이방성 변수(P’) = exp{2[(η1 – ηm)2 + (η2 – ηm)2 + (η3 – ηm)2]}1∕2, 형태 변수(T) = [2(η2 – η3) / (η1 – η3)] – 1 (여기서 η1 = ln K1, η2 = ln K2, η3 = ln K3, ηm = (η1 + η2 + η3)/3을 나타냄). P’는 이방성의 정도를 나타내며, 값이 클수록 입자의 정렬이 강해지는 것을 의미하는 고수류 세기의 지표로 사용된다(e.g., Joseph et al., 1998, 2002; Parés et al., 2007). T는 타원체의 형태를 편원형태(Oblate; 0<T≤1) 또는 편장형태(Prolate; –1≤T<0)로 정의한다. 이방성 타원체를 도식화하기 위해 세 주축을 하반구에 투영하였다. 투영망의 좌표계는 시료 좌표계를 따른다. 코어 절단면은 x축에 수직이며, 퇴적물 표면으로 큐브 시료를 밀어 넣는 방향은 –x축 방향이다(그림 2).
2.3. 퇴적상 관찰 및 퇴적물 입도 분석
코어 RS15-LC48의 퇴적상 관찰 결과 및 퇴적물 슬랩(두께 1 cm, 폭 8 cm, 길이 30 cm)에 대한 X-선 사진은 Ohneiser et al. (2019)과 Jung et al. (2019)에서 보고되었다. 본 연구에서는 이전 연구 결과들을 바탕으로 코어 최상부 350 cm 구간에 대해 상세한 퇴적상 관찰을 수행하였다. 또한 X-선 사진으로부터 평균 2 cm 깊이 간격으로 계수된 조립한 빙운쇄설물(>2 mm)의 개수는 McKay et al. (2022)에서 제공된 자료를 이용하였다.
입도 분석을 위해 8 cm 깊이 간격으로 채취된 퇴적물 부시료를 동결 건조한 후, McKay et al. (2022)가 제안한 방법을 따라 과산화수소, 염산 및 수산화나트륨 처리를 통해 생물기원 성분을 제거하였다. 2 mm의 체를 사용하여 조립한 입자를 분리하였다. 이후 극지연구소의 레이저 입도분석기(Malvern Mastersizer 3000)를 사용하여 2 mm 이하의 사질-이질 퇴적물을 대상으로 입도 분포를 측정하였으며, 입도변수는 Folk and Ward (1957)를 따라 계산되었다. 분급성 실트 구간(10-63 μm)의 평균 입도(SS)는 해양퇴적물에서 저층 해류의 속도 지시자로 사용되며, 극지 환경에서도 종종 적용된다(McCave et al., 1995; McCave and Andrews, 2019). 그러나 빙운쇄설물 함량이 높은 극지 퇴적물의 경우 값의 계산은 분급이 불량한 조립질 입자들에 상당한 영향을 받을 수 있기 때문에, Paterson and Heslop (2015)과 Stevenard et al. (2023)의 Matlab 소프트웨어를 이용하여 빙운쇄설물의 영향을 보정한 SSIRD_free 값을 계산하였다.
3. 결 과
3.1. 퇴적상 및 입도분포 특성
코어 RS15-LC48에는 주로 역 및 모래 입자가 풍부한 조립질의 다이아믹트 퇴적상과 조립질 입자가 없거나 드물게 산출하는 엽층리 실트 퇴적상이 교호한다(Ohneiser et al., 2019). 연구 구간(<350 cm)의 실트층에는 대체로 mm 규모의 평행(plana-) 및 사엽층리(cross lamination)가 인지된다(그림 3a). 특히, 70-102 cm 및 270-286 cm에서 엽층리 및 파형(wavy)의 경계부가 잘 발달하며, 상부 및 하부의 경계면이 명확하고 생물교란 구조가 드물다(그림 3a, 4a, 4b). 한편, 모래 입자가 풍부한 다이아믹트에서는 일반적으로 퇴적구조가 뚜렷하지 않고 생교란작용의 흔적이 관찰되지만, 때때로 생물교란이 적은 사질 및 역질층(sand-/gravel-rich layer) 또한 나타난다(예: 280-310 cm) (그림 3a, 3b, 4).
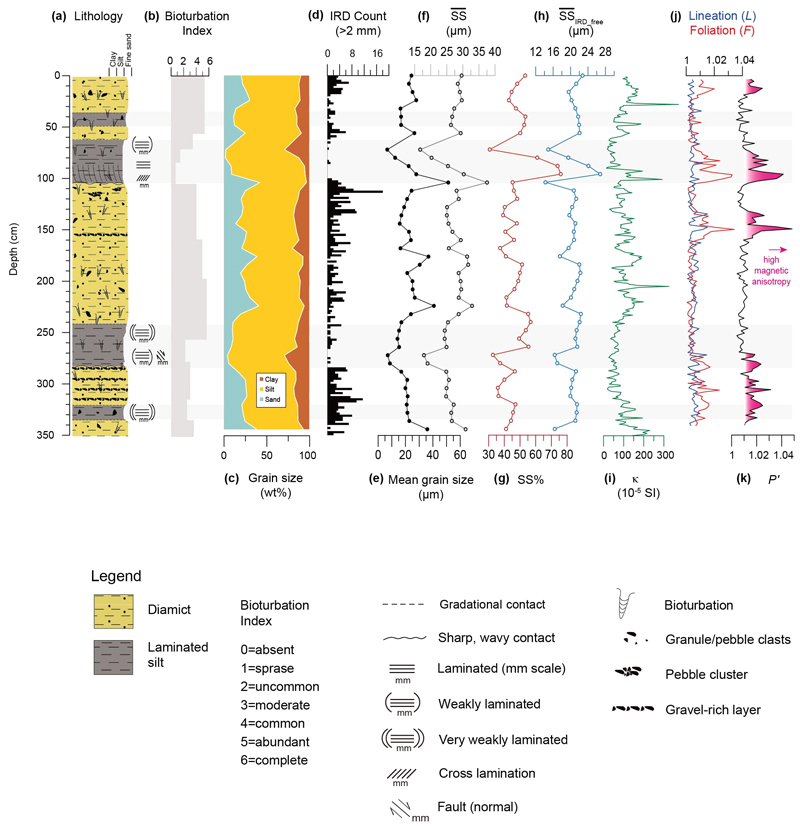
Stratigraphic variations in lithology, grain size and magnetic anisotropy data of core RS15-LC48 (top 350 cm). (a) Lithologic description (modified after Ohneiser et al., 2019), (b) bioturbation index (Albot, 2016), (c) ice-rafted debris (IRD) >2 mm count (McKay et al., 2022), (d) contents of sand (>63 μm), silt (4-63 μm) and clay (>4 μm), (e) mean grain size, (f) mean grain size of sortable silt, (g) content of sortable silt, (h) mean grain size of sortable silt after IRD correction, (i) κ, magnetic susceptibility (Ohneiser et al., 2019), (j) magnetic lineation L and magnetic foliation F, and (k) the corrected degree of anisotropy (P'). Shaded layers represent laminated silts.
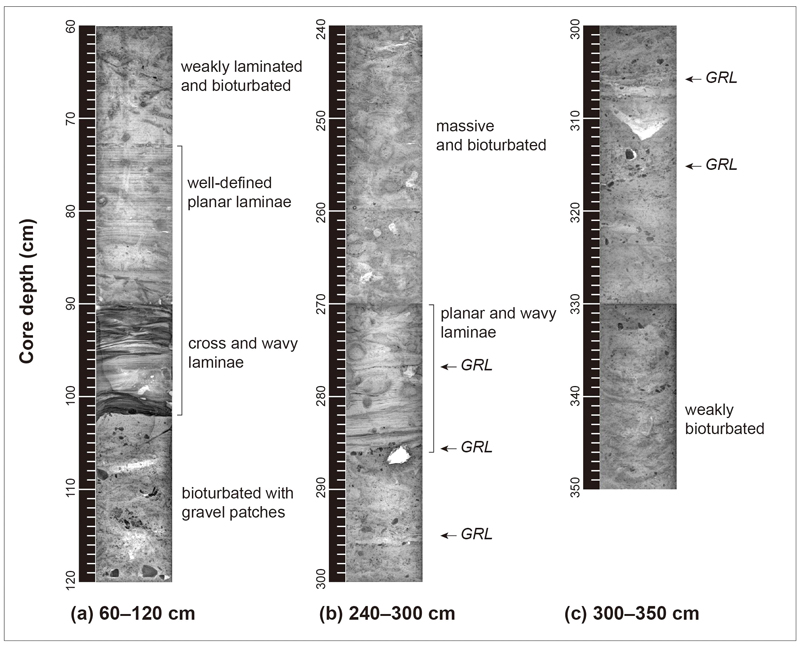
X-ray images of core sections showing characteristics of sedimentary structures and texture. (a) 60-120 cm, (b) 240-300 cm, and (c) 300-350 cm. Gravel-rich layers (GRLs) are marked by arrows.
퇴적물의 입도분포는 다이아믹트 구간에서 높은 모래 함량을, 엽층리 실트 구간에서 높은 세립질 및 조립질 실트 함량을 보인다(그림 3c). 모래 함량 변화는 빙운쇄설물 함량 변화와도 유사한 경향성을 보여(그림 3d), 많은 조립질 입자가 빙운쇄설물의 형태로 유입되었음을 의미한다. 분급성 실트의 평균 입도 및 함량(SS%)은 전체 퇴적물의 평균 입도 및 모래 함량과 유사한 경향을 보인다(그림 3e-3g). 값과 분급성 실트의 분율(SS%)간의 상관계수(correlation coefficient; r)는 상부 350 cm 구간에서 0.21으로 낮아, 선행연구의 결과를 고려할 때 해류에 의한 분급작용의 결과(well current-sorted; r>0.5)로 보기 어렵다(McCave and Andrews, 2019). 반면 값과 모래(>63 μm) 함량간의 상관계수는 0.81로 높은 값을 보이는데, 이는 값이 모래 입자 유입에 주된 역할을 한 빙운쇄설물 함량의 영향을 받았음을 의미할 수 있다(e.g., McCave and Andrews, 2019).
연구시료의 입도 자료에서 빙운쇄설물의 영향을 보정하기 위하여 다수의 end-member (EM)를 사용하여 성분을 분리하는 방법(Stevenard et al., 2023)을 적용하였다. 총 6개의 EM을 이용하여 주성분 분석을 수행한 후, EM1-3을 이용하여 SSIRD_free를 계산하였다(Supplementary 그림 1). 빙운쇄설물 영향을 보정한, SSIRD_free와 SS%IRD_free의 상관계수는 0.87로, 보정 전과 비교하여 크게 증가한 값을 보인다. 코어 깊이에 따른 SSIRD_free값은 전반적으로 엽층리 실트구간 내에서 낮지만(예: ~75 cm, ~105 cm, ~275-280 cm), 사엽층리가 발달한 ~80-100 cm 구간에서는 비교적 높게 나타난다(그림 3h).
3.2. 자기특성
대자율은 일반적으로 퇴적물 내 자성광물의 함량에 비례하며, 대륙주변부에서는 주로 육상기원 퇴적물의 기원지, 운반기작 등 환경 조건에 따른 암석학적 특성 변화를 반영한다. 코어 RS15-LC48의 대자율(κ) 값은 전반적으로 다이아믹트층에서 높고 엽층리 실트에서 낮게 나타나 퇴적물 입도 변화와 연관성을 보인다(Ohneiser et al., 2019). 연구 시료(<350 cm)에서도 마찬가지로 대자율값의 변화는 빙운쇄설물 및 모래 함량과 유사한 경향을 보이며, 이는 조립질 입자가 비교적 풍부한 자성광물을 포함하는 것을 의미한다(그림 3c, 3d, 3i).
연구 시료의 평균대자율(Km) 값은 약 95.0 × 10⁻⁵ SI와 291 × 10-5 SI 사이의 비교적 높은 값을 보이며, 이는 자철석, 마그헤마이트와 같은 페리자성광물(ferrimagnetic minerals)이 퇴적물의 대자율에 주로 영향을 미친다는 것을 지시한다(Tarling and Hrouda, 1993). Ohneiser et al. (2019)는 코어 RS15-LC48에 대한 암석자기 특성 분석을 통해 ~580℃의 큐리온도를 갖는 자철석이 주요 자성광물이며, 자성광물의 자기구역상태(magnetic domain state)가 위단자기구역(pseudo single domain)에 해당함을 확인하였다. 대자율 이방성 분석 측면에서, 이러한 자기특성은 단자기구역(single domain) 자성광물의 자화특성에 의해 이방성 타원체의 축이 뒤바뀌는 역자기조직(inverse magnetic fabric) 효과를 배제할 수 있게 한다(Rochette et al., 1992).
코어 깊이에 따른 이방성 정도(P’) 값은 <20 cm, 60-105 cm, 130-160 cm, 270-340 cm 구간에서 비교적 크게 변동하며(1.004-1.048), 이들은 ~1.01 정도의 낮고 안정적인 P’ 값을 보이는 구간과 교호한다(그림 3k). 본 연구에서는 이를 편의상 각각 높은/낮은 이방성 구간이라고 정의한다. 이러한 P’ 값의 변동은 자기 선구조 L보다는 엽리구조 F와 상관관계를 보이고, 퇴적상과 규칙적인 연관성은 뚜렷하지 않다(그림 3j, 3k). 자기조직 특성은 L과 F의 상관관계를 도식화하는 Flinn diagram (Flinn, 1962) 및 P’-T diagram (Jelínek, 1981)에서 잘 나타난다: 높은 이방성 구간은 비교적 높은 F 값과 양의 T 값으로 인해 편원형 구조 영역에 해당하는 반면, 낮은 이방성 구간은 T 값이 다양하게 분포하여 무작위한 모양을 나타낸다(그림 5a, 5b). 연구시료의 P’-T 관계를 Joseph et al. (1998)이 경험적으로 분류한 퇴적환경과 비교할 때, 낮은 이방성 구간은 원양/반원양 환경에 해당하는 반면, 높은 이방성 구간은 대부분 드리프트(drift) 퇴적체 영역과 일치한다(그림 5b).
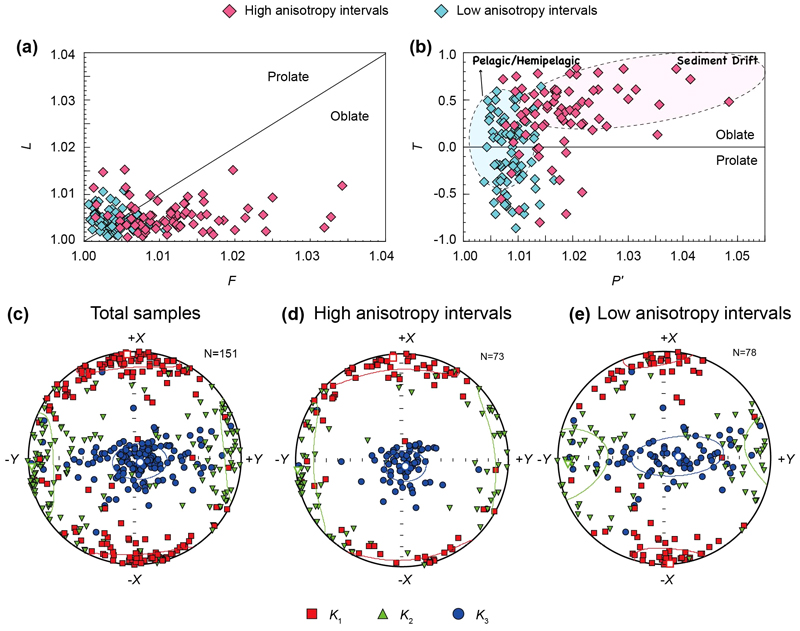
Bivariate plots of AMS parameters and lower hemisphere projections of the three principal AMS axes. (a) Lineation L versus foliation F plotted in a Flinn diagram (Flinn, 1962), (b) The corrected anisotropy degree P' versus the shape parameter T plotted on a Jelínek (1981) plot. Shaded areas in the Jelínek plot represent empirical relationships between magnetic fabric and typical depositional mechanisms determined by Joseph et al. (1998). Projections of the K1 (red), K2 (green), and K3 (blue) axes for (c) the total studied samples, (d) high anisotropy intervals, and (e) low anisotropy intervals. The mean directions of the principal axes are presented as open symbols together with their 95% confidence ellipses.
본 연구에서는 고위도 연구지역 시료의 특성상 고지자기 편각의 불확실성이 높아(Ohneiser et al., 2019) 이방성 타원체의 배열 방향을 지리적으로 복원하지는 못하였으나, 투영망에 도시된 주축의 분포를 이용하여 자기조직과 입자배열 상태를 확인하였다. 연구 시료는 전반적으로 수직방향의 K3 축과 수평면에서 K1 및 K2 축의 거들(girdle) 분포를 보여주며(그림 5c), 이는 일반적으로 수평면에 퇴적된 1차 퇴적 조직을 반영한다(Hrouda, 1982). 높은 이방성 구간은 K3 축이 비교적 군집되어 나타나 이방성 증가와 일치하는 반면(그림 5d), 낮은 이방성 구간은 특히 K2 및 K3축이 크게 분산되어 있음을 보여준다(그림 5e).
4. 토 의
4.1. 퇴적상과 퇴적환경 변화
코어 RS15-LC48에서 반복하여 관찰되는 엽층리와 점이적인 경계 하부의 생교란작용의 흔적은 남극 대륙주변부에서 빙하기-간빙기 퇴적환경 변화에 따라 발달하는 등수심 퇴적체 모델과 유사하다(Rebesco et al., 2014). 연구 구간(<350 cm) 내 사질 다이아믹트의 희미하거나 부재한 엽층리와 광범위한 생물교란구조는 저탁류가 발생하는 높은 에너지의 퇴적환경에서 형성된 것으로 보기 어렵다(Busetti et al., 2003; Rebesco et al., 2014). 그러나 이 구간에서는 역질층(gravel-rich layer)이 종종 발견되며(그림 3, 4), 다량의 빙운쇄설물 유입과 저층 해류에 의한 세립질 입자의 침식을 수반한 키질 작용(erosional winnowing)에 의한 것으로 해석된다(Stow and Piper, 1984; Howe et al., 2001; Bollen et al., 2022). 이는 퇴적환경 내 세립한 이질/실트질 입자를 제거할 수 있는 강도의 해류의 영향이 있었음을 의미하지만, 그 수준은 침식에 의한 부정합면이 아닌 연속적인 퇴적기록을 형성하는 정도였을 것으로 보인다(e.g., Drewry and Cooper, 1981).
70-102 cm 구간의 엽층리 실트에서 잘 발달된 사엽층리, 파형의 명확한 하부 경계 및 생물교란의 감소는 지속적인 저층 해류의 영향으로 해석된다(그림 3, 4). 이 구간에서 모래 함량이 적은 것은 저층 해류의 속도가 높지 않음을 의미하지만, 분급성 실트의 평균 입도(SSIRD_free) 증가는 저층 해류의 속도가 이들을 운반하기에는 충분하였음(>23 cm/s)을 시사한다(그림 3h; McCave and Hall, 2006). 한편, 270-286 cm 구간의 엽층리 실트에서는 세립질 실트가 우세하여 비교적 저에너지의 퇴적 환경이었을 것으로 추론된다(그림 3h). 두 구간의 엽층리 실트에서 빙운쇄설물이 거의 없는 것은 대륙붕에 접지한 빙상(grounded ice sheet)이 연구지역 부근까지 전진하여 빙상 붕괴가 감소했거나, 혹은 빙상이 멀리 후퇴하여 연구지역까지 도달한 빙운쇄설물이 감소한 것으로 해석할 수 있다(McKay et al., 2012; Albot, 2016).
코어 RS15-LC48에 대한 고지자기 연대가 ~430 cm 깊이에서 약 78만년 전임을 고려할 때, 연구 구간(최상부 350 cm)는 최대 70만년 전후로부터의 퇴적 환경을 반영할 것으로 추정할 수 있다. 선행 연구에서, 해당 시기 동안 로스해 중앙분지 대륙대에 생물교란구조의 빈도가 높은 다이아믹트와 엽층리 실트가 교호하는 유사한 퇴적상이 나타나며, 엽층리 실트에서 재동된 규조류의 높은 종다양성이 확인되었다(Bollen et al., 2022). Bollen et al. (2022)이 제시한 퇴적환경 모델에 따르면, 빙하기 동안에는 접지된 빙상이 최대로 전진했을 때 빙상 저면에서 유출되는 융빙수, 사면붕괴, 또는 융빙수에 의한 저밀도 저탁류 등에 의해 대륙사면으로 공급된 세립질 퇴적물이 대륙대 주변의 등수심류에 의해 엽층리를 형성하고, 빙상이 후퇴하면서 강화된 고밀도 대륙붕수 유출에 의해 조립질 입자가 주를 이루는 희미한 엽층리가 발달한 퇴적상이 형성되는 반면, 빙상이 완전히 후퇴한 간빙기 동안에는 엽층리가 나타나지 않고 풍부한 빙운쇄설물과 생교란작용의 증거가 특징적으로 나타난다. 본 연구 지역의 경우에도, 추후 상세한 연대모델이 보강되어야 하나, 퇴적상의 유사성을 고려할 때 해당 모델에 의해 해류 체계 및 퇴적작용이 조절되었을 가능성이 높다고 판단된다.
4.2. 퇴적환경 변화와 자기 이방성
연구 지역의 퇴적 모델에서 모래가 풍부한 조립질 퇴적층은 빈번한 고밀도 대륙붕수 유출에 의한 비교적 강한 에너지의 퇴적 환경에서 형성된 것으로 설명한다(Bollen et al., 2022). 본 연구시료의 경우, 해류 세기 지시자로 사용된 SSIRD_free는 퇴적상에 따라 뚜렷한 변화를 보이지는 않으나, 다음과 같은 근거로 다이아믹트에 비해 엽층리 실트가 저에너지의 퇴적 환경에서 형성되었을 것으로 추론한다: 1) 고에너지 환경을 지시하는 모래 함량이 엽층리 실트 구간에서 낮은 것(그림 3c); 2) SSIRD_free의 가장 낮은 값이 엽층리 실트 구간에서 나타나는 것(~75 cm, ~105 cm, ~275-280 cm; 그림 3h). 따라서 연구지역에 형성된 엽층리 실트는 지형류 또는 상대적으로 미약한 고밀도 대륙붕수 유출과 같은 저에너지의 저층 해류에 의한 퇴적작용을 반영하는 것으로 해석된다. 그러나 전반적으로 일정한 SSIRD_free 변화는 해류 체계 변화에 의한 해류 속도 차이(혹은 그에 의한 기록)가 연구지역에서 뚜렷하지 않았을 가능성을 시사한다. 또한 상부 약 80-100 cm 구간의 실트질 엽층에서 높은 SSIRD_free를 고려하면(그림 3h), 시기별로 빙하 환경 조건에 따라 등수심 퇴적체를 형성하는 퇴적물 가용성 및 해류 세기에 차이가 있었을 가능성 또한 존재한다.
일반적으로 해류 속도 증가에 의한 자성입자 배열 강화는 퇴적물 입도 증가를 수반하지만(Ledbetter and Ellwood, 1980), 본 연구시료의 자기 이방성 정도(P’) 변화는 퇴적상 및 입자크기와 연관성을 보이지 않는다(그림 3e, 3k). P’ 변동과 관련된 입자 배열은 이방성 타원체의 투영을 통해 보다 상세히 이해할 수 있다(그림 5). 높은 이방성 구간에서 관찰되는 K3 축의 군집과 K1 축의 +X 방향으로의 경사는 인편구조(imbrication)의 발달을 지시하며(그림 5d), 강화된 편원구조 및 드리프트 퇴적체의 특징과 잘 일치한다(Knight and Walker, 1988; Tauxe et al., 1998). 한편, 낮은 이방성 구간에서는 K3 축이 수직 축에서 크게 벗어나 있으며(그림 5e), 일반적으로 무작위한 K2와 K3축의 평면 분포를 특징으로 하는 원양성 퇴적환경의 자기조직과 일치하지 않는데 이는 1차 퇴적 구조의 교란을 나타낸다.
자기 이방성 결과는 시료 채취 과정의 오염에 민감하기 때문에 결과 해석 이전에 다음과 같은 요인이 고려되어야 한다. 첫째, 선상에서의 퇴적물 코어 채취/회수 과정은 코어 내 퇴적층에 변형을 야기하여 층리의 수직적인 혼합(mingling), 뒤틀림(distortion), 상향 아치구조(upward-arching beds) 등을 형성할 수 있다(Snowball et al., 2019; Yang et al., 2019). 둘째, 코어 절개 시 코어 라이너가 이완되거나 절개면 퇴적물을 긁어내는 과정으로 인해 K1 축이 코어 절개면과 평행하게 정렬될 수 있다(Copons et al., 1997; Aubourg and Oufi, 1999; Shimono et al., 2014; Snowball et al., 2019). 셋째, 코어 절개 및 큐브 시료 채취 과정에서 적용된 압축응력(좌표계에서 x축 방향)은 K1 혹은 K3 축 분포가 x축을 따라 확장되도록 할 수 있다(Gravenor et al., 1984; Copons et al., 1997; Xuan et al., 2012; Yang et al., 2019). 본 연구시료의 경우, X-선 사진과 이방성 타원체로부터 코어 퇴적물 및 절개면이 교란되지 않았음을 확인할 수 있다. 그러나 K1 축이 x축 방향을 가리키는 것을 고려할 때 큐브 시료 채취 과정에서 응력에 의한 일부 이방성 타원체의 오염을 완전히 배제할 수는 없다. 이러한 오염은 특히 빙운쇄설물이 다량 포함된 일부 시료에서 심각하게 작용할 가능성이 있다. 시료 채취에 의한 오염 외에도, 낮은 이방성 구간에서 K3와 K2 축이 거들(girdle)을 형성하는 것은 해당 방향(K2-K3)으로의 grain rolling 현상으로 해석될 수 있으며(Tarling and Hrouda, 1993; Tauxe et al., 1998), 이는 rolling에 요구되는 충분한 세기의 해류(e.g., 고밀도 대륙붕수 유출)가 존재했음을 시사한다. 따라서 낮은 이방성 구간은 낮은 해류 속도보다는 2차 자기조직에 의한 교란을 반영하는 것으로 해석된다.
일부 시료의 오염 가능성에도 불구하고, 편원구조의 자기 이방성 구간(높은 이방성 구간)은 엽층리 실트층과 얇은 역질/사질층이 산출하는 구간과 잘 일치한다(그림 3). 따라서 본 연구시료에서 관찰되는 자기 이방성 변화는 입자크기 변화와 관계없이 저층 해류에 의한 퇴적 기작의 변화, 즉 엽층리 형성 및 키질 작용과 관련된 자성입자 배열의 편원구조 강화를 반영하는 것으로 판단된다. 이러한 등수심 퇴적체의 형성은 기후 변화에 따른 로스해 해류 체계 변화를 반영하며, 한랭한 기간 동안 고밀도 대륙붕수가 약화되고 대륙대 하부에서 로스해 주변을 서쪽 방향으로 흐르는 지형류(로스환류/순환심층수)가 저층 해류로서 연구지역의 퇴적작용에 주요한 영향을 미친 것으로 해석된다(Lucchi et al., 2002; Lucchi and Rebesco, 2007; Kim et al., 2018; Bollen et al., 2022). 연구 시료는 약 70만년 동안 여러 번의 빙하기와 간빙기를 포함할 것으로 추정되지만, 퇴적상에서 각 빙하기-간빙기 주기를 뚜렷하게 식별하기 어렵다(그림 3a). 그럼에도 불구하고, 로스해 빙상이 기후 전이기에 따라 진화한 것을 고려할 때, 연구 시료의 하부(>~240 cm)에서 관찰되는 엽층리, 자갈층 및 자기 편원구조(그림 3a, 3h, 3k)는 MPT 이후 확장된 로스해 빙상(~800 ka; McKay et al., 2012)과 함께 연구지역에 발달한 지형류의 영향으로 추정된다. 이후 다이아믹트층의 발달(<~240 cm)은 MBT 이후 로스해 대륙붕에 접지된 빙상의 후퇴(~300-400 ka; McKay et al., 2012; Bollen et al., 2022)와 연관지을 수 있으며, 상부(>~150 cm)에서 나타나는 엽층리, 자갈층 및 자기 편원구조는 플라이스토세 후기 빙하기 동안 연구지역에 지형류가 영향을 미쳤음을 시사한다(그림 3a, 3h, 3k). 이러한 해석은 상세한 연대모델 정립과 다양한 퇴적 지시자를 활용한 추가 연구를 통해 검증되어야 한다.
결과적으로, 본 연구시료에서 자기 이방성 정도(P’)의 변동성은 2차 퇴적 자기조직 혹은 일부 잠재적인 시료채취 과정에서의 오염에 의해 해류 속도의 직접적인 지시자로 적용되기 어려운 것으로 판단된다. 그러나 퇴적상 및 퇴적 조직과 자기조직의 전반적인 연관성을 고려할 때, 이방성은 해류 변화에 따른 입자배열 및 퇴적 기작의 변화를 민감하게 반영하여 퇴적환경에 대한 정보를 빠르게 제공할 가능성이 있다. 따라서 이러한 가능성을 확인하기 위해서 향후 다양한 극지역 퇴적물에 대한 자기 이방성 분석을 시도할 필요성이 있으며, 다중 고환경 지시자 분석에 근거하여 보다 종합적인 해석이 요구된다.
5. 결 론
본 연구에서는 퇴적상, 입도분포 및 대자율 이방성 분석 결과를 종합하여 로스해 대륙대에서의 저층 해류 변동성을 조사하였으며, 다음과 같은 결론을 도출하였다.
1) 퇴적상은 풍부한 빙운쇄설물, 생물교란구조 및 모래 함량으로 특징지어지는 다이아믹트와 조립질 입자 및 생물교란구조가 매우 드문 엽층리 실트로 구분된다.
2) 엽층리 실트에 발달된 사엽층리와 파형의 경계부는 지속적인 저층 해류의 영향을 지시하며, 대륙사면으로 공급된 세립질 퇴적물과 로스해 주변을 흐르는 지속적인 지형류에 의해서 형성된 것으로 해석된다.
3) 다이아믹트는 고밀도 대륙붕수 유출과 관련된 높은 에너지의 해류 환경으로 해석되며, 분급성 실트의 함량과 입자크기는 엽층리 실트 내에서 낮은 값을 보여 다이아믹트에 비해 비교적 낮은 에너지의 해류(지형류)의 영향을 지시한다.
4) 자기 이방성 정도(P’)는 퇴적상 및 입자크기 변화와 뚜렷한 연관성이 없으며 낮은 이방성 구간은 2차 자기조직에 의한 교란을 반영하는 것으로 판단된다. 반면, 높은 이방성 구간은 강화된 자기 편원구조를 보이며 실트 엽층 및 자갈층 구간에서 저층 해류의 영향을 지시한다. 이러한 결과는 자기 이방성 조직이 로스해 해류 순환에 따른 퇴적 기작의 변화를 민감하게 반영할 가능성을 시사한다.
Acknowledgments
이 논문은 2023년도 정부(교육부)의 재원으로 한국연구재단의 G-램프(LAMP) 사업 지원을 받아 수행된 연구임(No. RS-2023-00301702). 이 연구는 해양수산부의 재원으로 극지연구소의 지원을 받아 수행되었습니다(과제번호: PE24090). 원고의 발전을 위해 세심한 검토를 해주시고 중요한 의견을 주신 편집위원과 심사위원 분들께 감사드립니다. The author J.Y.S. appreciates Prof. Liao Chang and Prof. Baochun Huang in Peking University, China, for helpful discussions on the magnetic data.
References
- Albot, O.B., 2016, Pleistocene cyclostratigraphy on the continental rise and abyssal plain of the western Ross Sea, Antarctica. MS thesis, Victoria University, Wellington, New Zealand, 171.
-
Anderson, J.B., Conway, H., Bart, P.J., Witus, A.E., Greenwood, S.L., McKay, R.M., Hall, B.L., Ackert, R.P., Licht, K., Jakobsson, M. and Stone, J.O., 2014, Ross Sea paleo-ice sheet drainage and deglacial history during and since the LGM. Quaternary Science Reviews, 100, 31-54.
[https://doi.org/10.1016/j.quascirev.2013.08.020]

-
Aubourg, C. and Oufi, O., 1999, 11. Coring-induced magnetic fabric in piston cores from the Western Mediterranean. Proceedings of the Ocean Drilling Program, 161, Scientific Results.
[https://doi.org/10.2973/odp.proc.sr.161.255.1999]

-
Bollen, M., Riesselman, C.R., Ohneiser, C., Albot, O., McKay, R., Lee, M.K., Yoo, K.-C., Kim, S., Lee, J.I. and Levy, R., 2022, Pleistocene oceanographic variability in the Ross Sea: A multiproxy approach to age model development and paleoenvironmental analyses. Global Planet Change, 216, 103901.
[https://doi.org/10.1016/j.gloplacha.2022.103901]

-
Busetti, M., Caburlotto, A., Armand, L., Damiani, D., Giorgetti, G., Lucchi, R.G., Quilty, P.G. and Villa, G., 2003, Plio-Quaternary sedimentation on the Wilkes land continental rise: preliminary results. Deep Sea Research Part II: Topical Studies in Oceanography, 50, 1529-1562.
[https://doi.org/10.1016/S0967-0645(03)00078-X]

-
Conte, R., Rebesco, M., Santis, L.D., Colleoni, F., Bensi, M., Bergamasco, A., Kovacevic, V., Gales, J., Zgur, F., Accettella, D., Steur, L.D., Ursella, L., McKay, R., Kim, S., Lucchi, R.G. and the IODP Expedition 374 Scientists, 2021, Bottom current control on sediment deposition between the Iselin Bank and the Hillary Canyon (Antarctica) since the late Miocene: An integrated seismic-oceanographic approach. Deep Sea Research Part I: Oceanographic Research Papers, 176, 103606.
[https://doi.org/10.1016/j.dsr.2021.103606]

-
Copons, R., Parés, J.M., Dinarès-Turell, J. and Bordonau, J., 1997, Sampling induced AMS in soft sediments: A case study in Holocene (glaciolacustrine rhythmites from Lake Barrancs (central Pyrenees, Spain). Physics and Chemistry of the Earth, 22, 137-141.
[https://doi.org/10.1016/S0079-1946(97)00091-8]

-
De Santis, L., Prato, S., Brancolini, G., Lovo, M. and Torelli, L., 1999, The Eastern Ross Sea continental shelf during the Cenozoic: implications for the West Antarctic ice sheet development. Global Planet Change, 23, 173-196.
[https://doi.org/10.1016/S0921-8181(99)00056-9]

- Doh, S.J., 1991, Anisotropy of Magnetic Susceptibility and Its Geological Applications. Economic and Environmental Geology, 24, 71-79 (in Korean with English abstract).
-
Dotto, T.S., Naveira Garabato, A., Bacon, S., Tsamados, M., Holland, P.R., Hooley, J., Frajka-Williams, E., Ridout, A. and Meredith, M.P., 2018, Variability of the Ross Gyre, Southern Ocean: Drivers and responses revealed by satellite altimetry. Geophysical Research Letters, 45, 6195-6204.
[https://doi.org/10.1029/2018GL078607]

-
Drewry, D.J. and Cooper, A.P.R., 1981, Processes and models of Antarctic glaciomarine sedimentation. Annals of Glaciology, 2, 117-122.
[https://doi.org/10.3189/172756481794352478]

-
Ellwood, B.B. and Ledbetter, M.T., 1979, Paleocurrent indicators in deep-sea sediment. Science, 203, 1335-1337.
[https://doi.org/10.1126/science.203.4387.1335]

-
Flinn, D., 1962, On folding during three-dimensional progressive deformation. Quarterly Journal of the Geological Society, 118, 385-428.
[https://doi.org/10.1144/gsjgs.118.1.0385]

-
Folk, R.L. and Ward, W.C., 1957, A study in the significance of grain size parameters. Journal Sedimentary Petrology, 27, 3-27.
[https://doi.org/10.1306/74D70646-2B21-11D7-8648000102C1865D]

-
Golledge, N.R., Fogwill, C.J., Mackintosh, A.N. and Buckley, K.M., 2012, Dynamics of the last glacial maximum Antarctic ice-sheet and its response to ocean forcing. Proceedings of the National Academy of Sciences, 109, 16052-16056.
[https://doi.org/10.1073/pnas.1205385109]

-
Gordon, A.L., Orsi, A.H., Muench, R., Huber, B.A., Zambianchi, E. and Visbeck, M., 2009, Western Ross Sea continental slope gravity currents. Deep Sea Research Part II: Topical Studies in Oceanography, 56, 796-817.
[https://doi.org/10.1016/j.dsr2.2008.10.037]

-
Gravenor, C.P., Symons, D.T.A. and Coyle, D.A., 1984, Errors in the anisotropy of magnetic susceptibility and magnetic remanence of unconsolidated sediments produced by sampling methods. Geophysical Research Letters, 11, 836-839.
[https://doi.org/10.1029/GL011i009p00836]

-
Howe, J.A., Stoker, M.S. and Woolfe, K.J., 2001, Deep-marine seabed erosion and gravel lags in the northwestern Rockall Trough, North Atlantic Ocean. Journal of the Geological Society, 158, 427-438.
[https://doi.org/10.1144/jgs.158.3.427]

-
Hrouda, F., 1982, Magnetic anisotropy of rocks and its application in geology and geophysics. Geophysical Surveys, 5, 37-82.
[https://doi.org/10.1007/BF01450244]

-
Hughes, T., 1973, Is the West Antarctic ice sheet dis-integrating?. Journal of Geophysical Research, 78, 7884-7910.
[https://doi.org/10.1029/JC078i033p07884]

-
Jacobs, S.S., 2004, Bottom water production and its links with the thermohaline circulation. Antarctic Science, 16, 427-437.
[https://doi.org/10.1017/S095410200400224X]

-
Jacobs, S.S., Giulivi, C.F. and Mele, P.A., 2002, Freshening of the Ross Sea during the late 20th century. Science, 297, 386-389.
[https://doi.org/10.1126/science.1069574]

-
Jelínek, V., 1981, Characterization of the magnetic fabric of rocks. Tectonophysics, 79, T63-T67.
[https://doi.org/10.1016/0040-1951(81)90110-4]

-
Joseph, L.H., Rea, D.K. and Van der Pluijm, B.A., 1998, Use of grain size and magnetic fabric analyses to distinguish among depositional environments. Paleoceanography, 13, 491-501.
[https://doi.org/10.1029/98PA01939]

-
Joseph, L.H., Rea, D.K., Van der Pluijm, B.A. and Gleason, J.D., 2002, Antarctic environmental variability since the late Miocene: ODP Site 745, the East Kerguelen sediment drift. Earth and Planetary Science Letters, 201, 127-142.
[https://doi.org/10.1016/S0012-821X(02)00661-1]

-
Joughin, I. and Alley, R.B., 2011, Stability of the West Antarctic ice sheet in a warming world. Nature Geoscience, 4, 506-513.
[https://doi.org/10.1038/ngeo1194]

-
Jung, J., Park, Y., Lee, K., Hong, J., Lee, J., Yoo, K., Lee, M. and Kim, J., 2019, Clay Mineralogical Characteristics and Origin of Sediments Deposited during the Pleistocene in the Ross Sea, Antarctica. Journal of Mineralogical Society of Korea, 32, 163-172 (in Korean with English abstract).
[https://doi.org/10.9727/jmsk.2019.32.3.163]

-
Kim, S., De Santis, L., Hong, J.K., Cottlerle, D., Petronio, L., Colizza, E., Kim, Y.-G., Kang, S.-G., Kim, H.J., Kim, S., Wardell, N., Geletti, R., Bergamasco, A., McKay, R., Jin, Y.K. and Kang, S.-H., 2018, Seismic stratigraphy of the Central Basin in northwestern Ross Sea slope and rise, Antarctica: Clues to the late Cenozoic ice-sheet dynamics and bottom-current activity. Marine Geology, 395, 363-379.
[https://doi.org/10.1016/j.margeo.2017.10.013]

-
Knight, M.D. and Walker, G.P.L., 1988, Magma flow directions in dikes of the Koolau Complex, Oahu, determined from magnetic fabric studies. Journal of Geophysical Research: Solid Earth, 93, 4301-4319.
[https://doi.org/10.1029/JB093iB05p04301]

-
Ledbetter, M.T. and Ellwood, B.B., 1980, Spatial and temporal changes in bottom-water velocity and direction from analysis of particle size and alignment in deep-sea sediment. Marine Geology, 38, 245-261.
[https://doi.org/10.1016/0025-3227(80)90062-6]

-
Lucchi, R.G. and Rebesco, M., 2007, Glacial contourites on the Antarctic Peninsula margin: insight for palaeoenvironmental and palaeoclimatic conditions. Geological Society, London, Special Publications, 276, 111-127.
[https://doi.org/10.1144/GSL.SP.2007.276.01.06]

-
Lucchi, R.G., Rebesco, M., Camerlenghi, A., Busetti, M., Tomadin, L., Villa, G., Persico, D., Morigi, C., Bonci, M.C. and Giorgetti, G., 2002, Mid-late Pleistocene glacimarine sedimentary processes of a high-latitude, deep-sea sediment drift (Antarctic Peninsula Pacific margin). Marine Geology, 189, 343-370.
[https://doi.org/10.1016/S0025-3227(02)00470-X]

-
McCave, I.N. and Andrews, J.T., 2019, Distinguishing current effects in sediments delivered to the ocean by ice. I. Principles, methods and examples. Quaternary Science Reviews, 212, 92-107.
[https://doi.org/10.1016/j.quascirev.2019.03.031]

-
McCave, I.N. and Hall, I.R., 2006, Size sorting in marine muds: Processes, pitfalls, and prospects for paleoflow‐speed proxies. Geochemistry, Geophysics, Geosystems, 7, Q10N05.
[https://doi.org/10.1029/2006GC001284]

-
McCave, I.N., Manighetti, B. and Robinson, S.G., 1995, Sortable silt and fine sediment size/composition slicing: parameters for palaeocurrent speed and palaeoceanography. Paleoceanography and Paleoclimatology, 10, 593-610.
[https://doi.org/10.1029/94PA03039]

- McKay, R.M., De Santis, L. and Kulhanek, D.K., 2017, Expedition 374 scientific prospectus: Ross Sea West Antarctic Ice Sheet history. International Ocean Discovery Program, 374.
-
McKay, R.M., De Santis, L. and Kulhanek, D.K., 2019, Ross Sea West Antarctic Ice Sheet History. Proceedings of the International Ocean Discovery Program, 374.
[https://doi.org/10.14379/iodp.proc.374.2019]

-
McKay, R., Naish, T., Powell, R., Barrett, P., Scherer, R., Talarico, F., Kyle, P., Monien, D., Kuhn, G., Jackolski, C. and Williams, T., 2012, Pleistocene variability of Antarctic Ice Sheet extent in the Ross Embayment. Quaternary Science Reviews, 34, 93-112.
[https://doi.org/10.1016/j.quascirev.2011.12.012]

-
McKay, R., Albot, O., Dunbar, G.B., Lee, J.I., Lee, M.K., Yoo, K., Kim, S., Turton, N., Kulhanek, D., Patterson, M. and Levy, R., 2022, A comparison of methods for identifying and quantifying ice rafted debris on the Antarctic margin. Paleoceanography and Paleoclimatology, 37, e2021PA004404.
[https://doi.org/10.1029/2021PA004404]

-
Morrison, A.K., Hogg, A.McC., England, M.H. and Spence, P., 2020, Warm Circumpolar Deep Water transport toward Antarctica driven by local dense water export in canyons. Science advances, 6, eaav2516.
[https://doi.org/10.1126/sciadv.aav2516]

-
Ohneiser, C. and Wilson, G.S., 2018, Eccentricity-paced Southern Hemisphere glacial-interglacial cyclicity preceding the middle Miocene climatic transition. Paleoceanography and Paleoclimatology, 33, 795-806.
[https://doi.org/10.1029/2017PA003278]

-
Ohneiser, C., Yoo, K.-C., Albot, O.B., Cortese, G., Riesselman, C., Lee, J.I., McKay, R., Bollen, M., Lee, M.K., Moon, H.S., Kim, S., Beltran, C., Levy, R. and Wilson, G.S., 2019, Magneto-biostratigraphic age models for Pleistocene sedimentary records from the Ross Sea. Global Planet Change, 176, 36-49.
[https://doi.org/10.1016/j.gloplacha.2019.02.013]

-
Orsi, A.H., Johnson, G.C. and Bullister, J.L., 1999, Circulation, mixing, and production of Antarctic Bottom Water. Progress in Oceanography, 43, 55-109.
[https://doi.org/10.1016/S0079-6611(99)00004-X]

-
Orsi, A.H., Smethie, W.M. and Bullister, J.L., 2002, On the total input of Antarctic waters to the deep ocean: A preliminary estimate from chlorofluorocarbon measurements. Journal of Geophysical Research: Oceans, 107, 31-1.
[https://doi.org/10.1029/2001JC000976]

-
Orsi, A.H. and Wiederwohl, C.L., 2009, A recount of Ross Sea waters. Deep Sea Research Part II: Topical Studies in Oceanography, 56, 778-795.
[https://doi.org/10.1016/j.dsr2.2008.10.033]

-
Parés, J.M., Hassold, N.J.C., Rea, D.K. and van der Pluijm, B.A., 2007, Paleocurrent directions from paleomagnetic reorientation of magnetic fabrics in deep-sea sediments at the Antarctic Peninsula Pacific margin (ODP Sites 1095, 1101). Marine Geology, 242, 261-269.
[https://doi.org/10.1016/j.margeo.2007.04.002]

-
Paterson, G.A. and Heslop, D., 2015, New methods for unmixing sediment grain size data. Geochemistry, Geophysics, Geosystems, 16, 4494-4506.
[https://doi.org/10.1002/2015GC006070]

-
Pudsey, C.J., 2000, Sedimentation on the continental rise west of the Antarctic Peninsula over the last three glacial cycles. Marine Geology, 167, 313-338.
[https://doi.org/10.1016/S0025-3227(00)00039-6]

-
Rebesco, M., Hernández-Molina, F.J., Rooij, D.V. and Wåhlin, A., 2014, Contourites and associated sediments controlled by deep-water circulation processes: State-of-the-art and future considerations. Marine Geology, 352, 111-154.
[https://doi.org/10.1016/j.margeo.2014.03.011]

-
Richter, C., Acton, G., Endris, C. and Radsted, M., 2007, Handbook for shipboard paleomagnetists. Ocean Drilling Program Technical Notes.
[https://doi.org/10.2973/odp.tn.34.2007]

-
Rochette, P., Jackson, M. and Aubourg, C., 1992, Rock magnetism and the interpretation of anisotropy of magnetic susceptibility. Reviews of Geophysics, 30, 209-226.
[https://doi.org/10.1029/92RG00733]

-
Schmidtko, S., Heywood, K.J., Thompson, A.F. and Aoki, S., 2014, Multidecadal warming of Antarctic waters. Science, 346, 1227-1231.
[https://doi.org/10.1126/science.1256117]

-
Shimono, T., Yamazaki, T. and Inoue, S., 2014, Influence of sampling on magnetic susceptibility anisotropy of soft sediments: comparison between gravity and piston cores. Earth, Planets and Space, 66, 1-8.
[https://doi.org/10.1186/1880-5981-66-3]

-
Snowball, I., Almqvist, B., Lougheed, B.C., Wiers, S., Obrochta, S. and Herrero-Bervera, E., 2019, Coring induced sediment fabrics at IODP Expedition 347 Sites M0061 and M0062 identified by anisotropy of magnetic susceptibility (AMS): criteria for accepting palaeomagnetic data. Geophysical Journal International, 217, 1089-1107.
[https://doi.org/10.1093/gji/ggz075]

- Son, M., Kim, I.S., Lee, D., Lee, J.-D., Kim, J.S. and Paik, I.S., 2000, Geological characteristics in the eastern part of the Ulsan Fault area, Korea: Structural geology and anisotropy of magnetic susceptibility (AMS) in the Tertiary Miocene Waup Basin. Journal of the Geological Society of Korea, 36, 195-216 (in Korean with English abstract).
-
Stevenard, N., Govin, A., Kissel, C. and Van Toer, A., 2023, Correction of the IRD influence for paleo-current flow speed reconstructions in hemipelagic sediments. Paleoceanography and Paleoclimatology, 38, e2022PA004500.
[https://doi.org/10.1029/2022PA004500]

-
Stow, D.A.V. and Piper, D.J.W., 1984, Deep-water fine-grained sediments: facies models. Geological Society, London, Special Publications, 15, 611-646.
[https://doi.org/10.1144/GSL.SP.1984.015.01.38]

- Tarling, D.H. and Hrouda, F. (Eds.), 1993, The magnetic anisotropy of rocks. United Kingdom: Chapman and Hall.
-
Tauxe, L., Gee, J.S. and Staudigel, H., 1998, Flow directions in dikes from anisotropy of magnetic susceptibility data: The bootstrap way. Journal of Geophysical Research: Solid Earth, 103, 17775-17790.
[https://doi.org/10.1029/98JB01077]

-
Whitworth III, T., Orsi, A.H., Kim, S.J., Nowlin Jr, W.D. and Locarnini, R.A., 1985, Water masses and mixing near the Antarctic Slope Front. Ocean, ice, and atmosphere: interactions at the Antarctic continental margin, 75, 1-27.
[https://doi.org/10.1029/AR075p0001]

-
Xuan, C., Channell, J.E.T., Polyak, L. and Darby, D.A, 2012, Paleomagnetism of Quaternary sediments from Lomonosov Ridge and Yermak Plateau: implications for age models in the Arctic Ocean. Quaternary Science Reviews, 32, 48-63.
[https://doi.org/10.1016/j.quascirev.2011.11.015]

-
Yang, T., Zhao, X., Petronotis, K., Dekkers, M.J. and Xu, H., 2019, Anisotropy of magnetic susceptibility (AMS) of sediments from Holes U1480E and U1480H, IODP Expedition 362: sedimentary or artificial origin and implications for paleomagnetic studies. Geochemistry, Geophysics, Geosystems, 20, 5192-5215.
[https://doi.org/10.1029/2019GC008721]

Appendix
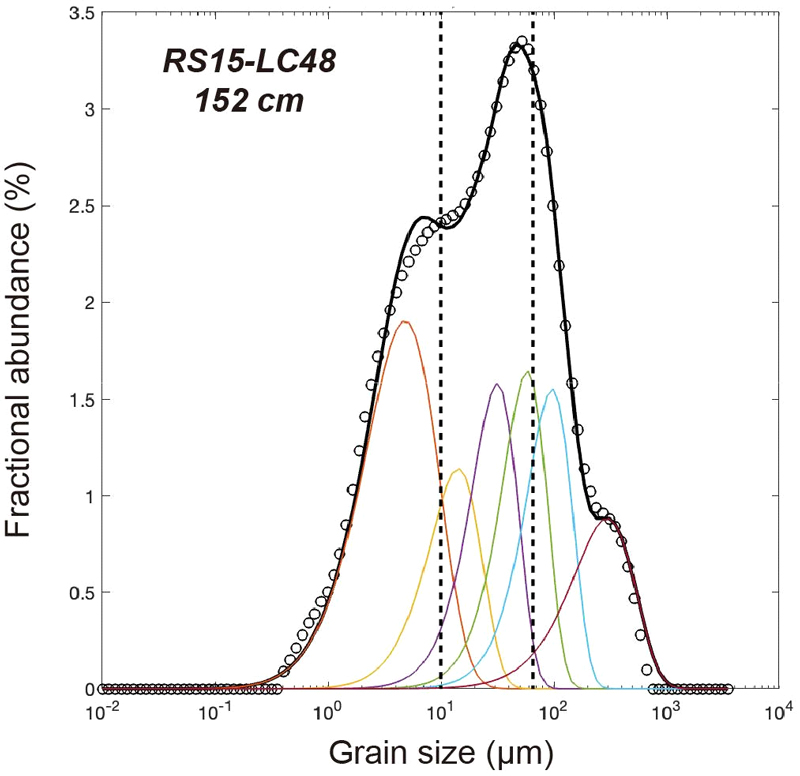
Representative grain size distribution and its unmixing result for IRD-corrected sortable silt calculation. Six End-Members (EMs) are defined in the order of increasing grain size (EM 1-6). EM 1-3 were used as the current-sorted EM group in this study (e.g., Stevenard et al., 2023). Vertical dashed lines indicate the sortable silt range (10-63 μm).

