포항분지 내 저탁류성 이암과 반원양성 이암의 차이점: PSG-3 시추공의 퇴적상, 대자율이방성, 총유기탄소 함량 분석 결과

Copyright ⓒ The Geological Society of Korea 2024
초록
포항분지의 야외 노두에서 저탁류성 이암과 반원양성 이암은 풍화로 인해 구분이 어렵다. 하지만 시추된지 수 개월 이내의 신선한 코어에서는 육안으로 구분이 가능하다. 본 연구는 포항분지의 PSG-3공 내 저탁류성 이암과 반원양성 이암이 연속적으로 나타나는 구간(84.370-82.980 m)을 대상으로 퇴적상, 자기미세조직 및 총유기탄소 함량 분석을 통해 이들의 특성을 구분하고자 하였다. 저탁류성 이암은 암회색의 얇은 실트 층리 이암(퇴적상 1), 실트 줄무늬 이암(퇴적상 2), 파동형 실트 엽층리 이암(퇴적상 3), 괴상 이암(퇴적상 4)으로 구성된다. 괴상 이암은 암회색 괴상 이암(부퇴적상 4.1), 갈회색 괴상 이암(부퇴적상 4.2), 탄산염질 이암(부퇴적상 4.3)으로 세분된다. 저탁류성 이암(퇴적상 1-3, 부퇴적상 4.1)의 대자율이방성 분석 결과, 유체의 흐름에 평행한 조직, 사교하는 조직 및 직교하는 조직이 확인되며, 이는 세립질 입자가 퇴적면에서 미끌림 작용과 구름 작용으로 이동했음을 시사한다. 저탁류성 이암의 이방성정도(Pj)와 비늘구조 각(imbrication angle, β)은 퇴적상 변화에 따라 감소하는 경향을 보이며, 이는 저탁류 유속의 감소를 반영한다. 반면, 반원양성 이암은 실트와 생물기원 물질이 포함된 갈회색의 괴상 이암(부퇴적상 4.2)과 탄산염질 이암(부퇴적상 4.3)으로 구성되며, 대자율이방성 분석 결과 무작위적 배열과 흐름에 평행한 조직을 보인다. 이들은 수직적 침전에 의해서 퇴적된 것으로 보이나 일부 구간에서는 수직 침전 중에도 퇴적면에서 약한 흐름에 영향을 받은 것으로 해석된다. 저탁류성 이암과 반원양성 이암의 총유기탄소 함량 분포 범위는 큰 차이를 보이지 않는다. 저탁류성 이암은 토탄파편 엽리가 발달해 있는 구간을 제외하고 상부로 갈수록 총유기탄소 함량이 감소하는 경향을 보이며, 반원양성 이암은 상부로 갈수록 증가하는 경향을 보인다. 이는 대규모 저탁류 이동 후 사면환경이 안정되어 쇄설성 퇴적물의 공급량이 감소한 것으로 해석된다. 반면, 반원양성 이암 내 일부 실트 입도의 엽층이 협재하는 구간에서는 총유기탄소 함량이 낮다. 이는 저농도 저탁류의 유입으로 해석된다.
Abstract
Differentiation of turbiditic and hemipelagic mudstones is usually very difficult in outcrops in the Pohang. However, it is possible to discriminate the two types of mudstones from fresh cores drilled within a few months. This study attempted to discriminate the characteristics of turbiditic and hemipelagic mudstones through sedimentary facies, anisotropy of magnetic susceptibility (AMS) and total organic carbon (TOC) content analysis in PSG-3 well (84.370-82.980 m interval). Turbiditic mudstones can be divided into thin-bedded silt laminated mudstone (Facies 1), silt-streaked mudstone (Facies 2), wavy silt laminated mudstone (Facies 3), and homogeneous mudstone (Facies 4). Facies 4 is further subdivided into gray homogeneous mudstone (Subfacies 4.1), brownish gray homogeneous mudstone (Subfacies 4.2), and calcareous mudstones (Subunit 4.3). In the turbiditic mudstones (Facies 1-3, and Subfacies 4.1), magnetic fabrics reveal parallel, oblique, and transverse fabrics, suggesting that the fine-grained sediments moved on the depositional surface as sliding and rolling. Additionally, the degree of anisotropy (Pj) and angle of imbrication (β) gradually decrease within turbiditic mudstone, suggesting a decrease in flow velocity of the turbidity current. Hemipelagic mudstones show randomly oriented fabric with a few flow aligned fabrics. These characteristics indicate deposition under suspension fallout with some influence of weak flows on the depositional surface. The TOC contents tend to decrease toward the upper part of the turbiditic mudstones, except for intervals with abundant lignite fragments. On the other hand, TOC contents increase in the hemipelagic mudstones, suggesting a decrease in detrital sediments supply due to stabilization of the slope after the large-scale turbiditic event. In some parts of hemipelagic mudstones, thinly interbedded silt layers show low TOC content suggesting the influx of low-density turbidity currents.
Keywords:
Pohang Basin, turbiditic mudstone, hemipelagic mudstone, magnetic fabric, total organic carbon content키워드:
포항분지, 저탁류성 이암, 반원양성 이암, 자기미세구조, 총유기탄소 함량1. 서 론
심해에서는 다양한 과정에 의해 퇴적물이 침식, 운반 및 퇴적된다. 심해 퇴적은 (반)원양성 퇴적((hemi) pelagic deposition)이 주된 퇴적 기작으로, 수중에 부유된 세립질 퇴적물이 수직적 침전으로 연속적으로 퇴적되며 주로 점토와 실트 입자로 구성되고 생물기원의 흔적을 포함한 이암으로 이루어진다(Pickering et al., 1986; Stow and Smillie, 2020). 또한 간헐적으로 중력에 의해 유발된 중력류(sediment gravity flow)에 의해 퇴적물이 재동되어 해저에서 바닥면을 따라 이동, 퇴적되어 저탁류 퇴적층(turbidite)이 형성되기도 한다. 저탁류 퇴적층은 Bouma (1962)에 의해 입도 및 퇴적구조에 따라 5개의 구간으로 구분되었으며, 상부로 갈수록 입도가 작아지는 경향을 보인다. 저탁류 퇴적층 상부의 특징적인 구조를 보이지 않는 이암은 Te로 명명되었으며, 이는 저탁류의 꼬리 부분에서 저에너지 시기 동안 부유물이 침전된 것으로 해석된다. Stow and Shanmugam (1980)은 시추 코어분석을 통해 Bouma (1962)의 Tc-Te 구간을 입도 및 퇴적구조에 따라 T0-T8로 세분하였다. Stow and Shanmugam (1980)은 세립질 저탁류(fine-grained turbidity current) 내에서 상대적으로 높은 유속과 운반능력으로 인해 극세립사 내지 실트로 구성된 엽층리 및 연흔 형태의 사엽리(T0-T3)가 형성되고, 이후 유속과 운반능력의 감소로 인해 얇은 두께의 실트 엽층과 괴상 이암(T4-T8)이 퇴적된다고 보고하였다. 또한 최근 수중의 퇴적물 농도와 그에 따른 난류 강도를 변수로 두어 수조 실험을 수행한 결과, 저탁류 퇴적층의 이암 구간은 단순한 부유물의 침전으로 인해 퇴적된 것뿐만 아니라 세립질 저탁류의 견인력으로 엽층리 및 정점이층리가 형성될 수 있으며, 퇴적물 농도가 증가함에 따라 난류가 제한되고 부유 퇴적물 간 응집(flocculation)이 발생하여 괴상 이암이 퇴적된다고 하였다(Baas et al., 2011).
퇴적암의 조직은 암석을 구성하는 입도, 입자의 형태 그리고 퇴적당시 유체의 속도에 의해 영향을 받는다(Reineck and Singh, 2012). 퇴적암의 조직은 대자율이방성(anisotropy of magnetic susceptibility, AMS) 분석을 통해 파악이 가능하며, 이를 통해 산출해낸 모수들을 통해 퇴적암의 퇴적기작에 대한 해석이 보고되었다(Taira, 1989; Baas et al., 2007). 그러나 기존연구에서는 사질 퇴적암에 대한 해석이 주로 수행되어 세립질 퇴적물의 퇴적작용에 대한 연구는 미미한 실정이다. 본 연구에서는 시추코어를 활용하여 세립질 저탁류의 퇴적상 구분과 함께 자기미세조직(magnetic fabric)을 분석하여 세립질 부유퇴적물의 침전작용과 끌림작용을 파악하였다. 또한 분석 구간에서 퇴적상에 따른 자기미세조직(magnetic fabric)을 활용하여 저탁류성 이암과 반원양성 이암의 퇴적기작에 대한 차이를 파악하고자 하였다.
(반)원양성 이암은 유기탄소의 근원암(source rock)의 역할을 하기 때문에 유기지화학 분석을 활용한 연구가 지속되어왔다(Watanabe and Akiyama, 1998; Ochoa et al., 2013; Kurosawa et al., 2023). Watanabe and Akiyama (1998)은 포항 분지 환경과 유사한 일본의 니가타 분지 Teradomari 층에서 암상을 통해 저탁류성 사암/이암과 반원양성 이암을 구분하고, 유기지화학분석을 활용하여 암상에 따라 총유기탄소 함량의 차이를 확인하였다. 포항 분지의 경우, 분지저 환경에서는 반원양성 이암과 저탁류성 이암이 교호하고 있으나 야외노두에서는 풍화로 인해 구분이 어렵다. 하지만 시추 후 수개월 이내의 코어 시료에서는 퇴적구조, 암색 등에 의해 구분이 가능하다. 따라서 본 연구에서는 암상에 따른 총유기탄소 함량의 차이가 포항 분지에서도 유효하게 적용되는지 여부와 함께 퇴적상 및 퇴적작용에 따른 총유기탄소 함량의 수직적 변이를 파악하고자 하였다. 또한 저탁류 기원의 이암(turbiditic mudstone)과 반원양성 이암(hemipelagic mudstone)의 자기미세조직(magnetic fabric) 및 총유기탄소(total organic carbon, TOC) 함량의 연관성을 파악함으로써 퇴적작용과 퇴적환경 변화 간의 복잡한 상호작용에 대해 고찰하고자 한다.
2. 포항분지 층서 및 퇴적환경: 기존연구
포항분지는 동해의 확장과 관련하여 형성된 한반도 남동부에 위치한 제3기 퇴적분지이다(그림 1). 이 분지는 북동-남서 방향을 가지는 양산단층의 우수향 주향이동에 의해 형성된 당겨열림형 분지(pull-apart basin)로 해석되어 왔으나(Han et al., 1986; Kim, 1992), 역암의 근원지 분석에 따르면 포항분지가 형성될 당시 양산단층의 주향이동은 제한적인 것이 확인된 바 있다(Hwang, 1993; Hong et al., 1998). 포항분지의 서측경계는 양산단층보다 동쪽에 위치하는 북북동-남남서 방향의 정단층과 북서-남동 방향의 이음단층(transfer fault)이며, 후포단층 또는 울릉단층이 우수향 주향이동을 하며 분지의 서측에 영향을 주어 포항분지가 형성된 것으로 해석되고 있다(Yoon and Chough, 1995; Sohn and Son, 2004; Son et al., 2007). 포항분지 내 북서-남동 방향의 이음단층을 따라 발달한 수계에 의해 분지 서측에서 동측으로 전진구축하는 6개의 선상지 삼각주가 형성되었으며(그림 1a), 일부 육성 선상지 환경을 제외한 대부분의 지역에서는 해성환경에서 퇴적된 역암, 사암 및 이암으로 구성되어 있다(그림 1b) (Hwang et al., 1995, 2021; Son et al., 2024).

Stratigraphic map of the Pohang Basin and locations of well sites (Modified after Hwang, 1993; Hwang et al., 1995, 2021). The location of PSG-3 well (the subject of this study) is represented by a red square. Stage P1 to Stage P4 deposits are related to the evolution of the Pohang Basin (modified from Hwang et al., 2021; see text). Depositional history of individual fan deltas is also designated (Duksung fan delta stages: DS-1, DS-2, DS-3, DS-4; Maesan fan delta stages: MS-1, MS-2; Doumsan fan delta stages: D-1, D-2, D-3, D-4; Malgol fan delta stages: M-1, M-2, M-3). (b) Cross-section of Pohang Basin (A-A’), based on correlation of previously investigated deep cores and outcrops (modified from Hwang et al., 2021; Son et al., 2024).
포항분지 연일층군의 통일된 층서는 확립되지 않았으나, Hwang (1993) 및 Hwang et al. (1995)은 육상노두에서 급격한 퇴적상 변화를 대비하여 포항분지 기원층서(genetic stratigraphy)를 연구하였고, Hwang et al. (2021)은 포항분지 내에서 시추된 21개 시추공과 육상노두를 대비하여 포항분지 사건층서(event stratigraphy)를 정립하여 포항분지 연일층군을 4개의 퇴적단위로 구분하였다(그림 1). 분지형성 초기(Stage P1, 포항퇴적단위 P1)에 포항분지 내 가장 규모가 큰 도음산 선상지 삼각주는 분지 서측에서 조립질 퇴적물이 공급되어 천해환경으로 전진구축하였으며, 분지가 침강하면서 길버트형 선상지 삼각주로 진화하였다. 고생물자료와 대비를 통해 퇴적시기를 17.5-16.5 Ma로 특정하였다(Kim, 1999; Hwang et al., 2021). 이후 두번째 시기(Stage P2, 포항퇴적단위 P2)에는 분지 내부의 단층운동과 동반된 급격한 침강으로 선상지 삼각주에는 대규모 절단면이 형성되었고, 단층면의 불안정한 퇴적물이 재동된 후 그 상부에 급경사를 이루는 전면층이 전진구축하였다(16.5-16.0 Ma) (Hwang et al., 2021). 세번째 시기(Stage P3, 포항퇴적단위 P3)에는 분지 서측에서 공급되는 조립질 퇴적물의 공급량이 줄어들며 역암으로 구성된 전면층 상부에 세립질 퇴적물이 퇴적되었다. 급사면에서 세립질 퇴적물이 재동되면서 대규모 사태가 빈번하게 발생하였고 사면하부 및 분지저 환경에는 반원양성 이암과 하도/로브형 및 판상의 조립질 퇴적물이 퇴적되었다(Choe and Chough, 1988; Hwang et al., 1995; Kim and Chough, 2000). 퇴적시기는 16.0-13.0 Ma 이후로 특정하였다(Kim, 1999; Hwang et al., 2021). 분지형성 마지막 시기(Stage P4, 포항퇴적단위 P4)에는 쇄설성 퇴적물 공급의 급격한 감소로 인해 분지 전체에 걸쳐 규조질 반원양성 이암이 퇴적된 것으로 해석하였다(13.0 Ma 이후).
3. 시추공 및 연구시료
본 연구에서는 포항분지 시추공 중, 기원지에서 가장 먼 곳에 위치하여 반원양성 이암과 저탁류 퇴적층 구분이 용이할 것으로 판단되는 PSG-3 시추공을 선택하였다(그림 1a). 이 시추공은 포항시 남구 상도동 117-9(36.0041667°N, 129.3545833°E)에 위치하며, 취득된 역암, 사암 및 이암 시료(46.0-289.7 m)는 포항퇴적단위 P3에 해당된다(그림 2a). 이 시추공에서 포항퇴적단위 P4에 해당되는 구간은 침식되고 현생 퇴적물로 채워져 확인되지 않는다.

(a) Columnar log of PSG-3 well, which all is correlated to the Stage P3 succession of the Pohang Basin, following the event stratigraphy of Hwang et al. (2021). The Stage P3 succession was subdivided into subunits P3.1, P3.m1, P3.2, P3.ash, and P3.3 (Hwang et al., 2021), deposited by hemipelagic settling and sediment gravity flows at the basin plain environment. The Subunit P3.1 consists of hemipelagic mudstone with thin layers of turbiditic sandstone/mudstone. The Subunit P3.2 has thicker turbiditic sandstone/mudstone than that of the Subunit P3.1, indicating high frequency of sediment gravity flows. The boundary between subunits P3.1 and P3.2 is represented by a thick megaturbidite (Subunit P3.m1) which can be found in most wells of the Pohang Basin. The boundary between subunits P3.2 and P3.3 is indicated by dacitic ash layers (Subunit P3.ash). The Subunit P3.3 consists of hemipelagic mudstones with thin layers of turbidite sandstone/mudstone. (b) Detailed columnar log of the 84.640-82.980 m section of PSG-3 well. Positions of the samples for analysis of anisotropy of magnetic susceptibility were designated.
PSG-03공 최하부(289.7-274.7 m)는 주로 갈회색(brownish gray; 5YR4/1 to 5YR 6/1)의 이암으로 구성되며, 탄산염 교결이 흔하고 생교란 흔적화석이 나타나는 반원양성 이암으로 구성되어있다(그림 2a). 두꺼운 이암 내에 수 cm 내지 수십 cm 두께의 괴상 혹은 점이층리를 보이는 사암 및 이암이 협재하며 이는 저탁류 퇴적층으로 해석된다. 이 구간은 Hwang et al. (2021)의 포항소퇴적단위 P3.1 상부에 해당되며, 유공충 등 고생물학 연구로 보아 16-15 Ma로 추정된다(Kim, 1999). 직상부에 분포하는 12.5 m 내외의 포항거대저탁류는 포항소퇴적단위 P3.m1으로 명명되었으며(Hwang et al., 2021), 이 중 사암은 274.7-266.2 m로 약 8.5 m의 두께를 갖는다(그림 2a). 사암 및 실트암 상부의 괴상 이암은 회색 내지는 암회색(medium gray to medium dark gray; N5-N4)을 띠며, 저밀도 저탁류에 의해 퇴적된 것으로 해석된 바 있다. 거대저탁류 퇴적층(P3.m1) 상부의 포항소퇴적단위 P3.2 (261.3-136.3 m)에는 갈회색의 반원양성 이암이 주로 퇴적되었고 교호하는 사암 및 암회색의 이암은 점이층리를 보이며 이는 저탁류 퇴적층으로 해석된다(Hwang et al., 2021). 일부 구간에서는 혼합류(hybrid flow)에 의해 퇴적된 이질 퇴적물 및 뜯어올림 이암편을 다량으로 함유한 사질이암 및 이질사암이 분포한다(그림 2a) (Haughton et al., 2009; Baas et al., 2011; Emmings et al., 2020; Hwang et al., 2021). 포항소퇴적단위 P3.ash로 명명된 136.3-134.0 m 구간은 유백색을 띠는 데사이트질 화산재가 확인되며, 같은 층으로 대비되는 시추공(PD-1, PD-2, TB-2; 그림 1a)의 시료에서 저어콘 SHRIPM 연대측정 결과 백악기로부터 마이오세까지의 연대가 확인되며, 가장 젊은 연대 피크는 중기 마이오세(14.4 Ma)를 지시한다(Hwang et al., 2021). 포항소퇴적단위 P3.3구간은 P3.2와 유사하지만 두꺼운 이암층이 관찰되며, 상대적으로 사암의 발생 빈도가 상부로 가면서 줄어드는 것이 특징이다(그림 2a). 이는 데사이트질 화산활동 이후 사면이 점차 안정화된 것으로 추정된다(Hwang et al., 2021).
4. 퇴적상 분석(sedimentary facies analysis)
본 연구 대상인 PSG-3공의 84.64-82.98 m 깊이 구간을 육안으로 입도, 내부 퇴적구조 등을 관찰하여 주상도를 작성하였고 Munsell의 Rock Color Chart를 활용하여 암색을 구분하였다. 또한 시추코어를 절단, 연마하여 미세 퇴적구조와 유공충, 성게바늘, 조개껍질 등 화석 부존여부도 확인하였다(그림 2b).
본 연구 대상 구간은 입도, 색상, 구성물질, 조직 및 퇴적구조를 바탕으로 저탁류성 사암(turbiditic sandstone, S), 저탁류성 이암(turbiditic mudstone, T) 및 반원양성 이암(hemipelagic mudstone, H)으로 구분된다(그림 3a). 84.64 m 깊이로부터 확인되는 저탁류성 사암층은 하부의 반원양성 이암과 침식 경계를 보이며 하부로부터 괴상 사암(Ta), 정점이층리 사암(Ta; 그림 3a, 3b), 뜯어올림 이암편을 포함한 사암(그림 3a, 3c), 토탄 파편을 포함하는 평행 엽층리 사암(Tb; 그림 3a, 3d) 및 희미한 엽층리의 이질 사암(Td; 그림 3a, 3e-3g)이 관찰된다. 84.35 m 깊이로부터 점차 저탁류성 이암(T; 그림 3a, 3h)으로 변화하며, 그 상부는 반원양성 이암으로 구성되어 있다(그림 3a, 3i, 3j). 본 연구에서는 저탁류성 이암과 반원양성 이암을 4개의 퇴적상(Facies 1 to 4)으로 구분하였으며, 이암층은 Stow and Shanmugam (1980)의 세립질 저탁류 퇴적체(fine-grained turbidite sequence)의 세부 퇴적구조와 유사한 특징이 확인된다.

(a) Photographs of core interval from 84.800 to 82.980 m (S: turbiditic sandstone (84.800-84.350 m); T: turbiditic mudstone (84.350-83.980 m); H: hemipelagic mudstone (83.980-82.980 m)). (b-j) (Micro)photographs of turbiditic sandstone/mudstone and hemipelagic mudstone from PSG-3 well: (b) Massive sandstone (Ta) (84.630 m). (c) Deformed sandstone with rip-up mud clasts (84.590 m). (d) Parallel laminated sandstone with lignite fragments (Tc; B3) (84.470 m). (e) Thin-bedded laminated mudstone with lignite fragments (Facies 1; C11) (84.180 m). (f) Silt-streaked mudstone (Facies 2; C17) (84.068 m). (g) Wavy silt laminated mudstone (Facies 3; F9) (83.650 m). (h) Medium gray homogeneous mudstone (Subfacies 4.1; C15) (84.115 m). (i) Light brownish gray homogenous mudstone, where widely dispersed foraminifera and shell fragment (arrows) are observed (Subfacies 4.2; E6) (83.857 m). (j) Calcite cemented homogenous mudstone (Subfacies 4.3; I1) (83.307 m). Sample locations are marked on Figs. 2b and 3a.
4.1. 퇴적상 1: 얇은 실트 층리 이암(Facies 1: Thin-bedded silt laminated mudstone)
기술
이 퇴적상은 주로 실트로 구성되어있으며, 극세립사에서 실트 입도의 엽층리와 이암이 교호한다(그림 3e). 2-3 mm 미만의 두께를 갖는 엽층리는 수평 연장성이 좋다. 극세립사 엽층리와 실트 엽층리의 상하부의 경계는 뚜렷한 편이며, 토탄파편은 층리면과 평행하게 배열되어있는 것이 특징이다. 토탄파편을 다량 포함하는 퇴적상 1은 암회색을 띤다(그림 3a).
해석
이 퇴적상은 극세립사에서 실트 입도로 수평연장성이 양호한 점으로 보아 Bouma (1962)의 실트질의 평행 엽층리(Td), Piper (1978)의 엽리 이암(TE-1) 및 Stow and Shanmugam (1980)의 얇고 연속적인 엽층리(T3) 구간과 유사하다. 이는 극세립사에서 실트 입도의 엽층리를 포함하는 이암으로 퇴적면에서 난류 의해 형성되는 사엽층리(Tc) 상부에서 점이적으로 전환된다(Talling et al., 2012). 이는 퇴적면 직상부에서 난류가 발생하여 부유 퇴적물 내 점토와 실트가 분리됨에 따라 얇은 엽층리가 발달한 것으로 해석된다(Stow and Bowen, 1991).
4.2. 퇴적상 2: 실트 줄무늬 이암(Facies 2: Silt-streaked mudstone)
기술
이 퇴적상의 기질은 실트질 점토로 구성되어 있고, 극세립사에서 실트 입도로 구성된 불연속적인 엽층리가 관찰된다(그림 3f). 기질과 실트 엽층리의 경계는 점이적 또는 선명한 경계 보이며, 실트 줄무늬(silt-streak)는 두께 1 mm 미만으로 층리면과 평행하거나 파동형을 보인다(그림 3f). 토탄파편과 유공충은 퇴적상 1에 비해 적게 분포하고 암회색을 띤다. 실트 줄무늬의 수직적 변화 양상은 파악하기 어렵다.
해석
퇴적상 2는 실트질 점토 기질에 실트 줄무늬 및 불연속적인 극세립사 엽층리가 발달한 것으로 보아 Stow and Shanmugam (1980)의 희미한 엽층리(T4) 또는 부분적으로 실트렌즈 (T6)와 유사하다. 이는 저탁류 말미에 수중에 부유된 퇴적물이 빠르게 침전되는 중 뒤따라온 흐름(surge)에 의해 극세립사 내지는 실트 입도의 입자가 유입된 결과로 해석된다(Mulder and Alexander, 2001). 또한 수조 실험에서 입도, 유속, 퇴적물 공급량의 변화를 통해, 퇴적물 공급량이 상대적으로 낮은 경우 퇴적면에서 실트 입자가 연흔 형태의 층면구조를 형성하며, 유체의 진행방향(flow direction)을 따라 수평 연장성이 좋지 못한 실트 엽리가 형성된다(Schieber et al., 2007; Yawar and Schieber, 2017). Stow and Shanmugam (1980)은 이로 인해 전반적으로 낮은 에너지의 퇴적환경에서 간헐적으로 유속이 빨라짐에 따라 불규칙한 극세립사 내지 실트 엽층이 형성되는 것으로 해석하였다.
4.3. 퇴적상 3: 파동형 실트 엽층리 이암(Facies 3: Wavy silt laminated mudstone)
기술
이 퇴적상의 기질은 주로 실트질 점토이며 실트에서 극세립사의 엽층리가 특징이다(그림 3g). 약 2-6 mm 두께의 여러 실트 엽층이 혼재되어 있으며, 상하부의 경계는 부분적으로 뚜렷하나 수평적 연장성은 좋지 못하다(그림 3g). 퇴적상 내 토탄파편은 파동형을 보이는 층리면의 형태를 따라 배열되어 있으며 전반적으로 화석은 적게 분포하고 암회색을 띤다.
해석
퇴적상 3은 Stow and Shanmugam (1980)의 희미한 엽층리(T4)와 Stow and Wetzel (1990)의 hemiturbidite와 유사하다. Hemiturbidite는 저탁류성 퇴적층 및 반원양성 퇴적층의 성질을 동시에 가지고 있으며, 이는 저탁류의 이동 마지막 단계에서 에너지를 잃고 부유된 저농도 퇴적물이 일부 재동되어 침식면이 형성된다고 해석하였다(Stow and Wetzel, 1990; Stow and Smillie, 2020). 이는 저탁류가 발생 근원지로부터 멀거나 경사도의 변화가 나타나는 곳에서 확인되는 특징이라고 해석된 바 있다.
4.4. 퇴적상 4: 괴상 이암(Facies 4: Homogeneous mudstone)
뚜렷한 퇴적구조가 인지되지 않는 괴상 이암은 암색, 분급, 그리고 탄산염 교결 등에 의해 암회색의 괴상 이암, 갈회색의 괴상 이암 및 황갈색의 탄산염질 괴상 이암으로 구분된다.
기술
이 부퇴적상은 대체로 뚜렷한 퇴적구조가 인지되지 않으며 균질한 암회색 띠는 이암(그림 3h)으로 구성되어있다. 실트 입자의 함량은 퇴적상 1-3에 비해 낮은 편이며, 하부에 엽층리 퇴적상이 놓여있는 경우 뚜렷한 경계를 보이지 않는다. 전반적으로 토탄파편이 풍부하며 유공충 등 화석이 분포한다.
해석
특징적인 퇴적구조가 확인되지 않고 화석이 분포하는 것으로 보아 Bouma (1962)의 괴상 이암(Te), Piper (1978)의 무구조 이암(TE-3), Stow and Shanmugam (1980)의 균질 이암(T8)과 유사하다. 이와 같은 무구조 이암은 분지 평원(basin plain) 및 지형적 저지대(topographic low)에 두껍게 퇴적된다고 보고되었다(Talling et al., 2012). 입자의 침강속도가 낮고, 입자의 농도가 높을 때 입자 사이의 정전기적 인력으로 인해 응집(flocculation)이 발생하여 입도에 따른 분급이 일어나지 않고 빠르게 퇴적된다(Piper, 1978; Stow and Shanmugam, 1980). 또한 응집된 부유 퇴적물이 퇴적면에서 점착성의 유체로 거동함에 따라 유성이토(fluid mud)를 형성하기도 한다(Baas and Best, 2002; Kneller and McCaffrey, 2003; Talling et al., 2012; Kase et al., 2016).
기술
이 부퇴적상은 부퇴적상 4.1과 같이 특징적인 퇴적구조가 확인되지 않는 실트질 이암이다(그림 3i). 상하부의 경계는 뚜렷하지 않으며, 갈회색(brownish gray; 10YR 6/2)의 암색을 띤다. 암회색 이암(부퇴적상 4.1)에 비해 조립질 실트 및 세립사의 분포가 많은 것이 확인되며 입자 분급이 상대적으로 불량한 것이 특징이다. 이암 내 유공충, 조개껍질, 성게바늘과 같은 화석이 다량 분포하며 일부 토탄파편도 확인된다(그림 3i).
해석
이 부퇴적상에서 생교란 흔적을 확인하지는 못하였으나 저탁류 이암에 비해 분급이 불량하고 다량의 화석 분포로 보아 반원양성 무구조 이암(H)과 유사한 것으로 해석된다(Stow and Shanmugam, 1980). 반원양성 퇴적은 심해 환경에서 세립질의 육성 기원, 화산 기원 및 생물 기원의 입자들의 수직적 침전(vertical settling)으로 퇴적된다고 해석되었다(Stow and Tabrez, 1998; Kase et al., 2016).
기술
이 부퇴적상은 부퇴적상 4.1, 4.2와 같이 뚜렷한 퇴적구조가 인지되지 않으며 탄산염 교결에 의해 황갈색(Yellowish brown; 5Y 8/1)을 띤다. 이암 내 유공충, 조개껍질 등 화석이 다량 분포하며 일부 토탄파편도 확인된다. 부퇴적상 4.3은 주로 부퇴적상 4.2와 함께 나타난다(그림 3j).
해석
부퇴적상 4.3은 이암 내 특정한 퇴적구조가 확인되지 않고 전반적으로 화석이 다량 분포하는 것으로 보아 반원양성 물질의 침전으로 퇴적된 것으로 해석된다(Stow and Shanmugam, 1980). 이 부퇴적상에서 확인되는 탄산염 교결층은 화석의 구성성분인 탄산칼슘의 일부가 탄산염으로 교결된 것으로 해석되며, 이로 인해 황갈색을 띤다. 이 부퇴적상은 반원양성 이암으로 해석된다.
5. 대자율이방성 분석
5.1. 연구방법
대자율(magnetic susceptibility)은 물질의 자기적 성질 중 하나로 암석시료에 외부자기장(H)를 가할 때, 암석시료는 그에 비례하는 유도자기(M)를 가지게된다. 이때의 비례상수(k)를 암석의 대자율이라고 하며, 이는 암석의 자화되는 정도를 의미한다(Tarling and Hrouda, 1993).
대자율이방성(anisotropy of magnetic susceptibility, AMS) 분석은 암석시료의 측정 방향에 따른 대자율의 차이를 이용하여 암석의 미세구조(petrofabric)을 해석하는 방법이며 자기미세구조(magnetic fabric) 연구라고도 한다. 대자율이방성의 크기는 암석을 구성하는 광물에 의한 결정이방성(crystalline anisotropy) 또는 입자들의 모양에 의한 형태이방성(shape anisotropy)에 영향을 받는다. 퇴적암의 경우, 구성하는 입자의 형태와 유체와 퇴적물간 상호작용에 따른 입자들의 배열상태가 대자율이방성 크기를 결정하는 중요한 요소이다(Tarling and Hrouda, 1993; Tauxe, 2005). 이 대자율이방성은 2차 텐서(second-rank symmetric tensor)로 표현될 수 있으며, 이 텐서의 고유벡터(eigenvector)와 고유값(eigenvalue)을 통해 세 개의 주축(principal axes)으로 하는 기하학적 타원체(geometric ellipsoid)로 나타낼 수 있다. 이 대자율이방성 타원체(AMS ellipsoid)의 세 주축은 통상적으로 K1, K2, K3로 표현하며, 대자율이 가장 큰 K1은 타원체의 장축, 대자율이 가장 작은 K3는 단축으로 정의한다(K1≥K2≥K3) (Hrouda, 1982). 세 주축 간 대자율의 상대적인 크기로부터 암석의 자기이방성과 그 정도가 결정되며, 퇴적학적 관점에서는 대자율이방성을 이용하여 고수류 방향 해석 또는 입자들의 배열을 통한 퇴적면에서의 입자이동 양상 등에 대한 연구가 수행된 바 있다(Taira, 1989; Graham, 1996; Park et al., 2013).
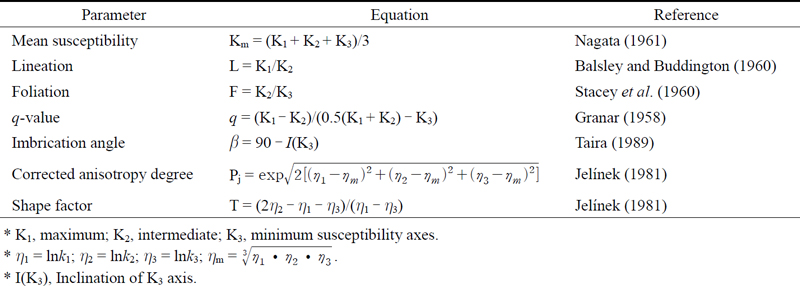
암석의 대자율이방성 정도(AMS degree)와 자기적 선구조(magnetic lineation, L) 및 엽리구조(magnetic foliation, F)의 발달 정도를 가늠하기 위해서 다양한 모수들(parameters)이 제안되었다(표 1). 자기적 선구조(magnetic lineation)는 암석을 구성하는 입자의 선호 방향을 나타낼 수 있고, 자기적 엽리구조(magnetic foliation)는 암석을 구성하는 입자의 선호 방향이 나타나는 평면을 나타낼 수 있다(Stacey et al., 1960; Taira, 1989; Park et al., 2013; Novak et al., 2014). 이들의 비를 통해 계산된 q 값은 층리면에 평행하게 작용한 전단력의 강도를 제시할 수 있다(Rees, 1966; Hamilton and Rees, 1970; Taira, 1989; Park et al., 2013). 또한 K3을 통해 비늘구조 각(imbrication angle, β)을 계산할 수 있으며(표 1), q 값과 β 값을 도시하여 퇴적 기작에 대한 해석이 수행된 바 있다(Taira, 1989; Park et al., 2013; Novak et al., 2014).

AMS (Anisotropy of Magnetic Susceptibility) parameters measured in this study.
대자율 이방성의 정도는 Pj (corrected anisotropy degree) 값을 통해 산출할 수 있으며, 이는 자성광물이 선호하는 방향(preferred orientation)의 강도를 나타낸다(표 1). 또한 대자율이방성 타원체의 형태를 정량화하는 형태모수 T (shape parameter)를 활용하여, 형태모수(T)가 0에 수렴할수록 완전한 구의 형태를 갖는다고 해석하였다. 형태모수(T)가 양(positive)의 범위를 갖을 때 타원체가 납작 편평형(oblate)의 형태를 보이며, 음(negative)의 범위를 갖을 때는 타원체가 길쭉 편장형(prolate)의 형태를 보인다고 해석된다. 또한 Pj-T 다이어그램을 도시하여 대자율이방성 정도(Pj) 및 대자율타원체 형태의 우세를 파악할 수 있다(Jelínek, 1981; Hrouda, 1982; Tarling and Hrouda, 1993).
본 연구에서는 PSG-3공의 84.61-82.98 m 깊이 구간의 사암 및 이암 시료들을 대상으로 대자율이방성 분석을 수행하였다. PSG-3공의 분석 구간을 약 2 cm 간격으로 101개의 구간을 절단하여, 하나의 구간에서 최대 6개의 시료를 가공하였으며 각 시료는 최대 8 cm3 (2 × 2 × 2 cm)의 직육면체 형태로 성형하여 대자율이방성 분석을 수행하였다. 한국지질자원연구원이 보유하는 AGICO사의 MFK1-A kappabridge 측정장비를 활용하였으며, 분석 중 외부자기장은 300 A/m로 설정하였다.
본 연구에 활용된 PSG-3공은 시추 당시 정향을 측정하지 않은 시추코어를 이용한 관계로 고수류의 정향을 확인할 수 없었다. 하지만 사암층의 평행 층리가 잘 발달한 구간(A6, A7 시료)을 기준으로 주된 유체의 흐름 방향을 파악하고자 하였다. 아래 연구결과에서 언급되는 장축의 방향은 측정장비의 초기 설정 기준에 따라 0°가 설정되었다. 이는 시료를 장비에 삽입할 때의 초기 배치방향을 기준으로 한 것으로 K1의 값은 특정 방향을 제시하기보다 장비 설정 기준에 따른 수직적 변이를 파악하기 위해 활용되었다.
5.2. 연구결과
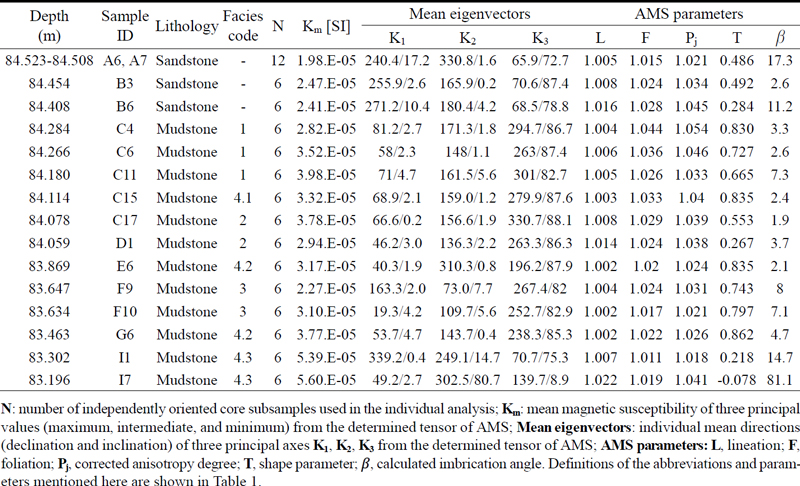
605개 시료로부터 대자율이방성에 대한 분석결과를 얻었다. 분석한 시료들의 총 평균대자율(mean magnetic susceptibility, Km)은 3.66 × 10⁻⁵ [SI]이며, 시료 각각의 대자율 값은 1.75 × 10⁻⁵ - 1.11 × 10⁻⁴ [SI]의 범위를 가졌다. 표 2는 대자율이방성 분석의 일부 결과로서, 깊이 구간 별 평균대자율(Km), 대자율이방성 타원체 주축 방향(K1, K2, K3), 대자율이방성 관련 주요 모수들(L, F, Pj, T, β)을 제시한다.
Representative AMS (Anisotropy of Magnetic Susceptibility) data from selected intervals of the PSG-3 well in Pohang Basin.
본 연구는 시추코어를 활용한 분석으로 저탁류로 인한 주된 유체의 흐름 방향을 파악하고자 평행 층리가 잘 발달된 사암(A6, A7 시료)을 기준으로 고수류의 방향을 설정하였다(그림 2b, 4a; 84.52-84.50 m). 이 구간은 대자율이방성 분석 결과, K1이 약 240° 방향으로 밀집되어 분포하는 것을 확인할 수 있었다. 이 방향을 주된 유체의 흐름방향으로 설정하였으며, 이 구간에서의 비늘구조 각(β)은 17.3°이다(표 2; 그림 4a). 또한 저탁류 사암층에서 토탄파편을 다량으로 포함하며 평행엽리가 잘 발달한 사암인 B3 시료(그림 2b, 3c; 84.45 m)와 얇은 이질층을 포함하나 엽리가 잘 발달한 사암인 B6 시료(그림 2b; 84.40 m)의 대자율이방성 분석을 통해 A6, A7 시료와 유사한 자기미세조직을 확인하였다(그림 4a-4c). B3 시료의 K1은 A6, A7 시료의 대자율이방성 분석으로부터 추정한 주 유체방향과 거의 평행하는 결과를 보였으며, 이는 B3 시료가 주된 흐름에 평행한 자기미세조직(flow aligned fabric)을 갖는 것으로 보인다(그림 4b). B6 시료의 경우, K1이 A6, A7의 주 유체방향으로부터 시계방향으로 약 30°의 차이를 보였고(271.2°), 비늘구조 각(β)은 11.2°로 나타났다(표 2; 그림 4c). 즉, B6 시료는 주 유체방향 대비 흐름에 사각인 조직(flow oblique fabric)을 가졌던 것으로 추정된다(그림 4c).

Stereonet diagrams of orientation of AMS principal axes as presentation of AMS results from individual facies. (a-c) Facies of parallel laminated sandstone with lignite fragments (samples A6-A7, B3, and B6). (d-f) Thin bedded silt laminated mudstone (Facies 1), (g-h) silt-streaked mudstone (Facies 2), (i-j) wavy silt laminated mudstone (Facies 3), (k) medium gray homogeneous mudstone (Subfacies 4.1), (l) brownish gray homogenous mudstone (Subfacies 4.2), and (m-n) yellowish brown calcite cemented homogenous mudstone (Subfacies 4.3). Principlal axes are presented with red square (K1), green triangle (K2), and blue circle (K3) symbols. The red arrows indicate the flow direction inferred from the AMS analysis from A6 and A7 samples (the lowest part of parallel laminated sandstone), whereas the black arrows indicate the AMS-inferred flow direction from each sample. The stratigraphic positions of individual samples are marked in Fig. 2b.
퇴적상 1은 이암층 내 부분적으로 극세립사 엽층리와 토탄파편 엽층리가 관찰되었다(그림 2b, 3e). 대자율이방성 분석을 수행한 결과, 퇴적상 1의 이방성 정도(Pj)는 1.021-1.061의 범위를 가졌으며 형태모수(T)는 0.191-0.834으로 편평형(oblate) 영역에 분포하였다(그림 5). C4 시료 및 C11 시료의 대자율이방성(AMS) 분석결과, K1은 군집(cluster)된 양상을 보였으며 C4, C11 시료는 유체의 주 흐름방향에 평행한 조직(flow aligned fabric)을 갖는다고 특징지을 수 있었다(그림 4d, 4f). C6 시료의 경우, B6 시료와 유사하게 주 흐름방향에 사각인 조직(flow oblique fabric)을 갖는 것으로 추정된다(그림 4e).

Vertical variation of magnetic susceptibility and AMS parameters from the analyzed interval (84.656-82.980 m) of PSG-3 well. The presented AMS parameters are magnetic foliation F, corrected anisotropy Pj, shape parameter T, and imbrication angle β, for which the definitions can be found in Table 1. Facies classification (see text for details) is also presented by shaded boxes with different colors.
이암층 내 불연속적인 실트 엽층리가 관찰되는 퇴적상 2의 이방성 정도(Pj)는 1.009-1.042의 범위를 가졌으며, 형태모수(T)는 -0.312-0.885로 일부 편장형(prolate) 영역에 도시되었으나 대체로 편평형(oblate) 영역에 분포하였다(그림 5; 표 3). C17, D1 시료의 대자율이방성(AMS) 분석결과, K1은 군집(cluster)된 분포를 보였으며 A6, A7 시료에서 정의된 주 흐름방향에 평행한 조직(flow aligned fab-ric)을 갖는다(그림 4g, 4h).
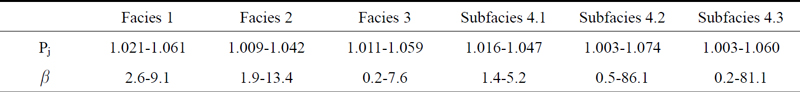
Range of anisotropy degree (Pj) and imbrication angles (β) of each facies.
상하부의 경계가 부분적으로 뚜렷하고 파동형 엽리가 관찰되는 퇴적상 3의 이방성 정도(Pj)는 1.011-1.059의 범위를 가졌다. 형태모수(T)는 대체로 -0.285-0.826에 분포하며 편평형(oblate) 영역에 도시되는 것이 대다수였다(그림 5; 표 3). F9, F10 시료의 대자율이방성 분석결과, 주 흐름방향에 직교하는 조직(flow transverse fabric) 및 사교하는 조직(flow oblique fabric)을 갖는 것으로 보인다(그림 4i, 4j).
저탁류 퇴적층으로 추정되는 암회색의 괴상 이암인 부퇴적상 4.1은 1.016-1.047의 이방성 정도(Pj)를 보였으며, 형태모수(T)는 0.429-0.933으로 편평형(oblate) 영역에 도시되었다(그림 5; 표 3). C15 시료의 대자율이방성(AMS) 분석 결과, 주 유체 흐름방향에 평행한 조직(flow aligned fabric)을 갖는 것으로 나타났다(그림 4k). 반원양성 이암으로 추정되는 갈회색 괴상 이암인 부퇴적상 4.2의 이방성 정도(Pj)는 1.003-1.074의 범위를 보였으며 일부 이상값(1.074)도 나타났다(그림 5). 형태모수(T)는 -0.641-0.96으로 편평형(oblate) 영역에 도시되었다(그림 5; 표 3). E6 시료의 대자율이방성 분석결과, K1과 K2가 방사상으로 분포하는 무작위적 배열(randomly oriented fabric)을 보였으며(그림 4l), 일부 시료는 K1이 군집된 분포를 보이며 흐름에 평행한 조직(flow aligned fabric)을 갖는 것으로 나타났다. 이암 내 부분적인 탄산염 교결이 특징인 황갈색의 괴상 이암인 부퇴적상 4.3의 이방성 정도(Pj)는 1.003-1.060 범위를 가졌다(그림 5; 표 3). 형태모수(T)는 -0.62-0.97의 범위를 보이며 편장형(prolate), 편평형 영역(oblate)에 도시되었다. I1, I7 시료의 대자율이방성 분석 결과, 특정한 배열을 보이지 않는 무작위적 배열(randomly oriented fabric)을 보였으며, I7 시료의 경우 비늘구조 각(β)이 80° 이상을 보이는 것도 확인된다(그림 4m, 4n, 5).
6. 총유기탄소 분석
(반)원양성 이암은 지표면의 절반 이상을 덮고 있으며, 석유지질의 관점에서 이들은 유기탄소의 근원암(source rock)의 역할을 한다(Brooks and Fleet, 1987). 또한 야외노두에서 구분한 저탁류성 이암과 반원양성 이암의 유기지화학 분석 결과 저탁류성 이암이 반원양성 이암에 비해 총유기탄소 함량이 낮은 것으로 보고되었다(O’Brien et al., 1980; Watanabe and Akiyama, 1987; Kurosawa et al., 2023). Choi et al. (2022)은 포항 분지 5개의 시추공(PD-1, PD-2, PSG-1, PSG-2, PSG-3; 그림 1)에서 지화학 분석을 수행하여 천부가스전의 기원에 대한 연구를 수행하였으며, Rock-Eval 열분석을 통해 유기물질의 특성을 도시하였다. Choi et al. (2022)은 5개의 시추공에서 확인되는 포항퇴적단위 P3 퇴적물의 총유기탄소(TOC) 함량은 1.10-2.87 wt% (average=1.85 wt%)의 범위를 갖는 것으로 보고하였으며 그 중 PSG-3공의 이암에서 총유기탄소(TOC) 함량은 1.33-1.74 wt%의 범위를 갖는다고 보고하였다. 이는 생물기원의 가스 발생에 충분한 함량이며(Rice, 1993), 반 크레블렌(van Krevelen) 다이어그램에서 Type II/III에 도시된다.
6.1. 분석 방법
본 연구에서는 퇴적상을 기반으로 구분한 저탁류성 이암과 반원양성 이암의 총유기탄소(TOC) 함량의 비교를 위해 84.430-82.980 m 구간에서 85개의 시료를 채취하여 Rock-Eval 열분석을 실시하였다. 총유기탄소 분석을 위해 각 구간에 해당하는 시료를 마노절구를 이용하여 분쇄한 후 희석된 염산(HCl)으로 무기탄소(inorganic carbon) 제거하였다. 이후 남아있는 산을 중화하고 불순물을 제거하기 위해 수 차례 세척을 수행하였다. 세척된 시료는 수분 제거를 위해 80°C의 오븐에서 건조 후 약 60-70 mg의 부시료를 정량하여 열분석을 실시하였다. 암상 내 유기탄소 함량을 파악하기 위해 한국지질자원연구원이 보유하고있는 Rock-Eval Turbo 6를 활용하였다.
6.2. 분석 결과
Rock-Eval 분석결과 총유기탄소(TOC) 함량은 0.97-3.64 wt% (average=2.1 wt%)의 범위를 가지며(그림 6a), PSG-3호공 84.430-84.350 m에 해당하는 사암층의 경우 0.97-2.78 wt% (average=1.67wt%, n=7)의 범위를 보였다. 저탁류성 이암(84.350-83.980 m)은 1.4-3.64 wt% (average=2.27 wt%, n=37), 반원양성 이암(83.980-82.980 m)은 1.31-3.25 wt% (average=2.01 wt%, n=47)의 범위를 가졌다(그림 6b).

(a) Vertical variation of the corrected anisotropy degree (Pj; 84.656-82.980 m) and total organic carbon (TOC; 84.430-82.980 m) contents from the analyzed interval of PSG-3 well. Subdivision of turbiditic sandstone, mudstone, and hemipelagic mudstone successions is also shown by dashed horizontal lines. Silty layers in hemipelagic succession are marked by gray color boxes. Rough trends of Pj value and TOC content are presented by black arrows. (b) The box plots of TOC contents of turbiditic mudstone (T) and hemipelagic mudstone (H). The boxes represent the interquartile ranges (IQRs), the whiskers represent the 95% (1.5 × IQR) ranges, and the solid lines in the boxes are the median values. Turbiditic mudstone has a range of 1.4-3.64 wt% (average=2.27 wt%, n=37), whereas hemipelagic mudstone has a range of 1.31-3.25 wt% (average=2.01 wt%, n=47). (c) Photograph of cut surface of hemipelagic mudstone including silty layers at 83.850-83.870 m depth. (d-e) Microphotographs and orientation results of AMS principal axes from two positions of 83.845 and 83.830 m depth, showing wavy silt laminated mudstone (Facies 3) overlain by hemipelagic mudstone (Subfacies 4.2; sample E6): (d) The microphotograph shows sharp boundary between silty mud matrix and muddy lens, which also is parallel to the arrangement of laminated lignite fragments. The corresponding AMS fabric indicates the azimuth of K1 parallel to the flow direction and imbrication angle (β) of 5.9° (83.845 m depth); (e) The microphotograph shows muddy lens (seems like ‘floc’) in the silty mud matrix. The AMS fabric indicates the azimuth of K1 subparallel to the flow direction and imbrication angle (β) of 7.5° (83.830 m depth).
7. 토 의
7.1. 퇴적상에 따른 자기미세조직
본 연구에서는 저탁류성 이암과 반원양성 이암의 연속적인 퇴적층에서 퇴적상 분석 및 대자율이방성 분석을 수행하였다. 대자율이방성 분석으로 확인되는 자기미세조직을 통해 쇄설성 퇴적물의 고수류 또는 퇴적작용을 추론할 수 있으며, 이는 광물의 입자 배열에 의해 결정된다(Taira and Scholle, 1979; Taira, 1989; Tarling and Hrouda, 1993; Graham, 1996; Joshep et al., 1998; Baas et al., 2007; Park et al., 2013). 특히 5 × 10⁻⁴ SI 미만의 대자율과 낮은 이방성정도(Pj < 1.05)를 갖는 퇴적암의 자기미세조직은 반자성 광물(paramagnetic minerals)의 기여도가 큰 것으로 알려져있다(Tarling and Hrouda, 1993). 포항분지에서는 선행연구를 통하여 세립질 퇴적암의 자기미세조직을 분석하여 고수류의 방향, 퇴적작용을 고찰한 바 있다. Park et al. (2013)에 따르면 포항분지 세립질 퇴적암의 평균 대자율(Km)은 1.24 × 10⁻⁵ SI이며, 히스테리시스 곡선(hysteresis curve)의 형태를 통해 이암 및 사암 기질의 반자성 광물 배열에 의해 자기미세조직이 형성된 것으로 해석하였다. 본 연구의 분석 구간에서의 각 시료의 대자율은 이와 유사한 범위에 분포하며(표 2; 그림 5), 시료를 구성하는 강자성 광물(ferromagnetic minerals)의 특성에 기인한 결정이방성(crystalline anisotropy) 보다는 입자의 배열에 따른 형태이방성(shape anisotropy)에 의해 자기미세조직이 형성된 것으로 판단하였다. 이는 세립질 퇴적암의 퇴적작용 해석에 중요한 정보를 제공한다.
Baas et al. (2007)은 심해 저탁류 퇴적체에서 대자율이방성(AMS) 분석을 통해, Tb, Tc와 같이 평행 층리 혹은 연흔 사층리를 보이는 사암층에서는 흐름에 평행한 조직(flow aligned fabric)과 흐름에 직교하는 조직(flow transverse fab-ric)을 확인하였다. 이는 퇴적물 농도, 층면구조, 유속 등의 영향으로 장축의 배열이 달라진 결과로 해석하였다. 층리를 보이는 저탁류 사암(Tb)의 경우, 저탁류로 인해 운반된 퇴적물이 층리면에서 유체의 이동방향에 따라 평행하게 정렬되는 경우와 직교하는 경우가 있으며, 이는 각각 층리면에서 퇴적물이 미끌림 작용(sliding) 및 구름 작용(rolling)으로 이동한 것으로 해석하였다. 이 때 퇴적암을 구성하는 입자들의 방향(grain orientation)은 유체의 진행방향으로부터 15° 내외의 범위를 갖는다(Allen, 1964). 또한 사엽층리를 보이는 사암(Tc) 구간의 경우, 층면 구조의 발달로 인해 유체의 방향과 속도가 지속적으로 변화하여, 이에 따라 자기미세조직의 변동성이 나타난다(Taira and Scholle, 1979). 본 연구에서 Bouma (1962)의 Tc 구간에 해당하는 평행 층리가 잘 발달한 사암에서의 대자율이방성(AMS) 분석결과, K1과 K2는 대원상에 분포하며 비늘구조 각(β)은 17.3°로 나타났다. 또한 Bouma (1962)의 Td 구간과 유사한 평행 엽층리가 잘 발달한 구간에서는 K1의 배열이 흐름에 평행하거나 사교하는 조직을 확인하였으며(그림 3d, 4b, 4c; 표 2), 이는 퇴적층면에서 퇴적물이 미끌림 작용으로 인해 이동된 것으로 해석된다.
이러한 특징은 사암층에서 뿐만 아니라 저탁류성 이암에서도 확인된다. 퇴적상 1(얇은 실트 엽층리 이암)과 퇴적상 2(실트 줄무늬 이암)에서는 주 유체의 흐름방향과 평행하거나 사교하는 조직이 확인되었으며, 이는 퇴적층면에서 세립질 퇴적물이 주로 미끌림 작용으로 이동했음을 지시한다(그림 7a). 퇴적상 3(파동형 실트 엽층리 이암)에서는 흐름에 평행한 조직과 직교하는 조직이 확인되었으며, 이는 퇴적물의 농도 변화와 유체 속도의 변화로 세립질 퇴적물이 퇴적층면에서 미끌림 작용 및 구름 작용으로 이동했던 것으로 추정된다(그림 7b). 저탁류성 이암인 퇴적상 1, 2, 3에서 자기미세조직의 변동성이 발생한 것은 퇴적면에서 형성된 층면구조에 의해서 유체의 방향과 속도가 지속적으로 변화하였을 가능성도 제시한다. 즉, 저탁류 말미에도 지속적으로 흐르는 유체에 의해 퇴적층면에서 층면구조가 형성될 가능성이 있다(Taira and Scholle, 1979; Taira, 1989; Baas et al., 2007; Reineck and Singh, 2012; Park et al., 2013). 이로 인해 이암 내 연장성이 좋은 엽층리, 불연속적인 엽층, 렌즈상의 실트 엽층이 등이 관찰되는 것으로 추정된다. 또한 형성된 층면구조에 의해 유체의 방향과 속도가 지속적으로 변화하여 자기미세조직의 변동성이 발생한다고 해석된다(Taira and Scholle, 1979; Harms et al., 1982; Baas et al., 2007). 이로 인해 유체의 주방향과 직교하는 방향으로 발달한 렌즈상 실트가 형성되었을 가능성도 있다. 부퇴적상 4.1(암회색의 괴상 이암)에서는 무작위적 배열의 자기미세조직이 우세하나, 일부 K1이 군집화 되는 경향도 확인되었다. 이는 저탁류 말미에 점토질 퇴적물의 응집화(flocculation)되어 빠르게 침전된 결과로 해석된다. 일부 K1이 군집화 되는 경향은 약한 흐름의 영향을 받은 것으로 해석된다(그림 7c). 저탁류의 말미에는 부유된 퇴적물의 농도가 증가하며, 입자 사이의 정전기적 인력으로 점토광물의 응집(aggregates of clay particles, ACPs)이 일어나고, 이로 인해 빠르게 침전되는 양상은 많은 논문에서 보고되어왔다(Kase et al., 2016). 점토광물의 응집이 일어나 빠른 속도로 침전되는 중 유체의 지속적인 흐름에 영향을 받는다면 이들의 배열 또한 특정 방향으로 군집화 될 가능성도 있다.

Schematic illustration of a column consisting of turbiditic and hemipelagic mudstones, which accounts for their sedimentation processes in PSG-3 well. (a) In the turbidity current, the particles can be deposited parallel (or subpararellel) to the flow direction, via the predominance of sliding on depositional surface, while (b) Some particles experience rolling along the depositional surface, thereby allowing their long axes to be perpendicular to the flow direction. The difference in the particle movement might be due to changes in flow velocity, bedform migration, or variations in sediment concentration. (c) As the concentration of suspended particles increases during the last stage of turbidity current, fine-grained particles can flocculate, leading to rapid fallout on the depositional surface. (d) During the hemipelagic setting, suspended sediments (clay minerals) slowly settle down, with abundant biogenic minerals. The clay minerals will show random fabric.
반원양성 이암에 해당하는 부퇴적상 4.2(갈회색 괴상 이암)에서는 무작위적 배열이 나타나며, 이는 부유 퇴적물의 수직적 침전으로 인한 것으로 해석된다. 일부 K1이 군집된 경향을 보이는 것은 퇴적층면에서 약한 흐름의 영향이 있었음을 시사한다. 부퇴적상 4.3(탄산염질 이암)에서는 부퇴적상 4.2와 달리 주 축의 결정이 되지 않은 무작위적 배열을 보이는 것이 특징이다. 이는 생물기원의 교란이나, 탄산염 교결로 인해 1차 퇴적구조의 변형되었을 가능성을 제시한다(Rochette, 1988).
대자율이방성 분석을 통해 확인되는 이방성 정도(Pj)와 자기적 엽리구조(F)는 퇴적암을 구성하는 입자의 퇴적 당시 층리면에서 발생한 유속 등을 가늠할 수 있는 지표로 활용된다(Joseph et al., 1998). 비늘구조 각(imbrication angle, β) 또한 퇴적암을 구성하는 입자들의 배열에 따라 발생하는 것으로, 이때 형성되는 기울기는 흐름의 세기, 퇴적물의 밀도 등에 영향을 받기 때문에 퇴적물 운반 기작을 고찰하는데 중요한 지표가 된다(표 1) (Taira, 1989; Park et al., 2013; Novak et al., 2014). 분석 구간에서 각 퇴적상에 따른 이방성 정도(Pj)와 비늘구조 각(β)은 표 3과 같다. 저탁류성 이암인 퇴적상 1에서 부퇴적상 4.1로 변해가는 상조합에서 이방성 정도와 비늘구조 각은 상부로 갈수록 감소하는 경향을 보인다. 이는 저탁류의 유속 감소 및 농도 변화로 인한 것으로 해석된다.
반원양성 이암인 부퇴적상 4.2와 부퇴적상 4.3의 이방성 정도와 비늘구조 각은 저탁류성 이암의 이방성 정도에 비해 넓은 범위에 걸쳐 분포한다(표 3). 조용한 환경에서는 수직적 침전으로 인해 낮은 값의 이방성 정도와 비늘구조 각이 나타난다(Taira, 1987; Tarling and Hrouda, 1993; Park et al., 2013). 분석구간에서는 상부로 갈수록 낮은 이방성 정도와 저각의 비늘구조가 확인되나, 일부 비이상적으로 높은 비늘구조 각을 보이는 구간이 나타난다(그림 5). 이는 육안으로 확인되지 않는 생물기원의 교란이나 기질 내 탄산염 물질이 고화되는 과정에서 부분적으로 치환된 광물이 1차 퇴적구조를 교란시켰을 가능성도 제시한다(Rochette, 1988).
7.2. 퇴적상에 따른 총유기탄소 함량의 변화
총유기탄소(total organic carbon, TOC) 분석을 수행하여 저탁류성 이암과 반원양성 이암의 구분이 수행된 바 있다. 반원양성 이암은 중력의 영향으로 수층에 부유된 세립질 퇴적물이 수직적 침전을 하여 주로 생물기원의 물질이 다량 분포하나, 간헐적으로 공급되는 저탁류성 이암은 수직적 침전과 함께 유체 흐름의 영향을 받아 육성기원의 물질이 다량으로 포함된다. Watanabe and Akiyama (1998)는 포항분지의 퇴적상과 유사한 일본 니가타 분지 내 Teradomari Formation의 저탁류성 이암과 반원양성 이암에서 각각 시료를 채취하여 유기물 분석을 수행하였다. 저탁류성 이암과 반원양성 이암은 주로 육성기원 및 해양 플랑크톤 기원으로 해석되며, 저탁류성 이암은 0.6-1.1 wt%, 반원양성이암은 1.2-2.5 wt%의 범위를 보여 반원양성 이암의 총유기탄소 함량이 높다고 보고하였다.
본 연구의 분석구간은 저탁류성 사암, 저탁류성 이암 그리고 반원양성 이암으로 구분할 수 있으며, 저탁류성 사암으로부터 저탁류성 이암으로 퇴적상이 변화하는 84.43-84.35 m 구간에서 총유기탄소 함량은 증가한다(그림 6a). 이는 상부로 갈수록 사암 기질 내에 이질 퇴적물의 함량이 증가한 결과로 추정된다. 저탁류성 이암으로 판단되는 퇴적상 1-4.1 구간의 총유기탄소 함량은 1.4-3.64 wt% 범위를 보인다. 이 구간에서는 상부로 갈수록 총유기탄소 함량이 감소하는 경향을 보이지만, 일부 시료에서는 토탄파편이 다량 포함되어 높은 총유기탄소 함량을 보인다(그림 3f, 4a-4d). 반원양성 이암의 총유기탄소 함량은 1.31-3.25 wt% 보이며, 저탁류성 이암과 유사한 범위를 갖는다(그림 6b). 반원양성 이암 구간에서는 상부로 갈수록 총유기탄소 함량이 증가하는 경향을 보이나 부분적으로 낮은 값을 나타내는 구간이 분포한다(그림 6a). 이 구간의 이암 내에는 부분적으로 실트 입도의 이암이 0.5-2 cm 두께로 발달해 있으며(그림 4e, 4f, 6c), 부분적으로 평행하게 배열된 토탄파편 렌즈를 포함하기도 한다(그림 6d, 6e). 이는 반원양성 이암의 퇴적이 우세한 시기에도 저농도 저탁류의 유입으로 인해 일시적으로 총유기탄소 함량이 낮아진 것으로 해석된다. 반원양성 이암의 일부 구간에서는 토탄파편 분포로 인해 높은 총유기탄소 값을 보인다. 반원양성 이암 구간에서 전반적으로 총유기탄소 함량이 증가하는 경향은 두꺼운 저탁류 퇴적체가 형성된 이후 사면이 점차적으로 안정화되면서 육성기원 쇄설성 퇴적물의 공급이 점차 감소한 것으로 해석된다.
7.3. 퇴적상, 자기미세조직 및 총유기탄소 함량의 연관성
본 연구에서 분석된 구간은 저탁류성 사암에서 상부로 갈수록 기질 내 점토 함량 증가와 함께 저탁류성 이암 및 반원양성 이암으로 전이되는 양상을 보인다. 대자율이방성 정도(Pj)와 총유기탄소 함량(TOC)을 함께 도시하였을 때 다음과 같은 특징이 확인된다(그림 6a). 저탁류성 사암 구간은 상부로 갈수록 괴상 사암(Ta), 뜯어올림 이암편을 포함하는 사암, 평행층리가 잘 발달한 사암(Tb), 사엽층리가 발달한 사암(Tc)이 확인되며, 상부로 갈수록 이방성 정도(Pj)와 비늘구조 각(β)이 증가하는 경향을 보인다(그림 6a). 즉 괴상 사암 및 뜯어올림 이암편을 포함하는 사암에서는 고농도의 저탁류에 의해 이동되는 조립질 사암이 빠른 속도로 침전하여 낮은 이방성 정도(Pj)를 보이나 평행층리가 잘 발달한 사암에서는 퇴적 당시 퇴적면에서 전단력이 증가함에 따라 사질 퇴적물이 일정한 방향으로 정렬되어 높은 이방성 정도(Pj)와 비늘구조 각(β)을 갖는 것으로 해석된다. 저탁류성 사암의 경우 상부 이암에 비해 낮은 총유기탄소 함량을 보이나, 사암 내 토탄파편이 층리를 이루는 구간에서는 높은 총유기탄소 함량을 보인다(그림 6a).
저탁류성 이암은 암회색의 얇은 실트 엽층리 이암(퇴적상 1), 실트 줄무늬 이암(퇴적상 2), 파동형 엽층리 이암(퇴적상 3) 및 괴상의 이암(부퇴적상 4.1)의 상조합을 보인다. 저탁류성 이암 상조합에서 상부로 갈수록 이방성 정도(Pj)와 비늘구조 각(β)은 감소하는 경향을 확인할 수 있었으며, 이는 저탁류의 유속 감소에 따른 전단력의 감소로 인한 것으로 해석된다. 총유기탄소 함량 또한 일부를 제외하고 감소하는 경향을 보인다. 일부 이암에서 높은 총유기탄소 함량을 보이는 것은 토탄파편이 다량으로 분포한 결과로 해석된다(그림 6a).
반원양성 이암은 전반적으로 갈회색의 분급이 불량한 이암으로 유공충과 같은 생물기원의 물질이 다량 분포하는 것이 특징이다(Subfacies 4.2, 4.3). 또한, 이방성 정도(Pj)는 대체로 1.015 미만의 낮은 값을 보이며 총유기탄소 함량은 상부로 갈수록 증가하는 경향을 보이는 것이 특징이다(그림 6a). 다만, 부분적으로 높은 이방성 정도(Pj)와 낮은 총유기탄소(TOC) 함량을 보이는 구간이 분포하는데, 이는 반원양성 이암 내 실트질 이암이 관찰되는 구간과 잘 대비된다(그림 6a). 이 구간은 간헐적으로 유입된 저농도 저탁류(low density turbidity current)에 기인한 것으로 해석된다.
8. 결 론
본 연구에서는 퇴적작용 및 퇴적환경 변화에 따른 저탁류성 이암과 반원양성 이암의 구분을 시도하였다. 이를 위해 포항분지 분지저 환경에서 퇴적된 PSG-3공의 퇴적상을 분석하였고, 각 퇴적상에 나타나는 자기미세구조와 및 총유기탄소 함량의 수직적 변이를 통해 저탁류성 이암과 반원양성 이암의 퇴적 특성을 파악하고자 하였다.
저탁류성 이암은 암회색을 띠며 얇은 실트 층리 이암(퇴적상 1), 실트 줄무늬 이암(퇴적상 2), 파동형 실트 엽층리 이암(퇴적상 3), 괴상 이암(부퇴적상 4.1)으로 구분된다. 저탁류성 이암의 대자율이방성 분석 결과 유체 흐름 방향과 장축이 평행하거나 직교하는 조직을 보이며, 이는 세립질 입자가 퇴적면에서 미끄러짐, 끌림, 구름 작용으로 이동하였음을 시사한다. 저탁류성 이암 상조합에서 이방성 정도(Pj)와 비늘구조 각(β)이 상부로 가면서 감소하는 경향은 저탁류의 유속 감소로 인한 것으로 사료된다. 반면, 반원양성 이암은 갈회색의 실트와 생물기원의 물질이 포함된 갈회색의 괴상 이암(부퇴적상 4.2)과 탄산염 교결 괴상 이암(부퇴적상 4.3)으로 구성되며, 대자율이방성 분석 결과 무작위적 배열과 약한 흐름에 평행한 조직이 확인되었다.
저탁류성 이암과 반원양성 이암의 총유기탄소 함량의 분포 범위는 크게 차이를 보이지 않았다. 다만 수직적 변이를 보았을 때 저탁류성 이암 구간에서는 상부로 갈수록 감소하는 경향을 보인다. 반원양성 이암은 상부로 갈수록 증가하는 경향을 보이며, 이는 대규모 저탁류 형성 후 사면 환경이 안정되면서 쇄설성 퇴적물의 공급량이 감소한 결과로 해석된다. 하지만 반원양성 이암 내, 높은 이방성 정도(Pj)와 낮은 총유기탄소 함량을 보이는 구간은 간헐적으로 공급된 저밀도 저탁류의 영향을 받았음을 시사한다.
퇴적상, 대자율이방성 및 총유기탄소 함량 분석을 통해 포항분지 PSG-3공 시추코어에서 확인되는 이암의 퇴적작용과 퇴적환경 변화를 파악하였고, 이러한 결과는 향후 세립질 퇴적암 및 퇴적환경 해석에 중요한 기초 자료가 될 것으로 판단된다.
Acknowledgments
본 연구는 한국지질자원연구원의 기본사업 “국내 대륙붕 3차원 석유시스템 평가 및 셰일가스전 EGR+ 원천기술 개발(GP2020-006)”의 재원으로 수행되었습니다. 논문의 부족한 부분을 개선하도록 의견주신 두 분의 심사위원과 편집위원, 편집위원장께 감사드립니다.
References
-
Allen, J., 1964, Primary current lineation in the Lower Old Red Sandstone (Devonian), Anglo-Welsh Basin. Sedimentology, 3, 89-108.
[https://doi.org/10.1111/j.1365-3091.1964.tb00635.x]

-
Baas, J.H. and Best, J.L., 2002, Turbulence Modulation in Clay-Rich Sediment-Laden Flows and Some Implications for Sediment Deposition. Journal of Sedimentary Research, 72, 336-340.
[https://doi.org/10.1306/120601720336]
-
Baas, J.H., Best, J.L. and Peakall, J., 2011, Depositional processes, bedform development and hybrid bed formation in rapidly decelerated cohesive (mud-sand) sediment flows. Sedimentology, 58, 1953-1987.
[https://doi.org/10.1111/j.1365-3091.2011.01247.x]
-
Baas, J.H., Hailwood, E.A., McCaffrey, W.D., Kay, M. and Jones, R., 2007, Directional petrological characterisation of deep-marine sandstones using grain fabric and permeability anisotropy: Methodologies, theory, application and suggestions for integration. Earth-Science Reviews, 82, 101-142.
[https://doi.org/10.1016/j.earscirev.2007.02.003]
- Balsley, J.R. and Buddington, A.F., 1960, Magnetic susceptibility anisotropy and fabric of some Adirondack granites and ortho-gneisses. American Journal of Science, 258-A, 6-20.
- Bouma, A.H., 1962, Sedimentology of some flysch deposits. A graphic approach to facies interpretation, Amsterdam, Elsevier, 168 p.
-
Brooks, J. and Fleet, A., 1987, Marine petroleum source rocks. Geological Society, London, Special Publications, 26.
[https://doi.org/10.1144/GSL.SP.1987.026.01.02]
-
Choe, M.Y. and Chough, S.K., 1988, The Hunghae Formation, SE Korea: Miocene debris aprons in a back-arc intraslope basin. Sedimentology, 35, 239-255.
[https://doi.org/10.1111/j.1365-3091.1988.tb00947.x]
-
Choi, J., Kang, N.-K., Hwang, I.G. and Lee, D.-H., 2022, Geochemical characteristics and origins of hydrocarbon gases in the shallow gas field in the Pohang Basin, Korea. Geosciences Journal, 26, 349-365.
[https://doi.org/10.1007/s12303-021-0035-1]
-
Emmings, J.F., Davies, S.J., Vane, C.H., Moss-Hayes, V. and Stephenson, M.H., 2020, From marine bands to hybrid flows: Sedimentology of a Mississippian black shale. Sedimentology, 67, 261-304.
[https://doi.org/10.1111/sed.12642]
-
Graham, J.W., 1996, Significance of magnetic anisotropy in Appalachian sedimentary rocks. In: Steinhard, J.S., and Smith, T.J., eds., The earth beneath the continents: American Geophysical Union Geophysical Monographs, 10, 627-648.
[https://doi.org/10.1029/GM010p0627]
- Granar, L., 1958, Magnetic measurements on Swedish varved sediments. Ark. Geofys, 3, 1-40.
- Hamilton, N. and Rees, A., 1970, The use of magnetic fabric in paleocurrent estimation. In: Runcorn, S.K. (Ed.), Paleogeophysics. Academic Press, New York, 445-464.
- Han, J.H., Kwak, Y.H. and Son, J.D., 1986, Tectonic evolution and depositional environments of the Tertiary sedimentary basin, southeastern part of Korea. Report R-86-2-(B)-4, Korea Institute of Energy and Resources, Seoul, 109 p.
-
Harms, J.C., Southard, J.B. and Walker, R.G., 1982, Structures and sequences in clastic rocks. SEPM Society for Sedimentary Geology, 9, 249 p.
[https://doi.org/10.2110/scn.82.09]
-
Haughton, P., Davis, C., McCaffrey, W. and Barker, S., 2009, Hybrid sediment gravity flow deposits-classification, origin and significance. Marine and Petroleum Geology, 26, 1900-1918.
[https://doi.org/10.1016/j.marpetgeo.2009.02.012]
-
Hong, S.W., Chough, S.K. and Hwang, I.G., 1998, Provenance of coarse-grained detritus in fan-delta systems, Miocene Pohang Basin, SE Korea: Implications for boundary fault movements. Geosciences Journal, 2, 46-58.
[https://doi.org/10.1007/BF02910203]
-
Hrouda, F., 1982, Magnetic anisotropy of rocks and its application in geology and geophysics. Geophysical surveys, 5, 37-82.
[https://doi.org/10.1007/BF01450244]
- Hwang, I.G., 1993, Fan-Delta Systems in the Pohang Basin (Miocene), SE Korea. Ph.D. thesis, Seoul National University, Seoul, 923 p.
-
Hwang, I.G., Chough, S.K., Hong, S.W. and Choe, M.Y., 1995, Controls and evolution of fan delta systems in the Miocene Pohang Basin, SE Korea. Sedimentary Geology, 98, 147-179.
[https://doi.org/10.1016/0037-0738(95)00031-3]
-
Hwang, I.G., Son, J. and Cho, S., 2021, Event stratigraphy of Yeonil Group, Pohang Basin : Based on correlation of 21 deep cores and outcrop sections. Journal of the Geological Society of Korea, 57, 649-678 (in Korean with English abstract).
[https://doi.org/10.14770/jgsk.2021.57.5.649]
-
Jelínek, V., 1981, Characterization of the magnetic fabric of rocks. Tectonophysics, 79, T63-T67.
[https://doi.org/10.1016/0040-1951(81)90110-4]
-
Joseph, L.H., Rea, D.K. and Van Der Pluijm, B.A., 1998, Use of grain size and magnetic fabric analyses to distinguish among depositional environments. Paleoceanography, 13, 491-501.
[https://doi.org/10.1029/98PA01939]
-
Kase, Y., Sato, M., Nishida, N., Ito, M., Mukti, M.M., Ikehara, K. and Takizawa, S., 2016, The use of microstructures for discriminating turbiditic and hemipelagic muds and mudstones (J. Baas, Ed.). Sedimentology, 63, 2066-2086.
[https://doi.org/10.1111/sed.12296]
-
Kneller, B.C. and McCaffrey, W.D., 2003, The Interpretation of Vertical Sequences in Turbidite Beds: The Influence of Longitudinal Flow Structure. Journal of Sedimentary Research, 73, 706-713.
[https://doi.org/10.1306/031103730706]
- Kim, I.-S., 1992, Origin and tectonic evolution of the East Sea (Sea of Japan) and the Yangsan fault system: A new synthetic interpretation. Journal of the Geological Society of Korea, 28, 84-109 (in Korean with English abstract).
-
Kim, J.M., 1999, Early Neogene biochemostratigraphy of Pohang Basin: a paleoceanographic response to the early opening of the Sea of Japan (East Sea). Marine Micropaleontology, 36, 269-290.
[https://doi.org/10.1016/S0377-8398(99)00006-7]
-
Kim, J.W. and Chough, S.K., 2000, A gravel lobe deposit in the prodelta of the Doumsan fan delta (Miocene), SE Korea. Sedimentary Geology, 130, 183-203.
[https://doi.org/10.1016/S0037-0738(99)00111-6]
-
Kurosawa, S., Furota, S., Mitsui, M., Sawada, K., Seike, K., Furukawa, N. and Ito, M., 2023, Downslope variation in hemipelagic sedimentation in an active margin basin: An example from the lower Pleistocene Kiwada and Takamizo formations on the Boso Peninsula, Japan. Sedimentology, 70, 705-727.
[https://doi.org/10.1111/sed.13055]
-
Mulder, T. and Alexander, J., 2001, The physical character of subaqueous sedimentary density flows and their deposits. Sedimentology, 48, 269-299.
[https://doi.org/10.1046/j.1365-3091.2001.00360.x]
-
Nagata, M., 1961, Complete reducibility of rational representations of a matric group. Journal of mathematics of Kyoto University, 1, 87-99.
[https://doi.org/10.1215/kjm/1250525107]
-
Novak, B., Housen, B., Kitamura, Y., Kanamatsu, T. and Kawamura, K., 2014, Magnetic fabric analyses as a method for determining sediment transport and deposition in deep sea sediments. Marine Geology, 356, 19-30.
[https://doi.org/10.1016/j.margeo.2013.12.001]
-
O’Brien, N.R., Nakazawa, K. and Tokuhashi, S., 1980, Use of clay fabric to distinguish turbiditic and hemipelagic siltstones and silts. Sedimentology, 27, 47-61.
[https://doi.org/10.1111/j.1365-3091.1980.tb01157.x]
-
Ochoa, J., Wolak, J. and Gardner, M.H., 2013, Recognition criteria for distinguishing between hemipelagic and pelagic mudrocks in the characterization of deep-water reservoir heterogeneity. AAPG Bulletin, 97, 1785-1803.
[https://doi.org/10.1306/04221312086]
-
Park, M.E., Cho, H., Son, M. and Sohn, Y.K., 2013, Depositional processes, paleoflow patterns, and evolution of a Miocene gravelly fan-delta system in SE Korea constrained by anisotropy of magnetic susceptibility analysis of interbedded mudrocks. Marine and Petroleum Geology, 48, 206-223.
[https://doi.org/10.1016/j.marpetgeo.2013.08.015]
-
Pickering, K., Stow, D., Watson, M. and Hiscott, R., 1986, Deep-water facies, processes and models: a review and classification scheme for modern and ancient sediments. Earth-Science Reviews, 23, 75-174.
[https://doi.org/10.1016/0012-8252(86)90001-2]
- Piper, D.J.W, 1978, Turbidites mud and silts on deep-sea fans and abyssal plains. In: Stanley, D.J., and Kelling, G., eds., Sedimentation in Submarine Canyons, Fans, and Trenches: Stroudsburg, Pennsylvania, Dowden, Hutchinson & Ross, 163-176.
-
Rees, A.I., 1966, The Effect of Depositional Slopes on the Anisotropy of Magnetic Susceptibility of Laboratory Deposited Sands. The Journal of Geology, 74, 856-867.
[https://doi.org/10.1086/627216]
- Reineck, H.E. and Singh, I.B., 2012, Depositional sedimentary environments: with reference to terrigenous clastics. Springer Science & Business Media, Berlin.
- Rice, D.D., 1993, Biogenic gas: controls, habitats, and resource potential. The Future of Energy Gases. USGS Professional Paper, U.S. Geological Survey, Reston, 1570, 583-606.
-
Rochette, P., 1988, Inverse magnetic fabric in carbonate-bearing rocks. Earth and Planetary Science Letters, 90, 229-237.
[https://doi.org/10.1016/0012-821X(88)90103-3]
-
Schieber, J., Southard, J. and Thaisen, K., 2007, Accretion of Mudstone Beds from Migrating Floccule Ripples. Science, 318, 1760-1763.
[https://doi.org/10.1126/science.1147001]
-
Sohn, Y.K. and Son, M., 2004, Synrift stratigraphic geometry in a transfer zone coarse-grained delta complex, Miocene Pohang Basin, SE Korea. Sedimentology, 51, 1389-1408.
[https://doi.org/10.1111/j.1365-3091.2004.00679.x]
-
Son, J., Cho, S. and Hwang, I.G., 2024, The Hakcheon-Chogok Megaturbidite in the Miocene Pohang-Youngduk Basin, SE Korea: high-gradient slope failure probably triggered by a giant tsunami wave. Geosciences Journal, 28, 301-318.
[https://doi.org/10.1007/s12303-024-0004-6]
- Son, M., Kim, J.-S., Chong, H.-T., Lee, Y.H. and Kim, I.S., 2007, Characteristics of the Cenozoic crustal deformation in SE Korea and their tectonic implications. Korean Journal of Petroleum Geology, 13, 1-16 (in Korean with English abstract).
-
Stacey, F.D., Joplin, G. and Lindsay, J., 1960, Magnetic anisotropy and fabric of some foliated rocks from S.E. Australia. Geofisica pura e applicata, 47, 30-40.
[https://doi.org/10.1007/BF01992481]
-
Stow, D.A. and Bowen, A.J., 1991, A physical model for the transport and sorting of fine-grained sediment by turbidity currents. Deep-Water Turbidite Systems, 25-40.
[https://doi.org/10.1002/9781444304473.ch2]
-
Stow, D. and Shanmugam, G., 1980, Sequence of structures in fine-grained turbidites: comparison of recent deep-sea and ancient flysch sediments. Sedimentary Geology, 25, 23-42.
[https://doi.org/10.1016/0037-0738(80)90052-4]
-
Stow, D. and Smillie, Z., 2020, Distinguishing between Deep-Water Sediment Facies: Turbidites, Contourites and Hemipelagite. Geosciences, 10, 68.
[https://doi.org/10.3390/geosciences10020068]
-
Stow, D. and Tabrez, A.R., 1998, Hemipelagites: processes, facies and model. Geological Society, London, Special Publications, 129, 317-337.
[https://doi.org/10.1144/GSL.SP.1998.129.01.19]
-
Stow, D. and Wetzel, A., 1990, Hemiturbidite: a new type of deep-water sediment. Proceedings of the Ocean Drilling Program, Scientific Results, 116, 25-34.
[https://doi.org/10.2973/odp.proc.sr.116.152.1990]
- Taira, A., 1989, Magnetic fabrics and depositional processes. Sedimentary facies in the active plate margin, 43-77.
-
Taira, A. and Scholle, P.A., 1979, Deposition of resedimented sandstone beds in the Pico Formation, Ventura Basin, California, as interpreted from magnetic fabric measurements. Geological Society of America Bulletin, 90, 952-962.
[https://doi.org/10.1130/0016-7606(1979)90<952:DORSBI>2.0.CO;2]
- Tarling, D.H. and Hrouda, F., 1993, Magnetic anisotropy of rocks. Springer Science & Business Media, 218 p.
-
Talling, P.J., Masson, D.G., Sumner, E.J. and Malgesini, G., 2012, Subaqueous sediment density flows: Depositional processes and deposit types. Sedimentology, 59, 1937-2003.
[https://doi.org/10.1111/j.1365-3091.2012.01353.x]
- Tauxe, L., 2005, Paleomagnetic principles and practice. Springer Science & Business Media, 301 p.
-
Watanabe, H. and Akiyama, M., 1998, Characterization of organic matter in the Miocene turbidites and hemipelagic mudstones in the Niigata oil field, central Japan. Organic Geochemistry, 29, 605-611.
[https://doi.org/10.1016/S0146-6380(98)00082-5]
-
Yawar, Z. and Schieber, J., 2017, On the origin of silt laminae in laminated shales. Sedimentary Geology, 360, 22-34.
[https://doi.org/10.1016/j.sedgeo.2017.09.001]
-
Yoon, S.H. and Chough, S.K., 1995, Regional strike slip in the eastern continental margin of Korea and its tectonic implications for the evolution of Ulleung Basin, East Sea (Sea of Japan). Geological Society of America Bulletin, 107, 83-97.
[https://doi.org/10.1130/0016-7606(1995)107<0083:RSSITE>2.3.CO;2]