Distributions of dissolved rare earth elements and anthropogenic gadolinium in the Yeongil Bay, Korea
Abstract
Recently, with the increasing demand for rare earth elements (REEs) in various high-tech industries, anthropogenic REEs has been released over the past few decades into the aquatic environments. Among the REEs, anthropogenic gadolinium (Gdanth) has been reported in urbanized areas as a result of magnetic resonance imaging (MRI). In this study, we collected water samples from the Yeongil Bay (YB), to investigate the distributions of dissolved REEs and Gdanth. The concentrations of dissolved REEs in the YB were gradually decreased as proximity to the sea. Significantly high concentrations of dissolved Gd (244.9 ± 100.6 pM, n = 3) were observed at riverside sampling sites, which were about 18 times higher than those at other sampling sites (13.7 ± 8.4 pM, n = 24). The Gd anomalies, which are defined by the ratio of the normalized measured concentration to theoretical concentration, also showed high values at riverside sampling sites (8.2 ± 3.1, n=3), whereas other sampling sites were < 1.4. The calculated Gdanth showed a negative correlation with the salinity, indicating that Gdanth from the Hyeongsan River may be conservatively mixed. Concentration of Gdanth at zero salinity were estimated as 869 pM by extrapolation. Our results indicate that a considerable amount of Gdanth is being discharged into the YB. Thus, mid- and/or long-term monitoring of Gdanth would be needed because it could be a major concern in the future.
초록
최근 다양한 첨단 산업에서 희토류 원소에 대한 수요가 증가함에 따라 수환경으로의 인위적 기원 희토류 원소의 배출 또한 증가하고 있다. 희토류 원소 중 가돌리늄(Gd)은 자기공명영상(MRI) 장비의 조영제로 사용되고 있으며, 이로 인해 도시화가 진행된 지역의 수환경의 경우 높은 농도의 인위적 기원 가돌리늄(Gdanth)이 보고되었다. 따라서 본 연구에서는 영일만에서 물시료를 채취하여 용존 희토류 원소 및 Gdanth의 농도분포를 조사하였다. 영일만에서의 용존 희토류 원소의 농도분포는 바다 쪽으로 갈수록 농도가 감소하는 경향이 나타났다. 특히 강 어귀부근 시료에서 얻어진 용존 Gd의 농도(244.9 ± 100.6 pM, n = 3)는 그 외 정점시료에서 얻어진 농도(13.7 ± 8.4 pM, n = 24)와 비교하여 약 18배 높게 나타났다. Gd anomaly 또한 강 어귀 시료에서 상대적으로 높은 값(8.2 ± 3.1, n=3)을 보였으며, 그 외 정점에서는 <1.4로 나타났다. 계산을 통해 얻어진 Gdanth의 농도와 염분 간의 음의 상관관계는 Gdanth이 형산강을 통해 영일만으로 배출되고, 해수와 보존적으로 혼합되고 있음을 시사한다. 염분과의 상관관계를 통해 추정된 강물에서의 Gdanth는 869 pM로 나타났으며, 이는 고농도의 Gdanth이 영일만으로 배출되고 있다는 것을 시사한다. 따라서 본 연구의 결과는 향후 수환경에서의 Gdanth에 대한 중장기적인 관측이 필요함을 시사한다.
Keywords:
rare earth elements, gadolinium, Yeongil Bay키워드:
희토류, 가돌리늄, 영일만1. Introduction
Rare Earth Elements (REEs) are composed of 15 elements of the lanthanum group (La, Ce, Pr, Nd, Pm, Sm, Eu, Gd, Tb, Dy, Ho, Er, Tm, Yb, and Lu) with atomic numbers from 57 to 71. REEs behave similarly in water environments because of trivalent oxidation in seawater, except for cerium (Ce4+) and europium (Eu2+) (Goldberg et al., 1963; Elderfield and Greaves, 1982). Recently, REEs have been used in several high-tech industries such as steel mills, wind turbines, electrical car engines, petroleum refining, mobile phones, displays, hi-capacity batteries etc. (Kulaksız and Bau, 2013; Massari and Ruberti, 2013). Thus, over the past few decades, there has been increase in demand for these goods, resulting in the artificial discharge of REEs into the aquatic environments.
Among the REEs, gadolinium (Gd) is used as a paramagnetic contrast-enhancing agent (e.g., Gd-(DTPA)2-) for magnetic resonance imaging (MRI) (Bau and Dulski, 1996a; Künnemeyer et al., 2009). Because of the high stability of these Gd compounds, they pass through the human body and the sewage system or wastewater treatment plant (WWTP) (Kulaksız and Bau, 2007), and are released into aquatic environments (or marine environment through the estuary), resulting in positive Gd anomaly which are defined by the ratio of the normalized measured concentration to theoretical concentration. Therefore, positive Gd anomalies have been utilized to trace the origins of anthropogenic substances (Bau and Dulski, 1996a; Möller et al., 2000; Hatje et al., 2016; Kim, T. et al., 2020). Positive Gd anomaly was first reported by (Bau and Dulski, 1996a), and previous studies demonstrated the enrichment of REEs with positive Gd anomalies in urbanized aquatic systems that include estuaries, bays, lakes, and rivers in the past few decades (Möller et al., 2000; Nozaki et al., 2000; Elbaz-Poulichet et al., 2002; Knappe et al., 2005; Kulaksız and Bau, 2007; Hatje et al., 2016; Song et al., 2017; Kim, I. et al., 2020; Kim, T. et al., 2020; Lim et al., 2023).
However, only a few studies have investigated ananthropogenic Gd (Gdanth) on aquatic environments in Korea (Song et al., 2017; Kim, I. et al., 2020; Kim, T. et al., 2020; Lim et al., 2023). Thus, in this study, we collected water samples from the Yeongil Bay, Korea (YB) to investigate the distributions of dissolved REEs and Gdanth. This study region was selected based on the high discharge probability of anthropogenic REEs into aquatic environment due to the surrounding highly urbanized areas. Furthermore, using Gd anomalies, concentrations of Gdanth have been evaluated quantitatively.
2. Materials and methods
2.1 Study region
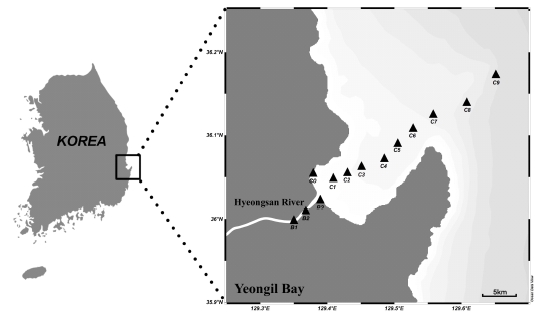
The YB, which is surrounded by Pohang (~0.5 million population) locating on the eastern coast of Korea, has semi-closed topographical characteristics that are indented in the land direction (Fig. 1). YB is 10 km wide and 12 km long with an area of approximately 120 km2. The annual amount of freshwater discharge from the Hyeongsan River, which is discharged into YB, is approximately 6 × 10⁸ m3 (Lee et al., 2003). YB is considered to be one of the Korea’s most industrialized regions because of the presence of several industrialized complexes including large-scale steel mill complexes. Therefore, approximately 300,000 m3 d-1 of industrial and municipal wastewater discharge through the Hyeongsan River or directly into the bay (Koh et al., 2006).
2.2 Sampling
Water samples (n = 27) were collected from YB in March 2022 during the research cruise of R/V NARA (Fig. 1). Water samples were collected using an acid-cleaned Teflon-coated Niskin-X sampler (1.7 L; General Oceanics), which were clamped one by one on a Kevlar rope (6.3 mm diameter, Pelican Rope) and triggered with Teflon-coated messengers. For subsampling, Niskin-X samplers were detached from the Kevlar rope, and carefully moved into a clean bench (filled with air which was passed through an HEPA filter) in the onboard laboratory of the research vessel. Water samples were filtered using an acid-cleaned 0.2 μm Acropak capsule filter (PALL) that directly connected to the Niskin-X Teflon spigot, and the filtered samples were stored in acid-cleaned 125 mL LDPE bottles after rinsing three times using filtered sample. The samples were subsequently acidified to a pH < 1.8 using a HCl (final HCl concentrations = 0.01 M; Ultra-High Pure Grade, ODLAB) and stored in clean plastic zip-lock bags until analysis. Temperature and salinity were measured onboard using a portable meter (ORION Star A320; Thermo Fisher).
2.3 Sample preparation and rare earth elements (REEs) analysis
To determine the concentrations of dissolved REEs in water samples, an automated preconcentration system (seaFAST, ESI) has been utilized (Seo and Kim, 2020). Because the seaFAST system was connected to a high-resolution inductively coupled plasma mass spectrometry (HR-ICP-MS; Thermo Element 2, Thermo Scientific), the eluent was directly introduced into the spray chamber of the HR-ICP-MS and analyzed. The concentrations of dissolved REEs were determined using an external standard curve created by diluting the standard solution. The internal standard 103Rh was used to normalize the intensity variations for each sample. The procedural blank value for Nd was 0.36 ± 0.14 pM, while those for the other elements were <0.07 pM (n = 7). The detection limit (3σ) of Nd is 0.42 pM, whereas those of the other elements are <0.13 pM. To assess the accuracy of the analytical procedure, certified reference samples (CRMs; SLEW-3 and CASS-6, National Research Council of Canada) were determined. The values measured using this method were consistent with those reported in previous studies for all REEs (92 - 102%) (Kim, T. et al., 2020; Chen et al., 2022).
3. Results and discussions
3.1 Distribution of dissolved REEs concentrations
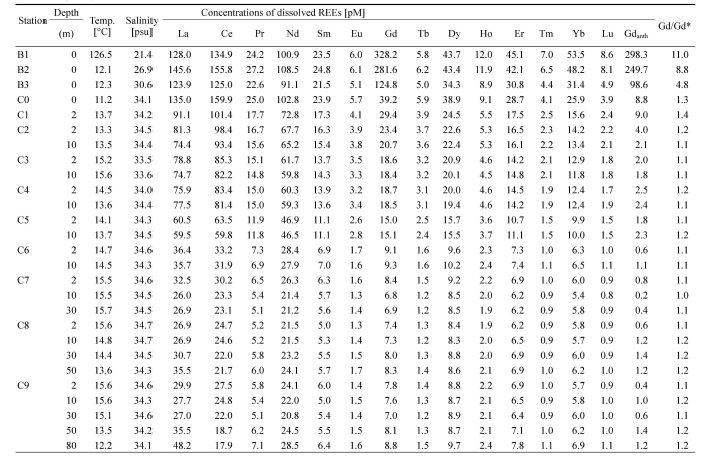
Water temperatures and salinity obtained in YB ranged from 11.2 to 15.7 ℃ and 21.4 to 34.7, respectively. Even though salinity values increased from the inner bay to costal sea, the high salinities (21.4-30.6) at riverside sampling sites (from B1 to B3) indicate that seawater can easily enter the river through the bay (Table 1).

The concentrations of dissolved REEs (pM) with temperature, salinity, Gdanomaly (Gd/Gd*), and estimated concentrations of anthropogenic Gd (Gdanth) in the Yeongil Bay.
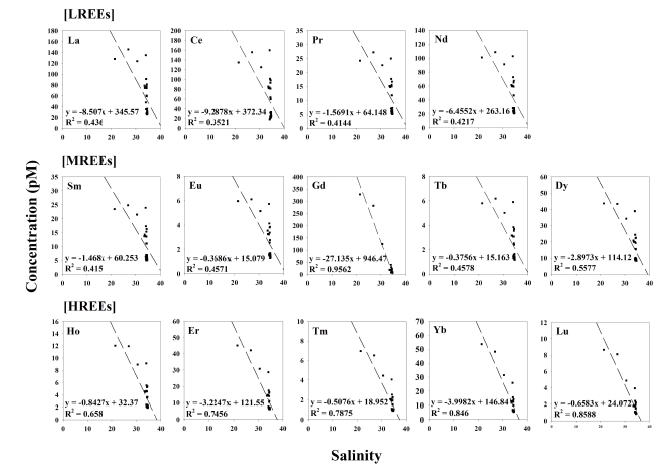
The concentration of dissolved REEs in YB varied by one to two orders of magnitude, for example from 20.8 to 102.8 pM for Nd and from 0.8 to 8.6 pM for Lu. Significantly high concentrations dissolved Gd (244.9 ± 100.6 pM, n = 3) were observed at riverside sampling sites (from B1 to B3), which were about 18 times higher than those at other sampling sites (13.7 ± 8.4 pM, n = 24). In general, the concentration of dissolved REEs showed decreasing trends from the riverside to outer bay (Table 1). In addition, the dissolved REEs concentrations showed negative correlations with salinity (Fig. 2). Previous studies showed the dissolved REEs losses in the low-salinity region of estuaries by salt-induced coagulation of river-borne colloids and adsorption onto particles and sediments in the order of light REEs (LREEs; from La to Nd) > middle REEs (MREEs; from Sm to Dy) > heavy REEs (HREEs; from Ho to Lu) (Sholkovitz, 1993; Kulaksız and Bau, 2007). In this study, however, significant losses of dissolved REEs were not observed (Fig. 2). This could be partly due to lack of data from the low-salinity region (0.0-21.4).
3.2 Shale-normalized REEs patterns
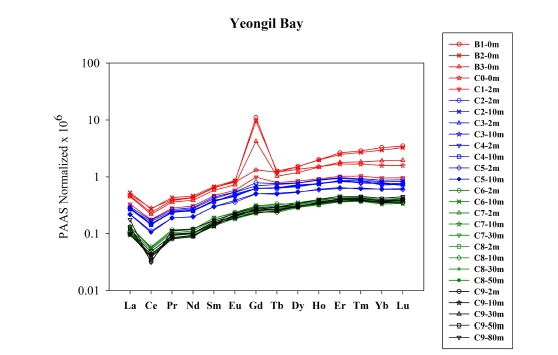
The post-Archean average Australian shale (PAAS)-normalized REEs patterns (McLennan, 1989) are presented in Fig. 3 to eliminate the Oddo–Harkins effect in natural abundances, allowing easy comparison with other REEs data (Migaszewski and Gałuszka, 2015). Generally, all sampling sites show HREEs enrichment relative to LREEs. This pattern could reflect the preferential scavenging of LREEs from river water in the low-salinity region via coagulation, aggregation, and sedimentation of the river colloids as freshwater mixes with seawater (Sholkovitz, 1993; Kulaksız and Bau, 2007). The patterns along the YB could be represented by two different pools: (1) riverside sampling sites (from B1 to B3), where show significantly high Gd concentrations (244.9 ± 100.6 pM, n = 3), (2) bay sampling sites (from C0 to C9) where relatively low Gd concentrations were obtained (13.7 ± 8.4 pM, n = 24) (Table 1; Fig. 3). Bay sampling sites showed patterns similar to those observed in outermost sampling sites (C9) rather than riverside sampling sites, indicating that most of sampling sites are influenced by seawater rather than river water as indicating by salinity.
3.3 Gd anomaly and anthropogenic Gd
In this study, positive Gd anomalies were clearly observed at riverside sampling sites (from B1 to B3) (Fig. 3). The Gd anomaly (Gd/Gd*) was calculated using the following equation (Bau and Dulski, 1996a):
| (1) |
where subscript SN indicates PAAS normalized value of the REEs concentration, and superscript * denotes the geogenic background interpolated between neighboring elements. Regardless of normalization, the occurrence of a minor positive Gd anomaly (< 1.4) is frequently observed due to "tetrad effect", resulting from the half-filled 4f electron in its orbital shell (e.g., Bau and Dulski, 1996b; Alibo and Nozaki, 1999).
In this study, throughout the YB, calculated Gd anomaly (Gd/Gd*) values range from 1.0 to 11.0 (1.9 ± 2.42, n = 27) (Table 1). We observed distinctive anthropogenic Gd anomalies (8.2 ± 3.1, n = 3) at the riverside sampling sites (from B1 to B3). The major cause of these anomalies can be attributed to the significant input of refractory Gd-based contrast agents, such as Gd-DTPA, originating from MRI examinations (Bau and Dulski, 1996a; Möller et al., 2000; Bau et al., 2006). These Gd anomalies are comparable to those previously reported in Han River (4.3 ± 2.5, n = 6) and Elbe, Ems, and Weser River (4.8 ± 0.9, n = 3) (Kulaksız and Bau, 2007; Song et al., 2017), while those are relatively low compared to those in Wupper, Spree, and Havel River (56.1 ± 49.9, n = 3) and Rhine River (22.5 ± 29.3, n = 14) (Bau and Dulski, 1996a; Kulaksız and Bau, 2011).
To investigate the influence of Gdanth in YB, Gdanth concentrations were calculated as follows (Kulaksız and Bau, 2013):
| (2) |
| (3) |
where Gdmeasured indicates the measured dissolved Gd concentration.
In the YB, the Gdanth concentrations suddenly decreased toward the outer bay. The calculated Gdanth concentrations varied by two orders magnitude, which ranged from 0.2 to 298.3 (25.7 ± 74.2 pM, n = 27) (Table 1). High concentrations of Gdanth (215.5 ± 104.1 pM, n = 3) were obtained at the riverside sampling sites (from B1 to B3). This concentration level is significantly high compared to that obtained in the Han River (80 ± 65.1 pM, n = 6) (Song et al., 2017), the Suyeong River (103.6 ± 56.0 pM, n = 36) (Lim et al., 2023), and the San Francisco Bay (33.8 ± 40.0 pM, n = 8) (Hatje et al., 2016). On the other hand, significantly low concentrations of Gdanth (2.0 ± 2.3 pM, n = 24) were calculated at bay sampling sites (from C0 to C9) (Table 1). Therefore, these results clearly suggest that Gdanth from the Hyeongsan River were already diluted by mixing with seawater in YB.
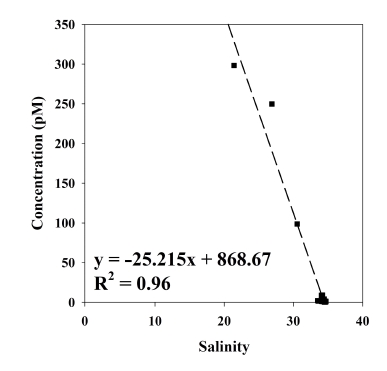
In this study, a negative correlation (R2 = 0.96) between Gdanth and salinity was observed (Fig. 4). Previous study in the Suyeong River also showed this negative correlation and suggested that Gdanth would be conservatively mixed owing to their high stability (Lim et al., 2023). If we assume that Gdanth in YB is conservatively mixed with seawater, the Gdanth could be estimated by extrapolation from the linear relationship between Gdanth and salinity. Therefore, Gdanth at zero salinity could be estimated as 869 pM (Fig. 4), which is significantly high compared to previous studies as we referred above. Otherwise, Gdanth could be discharged from a certain source that is located near riverside sampling sites, where salinity ranges from 21.4 to 30.6 (Table 1). Owing to the limited data, our Gdanth estimation in YB is only a rough estimate. Nonetheless, our estimation suggests that high concentrations of Gdanth in YB will be a major concern in the future.
4. Conclusion
We investigated dissolved REEs distribution along the YB, which is surrounded by highly urbanized region. The concentrations of dissolved REEs were gradually decreased from riverside to outer bay and generally showed inverse correlations with salinity. The PAAS- normalized REEs patterns show HREEs enrichment relative to LREEs, reflecting the preferential scavenging of LREEs. Positive Gd anomalies were clearly observed at riverside sampling sites (from B1 to B3), suggesting the significant input of Gdanth from the Hyeongsan River. Calculated Gdanth concentrations showed a sudden decrease toward the outer bay, suggesting that Gdanth from Hyeongsan River were already diluted by mixing with seawater in YB. Even though data are limited, our results suggest that high concentration level of Gdanth in YB could be a major concern. Therefore, mid- and/or long-term monitoring of Gdanth is required to further solidify this conclusion.
Acknowledgments
This work was supported by a Research Grant of Pukyong National University (2023). We are thankful to the anonymous reviewers for their useful comments that helped to improve the manuscript.
References
-
Alibo, D.S. and Nozaki, Y., 1999, Rare earth elements in seawater: particle association, shale-normalization, and Ce oxidation. Geochimica et cosmochimica acta, 63, 363-372.
[https://doi.org/10.1016/S0016-7037(98)00279-8]

-
Bau, M. and Dulski, P., 1996a, Anthropogenic origin of positive gadolinium anomalies in river waters. Earth and Planetary Science Letters, 143, 245-255.
[https://doi.org/10.1016/0012-821X(96)00127-6]

-
Bau, M. and Dulski, P., 1996b, Distribution of yttrium and rare-earth elements in the Penge and Kuruman iron-formations, Transvaal Supergroup, South Africa. Precambrian Research, 79, 37-55.
[https://doi.org/10.1016/0301-9268(95)00087-9]

-
Bau, M., Knappe, A. and Dulski, P., 2006, Anthropogenic gadolinium as a micropollutant in river waters in Pennsylvania and in Lake Erie, northeastern United States. Geochemistry, 66, 143-152.
[https://doi.org/10.1016/j.chemer.2006.01.002]

-
Chen, X., Kwon, H.K., Joung, D., Baek, C., Park, T.G., Son, M. and Kim, G., 2022, Role of terrestrial versus marine sources of humic dissolved organic matter on the behaviors of trace elements in seawater. Geochimica et Cosmochimica Acta, 333, 333-346.
[https://doi.org/10.1016/j.gca.2022.07.025]

-
Elbaz-Poulichet, F., Seidel, J.L. and Othoniel, C., 2002, Occurrence of an anthropogenic gadolinium anomaly in river and coastal waters of Southern France. Water research, 36, 1102-1105.
[https://doi.org/10.1016/S0043-1354(01)00370-0]

-
Elderfield, H. and Greaves, M.J., 1982, The rare earth elements in seawater. Nature, 296, 214-219.
[https://doi.org/10.1038/296214a0]

-
Goldberg, E.D., Koide, M., Schmitt, R.A. and Smith, R.H., 1963, Rare‐ Earth distributions in the marine environment. Journal of Geophysical Research, 68, 4209-4217.
[https://doi.org/10.1029/JZ068i014p04209]

-
Hatje, V., Bruland, K.W. and Flegal, A.R., 2016, Increases in anthropogenic gadolinium anomalies and rare earth element concentrations in San Francisco Bay over a 20 year record. Environmental science & technology, 50, 4159-4168.
[https://doi.org/10.1021/acs.est.5b04322]

-
Kim, I., Kim, S.H. and Kim, G., 2020, Anthropogenic gadolinium in lakes and rivers near metrocities in Korea. Environmental Science: Processes & Impacts, 22, 144-151.
[https://doi.org/10.1039/C9EM00304E]

-
Kim, T., Kim, H. and Kim, G., 2020, Tracing river water versus wastewater sources of trace elements using rare earth elements in the Nakdong River estuarine waters. Marine Pollution Bulletin, 160, 111589.
[https://doi.org/10.1016/j.marpolbul.2020.111589]

-
Knappe, A., Möller, P., Dulski, P. and Pekdeger, A., 2005, Positive gadolinium anomaly in surface water and ground water of the urban area Berlin, Germany. Geochemistry, 65, 167-189.
[https://doi.org/10.1016/j.chemer.2004.08.004]

-
Koh, C.H., Khim, J.S., Villeneuve, D.L., Kannan, K. and Giesy, J.P., 2006, Characterization of trace organic contaminants in marine sediment from Yeongil Bay, Korea: 1. Instrumental analyses. Environmental pollution, 142, 39-47.
[https://doi.org/10.1016/j.envpol.2005.09.005]

-
Kulaksız, S. and Bau, M., 2007, Contrasting behaviour of anthropogenic gadolinium and natural rare earth elements in estuaries and the gadolinium input into the North Sea. Earth and Planetary Science Letters, 260, 361-371.
[https://doi.org/10.1016/j.epsl.2007.06.016]

-
Kulaksız, S. and Bau, M., 2011, Rare earth elements in the Rhine River, Germany: first case of anthropogenic lanthanum as a dissolved microcontaminant in the hydrosphere. Environment international, 37, 973-979.
[https://doi.org/10.1016/j.envint.2011.02.018]

-
Kulaksız, S. and Bau, M., 2013, Anthropogenic dissolved and colloid/nanoparticle-bound samarium, lanthanum and gadolinium in the Rhine River and the impending destruction of the natural rare earth element distribution in rivers. Earth and Planetary Science Letters, 362, 43-50.
[https://doi.org/10.1016/j.epsl.2012.11.033]

-
Künnemeyer, J., Terborg, L., Meermann, B., Brauckmann, C., Möller, I., Scheffer, A. and Karst, U., 2009, Speciation analysis of gadolinium chelates in hospital effluents and wastewater treatment plant sewage by a novel HILIC/ICP-MS method. Environmental science & technology, 43, 2884-2890.
[https://doi.org/10.1021/es803278n]

- Lee, M.G., Im, D.I., Eom, I.G., Sin, E.B. and Jeong, H.S., 2003, Seasonal variation and spatial distribution of water qualities in Youngil Bay, southeast coast of Korea. Journal of Korean Society of Environmental Engineers, 25, 898-908 (in Korean with English abstract).
-
Lim, I., Sun, C., Lee, J.H., Kim, J., Lee, S., Sim, H., Cho, H.-M., Ryu, J.-S. and Kim, T., 2023, Seasonal variations of dissolved rare earth elements and anthropogenic gadolinium in the highly urbanized river basin, Busan, Korea. Estuarine, Coastal and Shelf Science, 108359.
[https://doi.org/10.1016/j.ecss.2023.108359]

-
Massari, S. and Ruberti, M., 2013, Rare earth elements as critical raw materials: Focus on international markets and future strategies. Resources Policy, 38, 36-43.
[https://doi.org/10.1016/j.resourpol.2012.07.001]

-
McLennan, S.M., 1989, Rare earth elements in sedimentary rocks; influence of provenance and sedimentary processes. Reviews in Mineralogy & Geochemistry, 21, 169-200.
[https://doi.org/10.1515/9781501509032-010]

-
Migaszewski, Z.M. and Gałuszka, A., 2015, The characteristics, occurrence, and geochemical behavior of rare earth elements in the environment: a review. Critical reviews in environmental science and technology, 45, 429-471.
[https://doi.org/10.1080/10643389.2013.866622]

-
Möeller, P., Dulski, P., Bau, M., Knappe, A., Pekdeger, A. and Sommer-von Jarmersted, C., 2000, Anthropogenic gadolinium as a conservative tracer in hydrology. Journal of Geochemical Exploration, 69, 409-414.
[https://doi.org/10.1016/S0375-6742(00)00083-2]

-
Nozaki, Y., Lerche, D., Alibo, D.S. and Tsutsumi, M., 2000, Dissolved indium and rare earth elements in three Japanese rivers and Tokyo Bay: Evidence for anthropogenic Gd and In. Geochimica et Cosmochimica Acta, 64, 3975-3982.
[https://doi.org/10.1016/S0016-7037(00)00472-5]

-
Seo, H. and Kim, G., 2020, Rare earth elements in the East Sea (Japan Sea): distributions, behaviors, and applications. Geochimica et Cosmochimica Acta, 286, 19-28.
[https://doi.org/10.1016/j.gca.2020.07.016]

-
Sholkovitz, E.R. 1993, The geochemistry of rare earth elements in the Amazon River estuary. Geochimica et Cosmochimica Acta, 57, 2181-2190.
[https://doi.org/10.1016/0016-7037(93)90559-F]

-
Song, H., Shin, W.J., Ryu, J.S., Shin, H.S., Chung, H. and Lee, K.S., 2017, Anthropogenic rare earth elements and their spatial distributions in the Han River, South Korea. Chemosphere, 172, 155-165.
[https://doi.org/10.1016/j.chemosphere.2016.12.135]


