퀴리점 열분해장치와 전처리 자동화를 통한 다중 황 동위원소 분석

초록
황화물(-II)에서 황산염(VI)에 이르는 다양한 산화상태로 황은 지질 및 생물 반응에 폭넓게 참여하며, 이 과정에서 발생하는 황 동위원소 분별작용은 과거와 현재의 황 순환 이해에 효과적인 도구로 이용된다. 황의 네 안정 동위원소(32S, 33S, 34S, 36S)를 모두 분석하기 위해서는 황 시료를 육불화황(SF6)으로 변환하는 과정이 요구되는데, 불화설비 제작과 운영이 까다롭고 시료 처리에 다소 긴 시간이 요구되어 국내에서는 아직까지 관련 분석 사례가 보고되지 않았다. 이번 연구에서는 서울대학교 지구환경과학부에서 운영 중인 고감도 동위원소비율 질량분석기, 퀴리점 열 분해장치, 그리고 자체 제작한 육불화황 처리설비를 이용해 다중 황 동위원소 분석을 진행하였다. 황화은(Ag2S)으로 준비된 시료의 불화과정에는 유독한 불소(F2) 가스 대신 비교적 안전한 고체인 삼불화코발트(CoF3)를 이용하였으며 자동화된 시료 전처리 설비를 통해 정제된 후 동위원소 분석에 이용되었다. 육불화황 형성율은 전통적인 불화방법에 비해 비교적 낮은 편이지만 표준물질 분석결과는 보고된 값들과 오차범위 내에서 일치하였고, δ34S, Δ33S와 Δ36S의 분석 재현성(2σ)은 각각 0.33‰, 0.022‰과 0.24‰로서 다중 황 동위원소 연구에 충분한 수준을 보였다. 다만, 육불화황의 양이 1 µmol 보다 적은 경우 Δ36S 분석의 정확도가 떨어지는 현상이 일부 확인되었다. 다중 황 동위원소 분석이 국내에서 가능해짐에 따라, Δ33S와 Δ36S가 수 퍼밀에 이르는 비질량종속 분별작용은 물론 다중 황 동위원소 비율의 미세한 변화를 이용한 연구도 활발해질 것으로 기대된다.
Abstract
Sulfur is a versatile element with various redox states, which makes it a key component in both geological and biological worlds. Geobiological reactions involving sulfur often lead to isotope fractionation of its four isotopes, making their relative abundance as a major clue to understand the past and the current sulfur cycle. With the advent of a high-resolution isotope ratio mass spectrometer (IRMS), analyzing all four isotopes of sulfur became possible using SF6 as a sample gas. However, such method has never been conducted in South Korea due to its complexity and hazardousness. Here, we show an instant synthesis and analysis of SF6 using a Curie-point Pyrolyzer and an IRMS MAT 253 Plus installed in the School of Earth and Environmental Sciences at Seoul National University. CoF3, which is less hazardous than F2, was used as a fluorinating agent. In addition, an automated gas line for purifying SF6 was constructed and connected between the pyrolyzer and MAT 253 Plus. While the SF6 yield rate is relatively lower than that of the traditional method, our analysis with IAEA standards shows sufficient reproducibility (2σ) of 0.33‰, 0.022‰, and 0.24‰ for δ34S, Δ33S, and Δ36S, respectively. Our results also agree well with other reported values obtained from similar SF6 methods within errors, but measuring SF6 below 1 μmol generally decreases the accuracy of the results. Overall, our new SF6 analysis methodology can allow in-depth analysis in South Korea not only on the deviations of sulfur isotope ratios from their mass-dependent relationships by a few permil, but also on subtle variations in the minor sulfur isotope ratios.
Keywords:
multiple sulfur isotopes, fluorination reaction, Curie-point Pyrolyzer, IRMS키워드:
다중 황 동위원소, 불화반응, 퀴리점 열분해장치, 고감도 동위원소비율 질량분석기1. 서 론
황은 넓은 범위의 산화상태(-II~VI)를 지니며 이를 기반으로 하는 산화환원 반응은 지구물질 순환에 중요한 역할을 담당한다. 황의 안정 동위원소는 32S (95%), 33S (0.75%), 34S (4.2%)와 36S (0.017%)의 네 가지가 있으며 황을 포함하고 있는 물질의 동위원소 비율은 다양한 반응을 통해 변화하기 때문에 황 동위원소 비율을 분석하고 추적함으로써 황의 생지구화학적 거동에 대한 정보를 얻을 수 있다. 황 안정 동위원소 연구는 1950년대부터 미생물 대사작용을 비롯한 다양한 화학반응을 대상으로 34S/32S 동위원소 분별작용이 중심이 되어 진행되어 왔다. 하지만 2000년대 초에 시생누대의 퇴적암에서 질량종속 분별작용과는 크게 벗어나는 비질량종속 다중 황 동위원소 분별작용이 보고된 이후(Farquhar et al., 2000), 미량으로 분포하는 33S와 36S에 대한 연구 또한 많은 관심을 끌게 되었으며 특히 시생누대의 황 순환에 대한 연구가 활발하게 이루어졌다(Mojzsis et al., 2003; Ono et al., 2003; Savarino et al., 2003). 최근에는 분석방법의 정밀도가 높아짐에 따라 황산염 환원세균이 남기는 미세한 미량 황 질량종속 분별작용도 추적하는 연구 등(Aoyama and Ueno, 2018) 그 응용범위가 확대되고 있다.
지질 및 환경시료의 황 동위원소 분석법은 시료의 특성에 따른 다양한 전처리 방법과 정밀한 질량분석기의 개발을 통해 꾸준히 발전해 왔다. 황 동위원소 연구는 전통적으로 기체시료를 분석하는 질량분석기(gas-source IRMS)를 이용해왔으며, 일반적으로 시료를 이산화황(SO2) 또는 육불화황(SF6)과 같은 기체 형태로 변환시키는 전처리 과정이 요구된다. 이산화황으로의 변환과 동위원소 분석은 상용화된 장비의 보급으로 인해 황 동위원소 연구에 광범위하게 이용되고 있으며, 34S/32S를 0.2‰ 수준의 정확도로 측정할 수 있다(Rees et al., 1978). 하지만, 이산화황 내 산소 동위원소의 영향을 보정하는 과정 때문에 미량 동위원소인 33S와 36S의 정밀한 분석은 기대하기는 어렵다(Rees et al., 1978). 반면에 SF6를 구성하는 불소는 동위원소가 없기 때문에 다른 동위원소들의 간섭 없이 미량으로 존재하는 33S와 36S을 분석할 수 있다(Hulston and Thode, 1965). 이러한 장점에도 불구하고 SF6를 만드는 과정에 소요되는 시간과 인력, 유독성 물질인 불소(F2)를 이용해야 되는 이유로 SF6를 이용한 분석은 황 동위원소 연구에 특화되어 있는 소수의 실험실에서만 이용되고 있다.
최근에는 SF6 형성을 위한 불화과정에 기체인 불소가 아닌 비교적 더 안전한 고체인 삼불화코발트(CoF3)를 이용하는 방법이 보고 되었는데, 일반적으로 시료를 300℃에서 3시간 이상 가열하는 F2를 이용한 전처리와는 달리 퀴리점 열분해장치(Curie-point pyrolyzer)를 이용함으로써 불화과정에 요구되는 시간을 수 초 수준으로 크게 단축시켰다(Ueno et al., 2015). CoF3는 이전부터 F2를 대체할 수 있는 불화물질로 주목을 받아왔으며, 지구화학적 연구로는 물(Baker et al., 2002; Barkan and Luz, 2005)과 이산화 규소(Menicucci et al., 2013)의 산소 동위원소를 측정하기 위해 이용된 사례가 있다. Ueno et al. (2015)는 CoF3를 이용하여 황화은(Ag2S)을 SF6로 변환시켰고 이때 반응식은 이론적으로 아래와 같다.
열분해장치는 주로 유기물 분석을 위해 개발되었으며 전통적으로는 기체크로마토그래피 질량분석기(Gas chromatography mass spectrometry)에 연결하여 이용되어 왔다(Oguri et al., 2013). 열분해장치의 기본 원리는 유도가열(induction heating)과 비슷하며, 철이나 니켈 등 다양한 비율의 합금으로 만들어진 파이로포일(Pyrofoil, Japan Analytical Industry, Tokyo, Japan)에 포장된 시료는 전기장으로 유도된 자기장에 의해 자극의 방향이 빠르게 변화하면서 파이로포일의 큐리 온도에 도달하게 된다(Oguri et al., 2013). 반응 온도는 파이로포일의 재질에 의해 결정되며 현재까지는 약 160℃부터 1040℃ 사이에서 21가지의 파이로포일을 이용할 수 있다.
국내 황 동위원소 연구는 원소분석기(elemental analyzer)를 이용한 황산염(SO42-)의 황과 산소 동위원소 분석이 보고되었으며(Kim et al., 2017), 최근에는 나노 몰 수준의 황 시료를 분석할 수 있는 다검출기 유도결합 플라즈마 질량분석기(MC-ICP-MS)가 서울대학교 공동기기원에 구축되어 SO42- 형태인 황 시료의 34S/32S와 33S/32S를 높은 수준의 재현성으로 측정할 수 있게 되었다(Moon et al., 2021). 하지만 SF6 기반의 분석과 비교하면 아직 33S/32S 결과에 다소 큰 오차를 보여 질량종속 분별작용(mass dependent fractionation) 간의 미세한 차이로 인한 변화를 확인하는데 한계가 있고, 아르곤(36Ar+)의 동중이온 간섭으로 36S는 MC-ICP-MS를 이용한 분석이 불가능 하다. 아직까지 국내에서는 SF6를 이용한 황 동위원소 분석사례는 없지만, 정밀한 다중 황 동위원소 분석에 대한 요구가 계속 높아지고 있는 상황으로, 본 연구에서는 서울대학교 지구환경과학부에 설치된 MAT 253 Plus IRMS를 기반으로 퀴리점 열분해장치로 형성된 SF6를 이용한 다중 황 동위원소 분석방법을 구축하고자 하였다.
2. 실험 방법
2.1 열분해장치를 이용한 불화반응
불화반응은 JHP-5 퀴리점 열분해장치(Japan Analytical Industry, Tokyo, Japan)를 이용하여 진행되었다. 각 단계별 실험과정은 그림 1과 같다. 먼저 황 시료인 Ag2S를 590℃로 가열되는 파이로포일에 불화물질인 CoF3 (99% Alfa Aeser)와 함께 감싸서 준비한다(Ueno et al., 2015). 이때, SF6 형성율은 고체 분말인 CoF3와 Ag2S의 접촉 면적에 의해서 결정되므로(Ueno et al., 2015) 효과적인 불화과정을 위해 CoF3는 Ag2S 보다 10배 이상의 양으로 핀셋을 이용해 충분히 시료와 혼합하였다. CoF3는 높은 흡습성을 갖고 있으며 공기중에서 노출된 CoF3는 황토색에서 몇 분 후 갈색으로 변하며 불화 수소(HF)를 발생시킬 수 있으므로 진공 데시케이터에 보관하였고, 시료의 포장은 항온항습기를 이용하여 50%이하의 습도를 유지한 환경에서 보안경과 마스크를 착용한 실험자에 의해 2분 이내에 신속하게 이루어졌다. 준비된 시료는 ¼ 인치 외경의 석영관에 넣어 전처리 설비의 말단에 장착하고 진공상태를 만든 뒤, 시료가 들어가 있는 석영튜브 부분을 JHP-5에 장착하여 열분해를 5초 동안 진행하였다.

Schematic diagram of the SF6 synthesis process and purification line. Simple diagram at the bottom shows the amount of time required for each purification step. The picture on the right shows the actual SF6 line built at SNU Geomicrobiology Lab. Numbers listed on the picture and the diagram represent the position of each compartments of the purification line.
열분해를 통해 만들어진 SF6의 정화를 위해 극저온 트랩과 기체크로마토그래피(TCD Educational Model, SRI, Los Angeles, CA, USA)를 갖추고 있는 진공 전처리설비를 공압 밸브를 이용하여 제작하였으며(그림 1), 밸브 및 트랩 조작의 대부분은 LabVIEW 소프트웨어(National Instruments, Austin, TX, USA)를 통해 자동화하였다. 첫 번째 트랩은 액체질소(-196℃)트랩이며 비응축성가스(예: 질소와 산소 등)를 제거하기 위해서 약 10분 동안 이용하였고 다음으로는 10분 동안 메탄올 저온 트랩(-90℃)을 통과시켜 SF6가 아닌 다른 응축성가스(예: 불화 수소)를 제거하였다. 잔류 SF6는 기체 크로마토그래피를 이용한 마지막 정화단계를 걸쳤으며, 불순물이 제거된 SF6를 CDG-500 진공압력계(Agilent)를 이용하여 압력을 측정하고 가스시료의 양을 계산하였다. 기체 크로마토그래피 단계에서는 4 m의 Porapak Q (1/8 OD, 80-100 mesh, Restek, Bellefonte, PA, USA)과 3미터의 Molecular Sieve 5A (1/8 OD, 80-100 mesh, Restek, Bellefonte, PA, USA) 컬럼이 사용되었으며, 두 컬럼의 온도는 50℃로 설정되었다. 운반기체로는 He (>99.999%)이 사용되었으며 유량은 25 mL/min로 유지하였다.
2.2 황 동위원소 분석
정화된 SF6 시료는 MAT253 Plus dual-inlet 질량분석기의 샘플 벨로우 쪽에 주입되었으며 자체 표준물질로 삼은 고순도 SF6 (>99.99%)를 표준 벨로우에 넣어 질량 127 (32SF5+), 128 (33SF5+), 129 (34SF5+)와 131 (36SF5+)의 신호를 교차 측정하였다. 측정된 황 동위원소 조성은 국제 표준물질인 Vienna-Canon Diablo Troilite (VCDT)를 기준으로 델타 표시법(δ-notation)을 적용해 보고하였다.
미량 다중 황 동위원소 표시법은 일반적으로 δ33S 와 δ36S 값이 평균적인 질량 종속 분별작용 상관관계에서 벗어난 정도를 이용해 Δ33S와 Δ36S으로 표기하며, 이번 연구에서는 다음과 같은 식들로 Δ33S 그리고 Δ36S를 보고 하였다(Ueno et al., 2015).
자체 표준물질의 황 동위원소 조성은 공인된 Ag2S 표준물질인 IAEA-S1의 보고된 값을(δ34S = -0.3‰, Δ33S = 0.094‰, and Δ36S = -0.7‰; Geng et al., 2019) 이용하여 측정했으며, 자체 표준물질을 이용한 분석의 정확도는 또 다른 Ag2S 표준물질인 IAEA-S2의 동위원소 조성을 자체 표준물질을 기준으로 평가하였다. 현재 IAEA-S2의 동위원소 조성은 δ34S에 대해서만 표준화가 이뤄져 있으며 (δ34S = -22.62‰; Ding et al., 2001), Δ33S와 Δ36S는 앞선 개별 연구에서 보고된 값들과 비교하였다.
2.3 열분해 조건 최적화
Ueno et al. (2015)는 SF6 형성과 분석의 최적화를 위하여 열분해 온도와 반응시간에 따른 SF6의 형성율과 동위원소 분석의 정확성과 재현성 변화를 확인하고, 온도는 590℃에서 수 초 동안 반응시키는 것이 가장 최적화된 분석 조건으로 보고하였다. 이번 연구에서는 효과적인 분석을 위해 반응시간을 5초 이내로 유지하면서, 앞서 제안된 590℃가 본 실험 조건에서도 최적의 반응 온도에 해당하는지 445℃, 590℃, 670℃와 764℃의 총 네 가지 온도에서 IAEA-S1와 S2를 이용해 SF6의 형성율과 분석 결과를 확인하였다. 또한, SF6의 양이 분석 결과에 미치는 영향을 시험하기 위해 시중에서 구입할 수 있는 Ag2S (99.9%, Alfa Aeser)로부터 형성된 0.2부터 1.4 μmol의 SF6를 이용해 분석을 수행하였다.
3. 실험 결과 및 토의
3.1 표준물질 분석
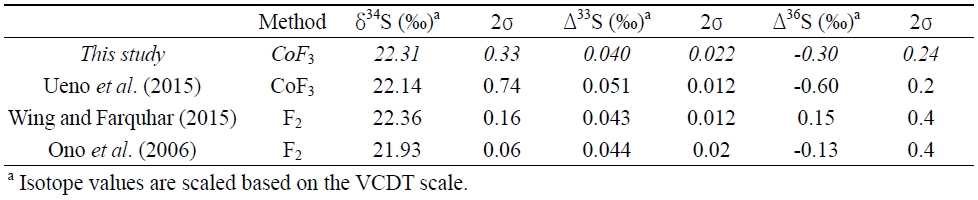
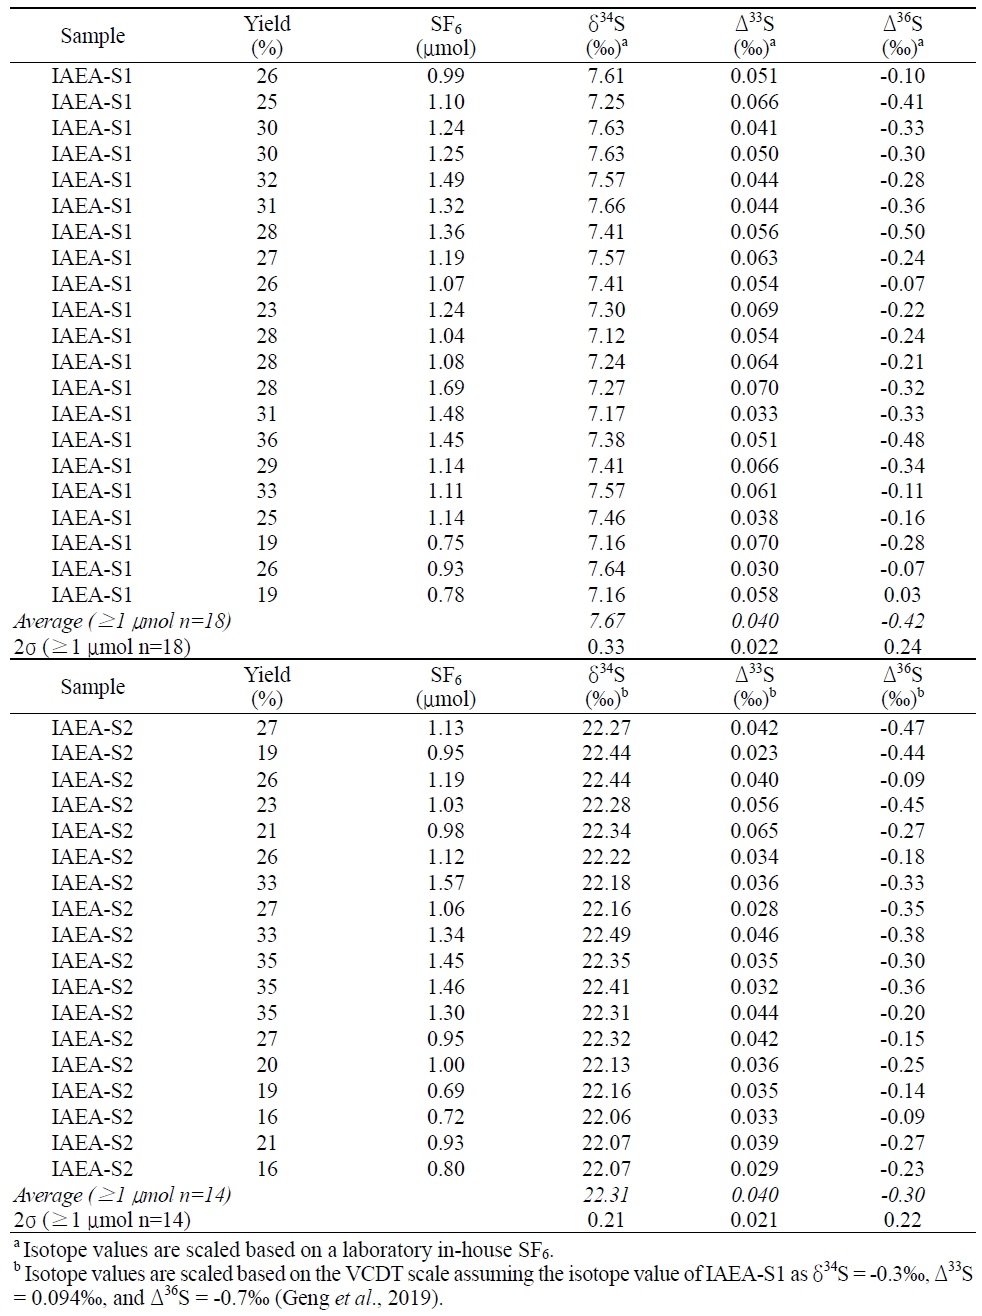
실험실 자체 표준물질의 다중 황 동위원소 조성은 공인된 표준물질인 IAEA-S1와 상호분석을 통해 측정되었다. IAEA-S1의 δ34S, Δ33S와 Δ36S 값은 각각 -0.3‰, 0.094‰와 -0.7‰이며 (Geng et al., 2019), 자체 표준물질의 δ34S, Δ33S와 Δ36S 값은 -7.67±0.33‰, 0.040±0.022‰와 -0.42±0.24‰ (2σ, n=18)로 측정되었다(그림 2). 자체 표준물질 동위원소 조성의 정확도는 이를 기준으로 또 른 표준물질인 IAEA-S2의 동위원소 조성을 측정해 가하였으며, 측정된 IAEA-S2의 δ34S, Δ33S와 Δ36S 값은 각각 22.31±0.21‰, 0.040±0.021‰와 -0.30±0.22‰ (2σ, n=14)으로 기존에 보고된 값에 부합해(표 1) 다중 황 동위원소 분석이 성공적으로 수행되었음을 확인할 수 있다. 또한, 측정결과는 SF6 형성 효율 및 CoF3 첨가량과 상관관계를 보이지 않았다. 앞서 명시한 것처럼 SF6를 기반으로 하는 황 동위원소 분석은 간섭을 일으킬 수 있는 동중 이온이 드물기 때문에 현재 이용되는 가장 정밀한 황 동위원소 분석법이며, 이번 실험의 재현성 또한 기존에 보고된 SF6 분석과 유사해 분석의 높은 신뢰성을 보여주었다. 질량종속 분별작용에 따른 다중 황 동위원소 비율 변화를 연구하기 위해 요구되는 오차는 Δ33S와 Δ36S 기준으로 각각 0.02‰와 0.2‰ 수준으로(Johnston et al., 2008; Warke et al., 2020), 이번 분석의 신뢰도는 이에 부합한다. 다만 IAEA-S2의 Δ36S 값은 현재까지 표준화된 값이 없어 각 연구마다 보고된 값에 일부 차이를 보이며(표 1), 36S 분석에는 극미량이긴 하지만 C3F5+로 인한 간섭효과도 보고된 바 있어 자료 해석에 세심한 주의가 요구된다(Ono et al., 2006).

Measurement of δ34S, Δ33S, and Δ36S for in-house SF6 standard gas. Isotope ratios were determined assuming the IAEA-S1 standard as δ34S = -0.3‰, Δ33S =0.094‰, Δ36S=-0.7‰ (Geng et al., 2019). Solid line shows the average isotope values of SF6 samples that are ≥1 μmol (n=18). Dotted lines show the error range (2σ) determined from the respective data.

δ34S, Δ33S, and Δ36S values of IAEA-S2 standard analyzed in this study (n=14) compared with those of other SF6 studies.
3.2 열분해 조건과 분석결과의 상관관계
선행 연구는 온도에 따른 SF6의 형성율과 동위원소 분석의 정확성과 재현성 변화를 확인하였으며 590℃를 최적의 조건으로 보고 하였다(Ueno et al., 2015). 이번 연구에서는 앞서 제안된 590℃가 본 연구에서도 최적의 반응 조건에 해당하는지 445℃부터 764℃의 총 네 가지 온도 범위에서 IAEA-S1을 이용해 SF6의 형성율을 확인하였다(그림 3). 764℃ 보다 더 높은 온도까지 가열할 수 있는 파이로포일이 존재하지만 Ag2S의 녹는 점(825℃) 보다 높기 때문에 SF6를 생성하기 어렵고, 반대로 445℃보다 낮은 온도에서는 분석에 요구되는 양의 SF6가 형성되지 않아 이용되지 않았다(Ueno et al., 2015). SF6 형성율은 온도가 높아짐에 따라 증가하는 현상을 보였으며(그림 3) 이전 실험 조건인 590℃ 보다 더 효과적일 수 있는 가능성을 보였다.

Comparison of SF6 yield rate with different pyrofoil temperatures.
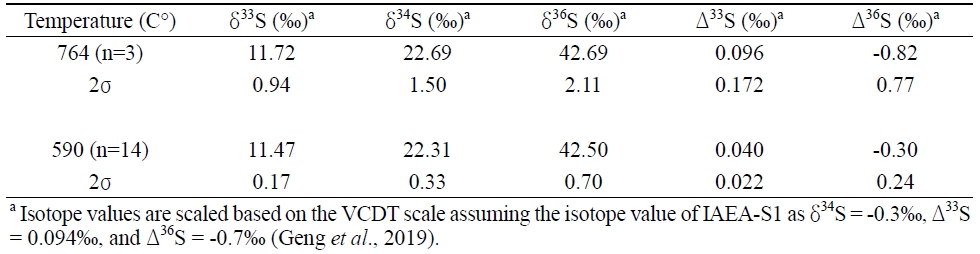
764℃에서 불화반응이 동위원소 분석에 미치는 영향을 확인하기 위해 IAEA-S2를 이용한 추가 실험을 진행하였다. 앞서 제시한 590℃ 실험 방법과 동일하게, 764℃에서 불화한 IAEA-S1결과를 이용하여 자체표준물질의 동위원소 값을 정의하였고, 764℃에서 진행한 IAEA-S2 분석결과를 VCDT 기준으로 나타냈다(표 2). 590℃에서 분석한 IAEA-S2 값과 비교해본 결과, 평균 분석결과에서는 큰 차이를 보이지 않았지만 764℃의 온도 조건에서 수행한 실험에서는 모든 동위원소 결과에서 비교적 낮은 재현성을 보였다. 다만 선행 연구에서는 온도가 590℃ 보다 높아지면서 Δ33S와 Δ36S 값이 크게 증가하는 비질량종속 분별작용 현상이 보고된 것과는 달리(Ueno et al., 2015), 본 실험에서는 유사한 경향이 확인되지는 않았다. 일부 분석 결과의 개선과 함께 764℃에서 SF6 형성율의 향상이 있었으나 590℃에서의 실험과 비교해 분석의 재현성에서 부족한 결과를 보여, 이번 실험 조건에서도 최적화된 열분해 반응 조건은 선행연구와 동일한 590℃임을 확인하였다.
δ34S, Δ33S, and Δ36S values of IAEA-S2 standard using 764℃ during the fluorination step (n=3) compared with that of 590℃ (n=14).
SF6를 이용한 황 동위원소 분석 방법은 네 가지 동위원소를 모두 정밀하게 측정할 수 있는 장점을 갖추었지만, 적은 양의 시료는 분석 과정에서 동중 이온 등 다양한 오염 요인의 영향에 취약할 수 있다. 시중에서 구입할 수 있는 Ag2S로부터 측정된 δ34S와 Δ33S는 시료의 양이 0.8 μmol 이하로 줄어들면 측정값 사이의 편차가 일부 증가하는 경향이 있으며, Δ36S의 경우 SF6가 1 μmol 이하로 내가면서 측정값 자체가 급격하게 증가하는 것을 확인할 수 있다(그림 4). 시료의 양이 감소함에 따라 Δ36S이 증가하는 현상은 선행 연구에서도 보고된 바가 있으며 간섭의 정확한 원인은 알려져 있지는 않지만 기체크로마토그래피 컬럼에서 기원한 미량의 오염 물질로 추정되고 있다(Ono et al., 2006; Ueno et al., 2015). 본 연구에서 명시된 표준시료 분석 결과들은 1 μmol 이상의 SF6를 분석한 실험만을 이용하여 나타냈으며 1 μmol 미만의 시료 결과들은 평균값에서 제외되었다(표 3). 평균적으로 25% 수준인 SF6 형성율을 고려하면, 정밀한 다중 황 동위원소 분석을 위해 요구되는 1 μmol의 SF6는 시료 준비단계에서 1 mg의 Ag2S에 해당한다.

Measurement of δ34S, Δ33S, and Δ36S for different amount of SF6. Isotope ratios are scaled based on a laboratory in-house SF6. Solid line shows the average isotope values of SF6 samples that are ≥1 μmol (n=5). Dotted lines show the error range (2σ) determined with the analysis of IAEA-S1 standard.
δ34S, Δ33S, and Δ36S values of IAEA-S1 and S2 standards in this study. Results with SF6 lower than 1 μmol are excluded from the average values.
4. 결 론
이번 연구에서는 서울대학교 지구환경과학부에 설치된 열분해장치와 IRMS를 이용해 네 개의 다중 황 동위원소 분석을 성공적으로 수행하였다. 열분해장치로 더 빠르고 안전하게 Ag2S을 SF6로 불화 시켰으며, 진공 가스라인과 기체크로마토그래피를 이용하여 시료를 정화하였다. 자동화된 설비를 이용한 전처리 시간은 시료당 1시간 정도로, 분석에 소요되는 시간과 인력을 줄여 다중 황 동위원소 분석에 대한 접근성을 높였다. 형성된 SF6는 서울대학교 지구환경과학부에 설치된 고분해능 질량분석기를 이용한 표준물질과 시료의 dual-inlet 교차 분석을 통해 네 가지 황 동위원소를 모두 측정하였다. 표준시료를 이용해 확인한 δ34S, Δ33S와 Δ36S의 분석 오차(2σ)는 각각 0.33‰, 0.022‰과 0.24‰이며 이전에 보고된 분석 결과들과 유사한 정확성과 재현성을 보였다. 정밀한 측정을 위해서는 최소 1 μmol 정도의 SF6가 필요하며 이보다 작은 양의 SF6 분석에서는 일부 정확성의 감소가 확인된다. 이러한 한계점을 극복하기 위해서는 더 높고 일정한 SF6 형성율이 필요한 상황이며 향후 연구를 통해 미량시료 분석에 대한 사항을 개선할 계획이다. 본 연구에서는 Ag2S 표준 시료를 중심으로 분석을 수행하였으나, 황산염(SO42-), 황철석을 비롯한 황화광물, 유기물에 포함된 황, 아황산염(SO32-)이나 자연 황(S0)과 같이 중간단계의 산화상태를 지닌 황 물질 등, 다양한 지질 및 환경시료를 습식실험을 통해 Ag2S로 준비해 다중 황 동위원소 분석에 이용할 수 있다(Thode et al., 1961; Canfield et al., 1986; Tuttle et al., 1986; Liu et al., 2020). 특히 이번 결과를 통해, 대기에서 발생하는 비질량종속 황 동위원소 분별작용에 기반한 원시 지구 환경 이해(Thomassot et al., 2015), 미세먼지 형성과정 연구(Han et al., 2017), 생지구화학적인 황 순환연구(Liu et al., 2020)와 행성지질학 연구(Lorand et al., 2020; Moreras-Marti et al., 2021) 분야에서도 다중 황 동위원소의 활용 범위가 넓어질 것으로 기대된다.
Acknowledgments
본 연구는 한국연구재단의 중견연구자지원사업(2019R1A2C1087039)의 지원을 받아 수행되었습니다.
References
-
Aoyama, S. and Ueno, Y., 2018, Multiple sulfur isotope constraints on microbial sulfate reduction below an Archean seafloor hydrothermal system. Geobiology, 16, 107-120.
[https://doi.org/10.1111/gbi.12268]

-
Baker, L., Franchi, I.A., Maynard, J., Wright, I.P. and Pillinger, C.T., 2002, A technique for the determination of 18O/16O and 17O/16O isotopic ratios in water from small liquid and solid samples. Analytical Chemistry, 74, 1665-1673.
[https://doi.org/10.1021/ac010509s]
-
Barkan, E. and Luz, B., 2005, High precision measurements of 17O/16O and 18O/16O ratios in H2O. Rapid Communications in Mass Spectrometry, 19, 3737-3742.
[https://doi.org/10.1002/rcm.2250]
-
Canfield, D.E., Raiswell, R., Westrich, J.T., Reaves, C.M. and Berner, R.A., 1986, The use of chromium reduction in the analysis of reduced inorganic sulfur in sediments and shales. Chemical Geology, 54, 149-155.
[https://doi.org/10.1016/0009-2541(86)90078-1]
-
Ding, T., Valkiers, S., Kipphardt, H., De Bievre, P., Taylor, P.D.P., Gonfiantini, R. and Krouse, R., 2001, Calibrated sulfur isotope abundance ratios of three IAEA sulfur isotope reference materials and V-CDT with a reassessment of the atomic weight of sulfur. Geochimica et Cosmochimica Acta, 65, 2433-2437.
[https://doi.org/10.1016/S0016-7037(01)00611-1]
-
Farquhar, J., Bao, H. and Thiemens, M., 2000, Atmospheric influence of Earth's earliest sulfur cycle. Science, 289, 756-758.
[https://doi.org/10.1126/science.289.5480.756]
-
Geng, L., Savarion, J., Caillon, N., Gautier, E., Farquhar, J., Dottin, J.W., Magalhães, N., Hattori, S., Ishino, S., Yoshida, N., Albarède, F., Albalat, E., Cartigny, P., Ono, S. and Thiemens, M.H., 2019, Intercomparison measurements of two 33S enriched sulfur isotope standards. Journal of Analytical Atomic Spectrometry, 34, 1263-1271.
[https://doi.org/10.1039/C8JA00451J]
-
Han, X., Guo, Q., Strauss, H., Liu, C., Hu, J., Guo, Z., Wei, R., Peters, M., Tian, L. and Kong, J., 2017, Multiple sulfur isotope constraints on sources and formation processes of sulfate in Beijing PM2.5 aerosol. Environmental Science and Technology, 51, 7794-7803.
[https://doi.org/10.1021/acs.est.7b00280]
-
Hulston, J.R. and Thode, H.G., 1965, Variations in the S33, S34, and S36 contents of meteorites and their relation to chemical and nuclear effects. Journal of Geophysical Research, 70, 3475-3484.
[https://doi.org/10.1029/JZ070i014p03475]
-
Johnston, D.T., Farquhar, J., Habicht, K.S. and Canfield, D.E., 2008, Sulphur isotopes and the search for life: strategies for identifying sulphur metabolisms in the rock record and beyond. Geobiology, 6, 425-435.
[https://doi.org/10.1111/j.1472-4669.2008.00171.x]
-
Kim, J., Lee, J., Choi, S., Bong, Y.-S., Choi, U., Yang, I.-J., Choi, H.-B. and Shin, W.-J., 2017, An on-line analytical method for sulfur and oxygen isotopes of sulfate using EA-IRMS and HT-EA-IRMS. Journal of the Geological Society of Korea, 53, 477-485 (in Korean with English abstract).
[https://doi.org/10.14770/jgsk.2017.53.3.477]
-
Liu, J., Pellerin, A., Izon, G., Wang, J., Antler, G., Liang, J., Su, P., Jørgensen, B.B. and Ono, S., 2020, The multiple sulphur isotope fingerprint of a sub-seafloor oxidative sulphur cycle driven by iron. Earth and Planetary Science Letters, 536, 116165.
[https://doi.org/10.1016/j.epsl.2020.116165]
-
Lorand, J.P., Labidi, J., Rollion‐Bard, C., Thomassot, E., Bellucci, J.J., Whitehouse, M., Nemchin, A., Humayun, M., Farquhar, J., Hewins, R.H., Zanda, B. and Pont, S., 2020, The sulfur budget and sulfur isotopic composition of Martian regolith breccia NWA 7533. Meteoritics & Planetary Science, 55, 2097-2116.
[https://doi.org/10.1111/maps.13564]
-
Menicucci, A.J., Matthews, J.A. and Spero, H.J., 2013, Oxygen isotope analyses of biogenic opal and quartz using a novel microfluorination technique. Rapid Communications in Mass Spectrometry, 27, 1873-1881.
[https://doi.org/10.1002/rcm.6642]
-
Mojzsis, S.J., Coath, C.D., Greenwood, J.P., McKeegan, K.D. and Harrison, T.M., 2003, Mass-independent isotope effects in Archean (2.5 to 3.8 Ga) sedimentary sulfides determined by ion microprobe analysis. Geochimica et Cosmochimica Acta, 67, 1635-1658.
[https://doi.org/10.1016/S0016-7037(03)00059-0]
-
Moon, J., Joo, Y.J., Kang, J.O. and Sim, M.S., 2021, Measurement of sulfur isotope ratios in trace amounts of dissolved sulfate by MC-ICP-MS. Journal of the Geological Society of Korea, 57, 99-108 (in Korean with English abstract).
[https://doi.org/10.14770/jgsk.2021.57.1.99]
-
Moreras-Marti, A., Fox-Powell, M., Stueeken, E., Di Rocco, T., Galloway, T., Osinski, G.R., Cousins, C.R. and Zerkle, A.L., 2021, Quadruple sulfur isotope biosignatures from terrestrial Mars analogue systems. Geochimica et Cosmochimica Acta, 308, 157-172.
[https://doi.org/10.1016/j.gca.2021.06.007]
-
Oguri, N., Takeda, T., Endo, M. and Tsuchiya, T., 2013, Development of a portable curie-point injector for GC-MS. Bunseki Kagaku, 62, 223-227 (in Japanese with English abstract).
[https://doi.org/10.2116/bunsekikagaku.62.223]
-
Ono, S., Eigenbrode, J.L., Pavlov, A.A., Kharecha, P., Rumble III, D., Kasting, J.F. and Freeman, K.H., 2003, New insights into Archean sulfur cycle from mass-independent sulfur isotope records from the Hamersley Basin, Australia. Earth and Planetary Science Letters, 213, 15-30.
[https://doi.org/10.1016/S0012-821X(03)00295-4]
-
Ono, S., Wing, B., Rumble, D. and Farquhar, J., 2006, High precision analysis of all four stable isotopes of sulfur (32S, 33S, 34S and 36S) at nanomole levels using a laser fluorination isotope-ratio-monitoring gas chromatography-mass spectrometry. Chemical Geology, 225, 30-39.
[https://doi.org/10.1016/j.chemgeo.2005.08.005]
-
Rees, C.E., Jenkins, W.J. and Monster, J., 1978, The sulphur isotopic composition of ocean water sulphate. Geochimica et Cosmochimica Acta, 42, 377-381.
[https://doi.org/10.1016/0016-7037(78)90268-5]
-
Savarino, J., Romero, A., Cole‐Dai, J., Bekki, S. and Thiemens, M.H., 2003, UV induced mass independent sulfur isotope fractionation in stratospheric volcanic sulfate. Geophysical Research Letters, 30, 2131.
[https://doi.org/10.1029/2003GL018134]
-
Thode, H.G., Monster, J. and Dunford, H.B., 1961, Sulphur isotope geochemistry. Geochimica et Cosmochimica Acta, 25, 159-174.
[https://doi.org/10.1016/0016-7037(61)90074-6]
-
Thomassot, E., O’Neil, J., Francis, D., Cartigny, P. and Wing, B.A., 2015, Atmospheric record in the Hadean Eon from multiple sulfur isotope measurements in Nuvvuagittuq Greenstone Belt (Nunavik, Quebec). Proceedings of the National Academy of Sciences, 112, 707-712.
[https://doi.org/10.1073/pnas.1419681112]
-
Tuttle, M.L., Goldhaber, M.B. and Williamson, D.L., 1986, An analytical scheme for determining forms of sulphur in oil shales and associated rocks. Talanta, 33, 953-961
[https://doi.org/10.1016/0039-9140(86)80234-X]
-
Ueno, Y., Aoyama, S., Endo, Y., Matsu'ura, F. and Foriel, J., 2015, Rapid quadruple sulfur isotope analysis at the sub-micromole level by a flash heating with CoF3. Chemical Geology, 419, 29-35.
[https://doi.org/10.1016/j.chemgeo.2015.10.032]
-
Warke, M.R., Di Rocco, T., Zerkle, A.L., Lepland, A., Prave, A.R., Martin, A.P., Ueno, Y., Condon, D.J. and Claire, M.W., 2020, The great oxidation event preceded a paleoproterozoic “snowball Earth”. Proceedings of the National Academy of Sciences, 117, 13314-13320.
[https://doi.org/10.1073/pnas.2003090117]
-
Wing, B.A. and Farquhar, J., 2015, Sulfur isotope homogeneity of lunar mare basalts. Geochimica et Cosmochimica Acta, 170, 266-280.
[https://doi.org/10.1016/j.gca.2015.09.003]