Characterization of the heat-treated sericite from Son Binh area, Vietnam
Abstract
Sericite is a natural mineral with many interesting properties. The commercial value of the sericite for ceramics and advanced materials depends on their physicochemical properties under natural conditions and calcination at different temperatures. In this study, the sericite, after mineral processing from the Son Binh area, Vietnam, was collected, pressed at 40 MPa, and calcined at 300~1100℃ to determine thermal, microstructural and physical properties. X-ray fluorescence analysis (XRF), X-ray diffraction (XRD), Fourier transformation infrared (FT-IR), thermogravimetric thermal analysis (TG)/differential thermal analysis (DTA), Scanning electron microscopy (SEM) - Energy-dispersive X-ray spectroscopy (EDS) and BET specific surface area were used for characterization of the heat-treated sericite samples. The analysis results show that the Son Binh samples are mainly layer-form sericites with an average particle size of about 13.75 μm. The sample's chemical composition is mainly SiO2 and Al2O3, followed by K2O, Na2O, and TiO2 và total iron content. The morphological properties of sericite were not changed during calcination at temperatures of 300℃ to 900℃. At 1100℃, the appearance of mullite can be attributed to the transformation of sericite or other minerals in the sample. The BET surface area, pore volume, and pore size of the thermal-treated sericite samples decreased with an increase in the calcination temperature.
초록
견운모는 많은 흥미로운 특성을 가진 천연 광물 중 하나이다. 세라믹 및 고급 재료용 견운모의 상업적 가치는 자연 조건 및 다양한 소성 온도 별 물리화학적 특성에 의해 좌우된다. 이 연구에서는 베트남 Son Binh 지역에서 산출되어 선광 처리된 견운모를 대상으로 40 MPa로 압축 후 300~1100℃ 온도구간에서 소성하여 열적, 미세 구조적 및 물리적 특성을 결정하였다. 열처리된 견운모를 대상으로 X-선 형광분석(XRF), X-선 회절분석(XRD), 푸리에 변환 적외선흡광분석(FT-IR), 열중량(TG)/열시차분석(DTA), 주사전자현미경(SEM)-에너지 분산 X-선 분광분석(EDS) 및 BET → BET 비표면적 분석을 실시하여 그 특성을 경정하였다. 분석 결과에 따르면 Son Binh 지역 견운모는 주로 평균 입자 크기가 약 13.75 µm인 층형 견운모이다. 화학 조성은 주로 SiO2와 Al2O3이며, 그 다음으로 K2O, Na2O, TiO2, FeO (total)이 소량 함유되어 나타난다. 견운모의 결정형은 300~900℃ 온도구간 소성 후에는 변하지 않았다. 1100℃ 소성 후에 멀라이트가 나타나는 것은 견운모, 혹은 다른 광물로부터 상전이가 있었음을 지시한다. 열처리된 견운모 시료의 BET 표면적, 공극 부피 및 공극 크기는 소성 온도 증가에 따라 감소하였다. 본 연구에서 제시한 결과는 Son Bình 지역 견운모가 전통 세라믹 및 고급 재료용으로 적합할 수 있음을 제시해 준다.
Keywords:
sericite, calcination, thermal analysis, Son Binh deposit키워드:
견운모, 소성, 열분석, Son Binh 광상1. Introduction
Sericite is a fine-grained, soft mica mineral with a structure similar to muscovite and illite. The chemical formula of sericite is defined as (K, Na, Ca) (Al, Fe, Mg)2(Si, Al)4O10(OH)2 with SiO2 = 43-49%, Al2O3 = 27-37%, K2O+Na2O = 9-11%, H2O = 4-6% (Ciullo, 1996). With many special properties such as lightness, flexibility, electrical insulation, impermeability, non-toxicity, inertness to the chemical environment, and blocking ultraviolet rays, sericite is considered an important and widely used industrial material such as polymers (Liang et al., 2019) paints (Kim et al., 2017), and high-quality ceramics (Brasileiro et al., 2022). In the field of ceramic production, as well as other related application fields, it is essential to study the physicochemical characteristics and technical properties of materials under natural conditions as well as under firing conditions (Wang et al., 2016; Liang et al., 2017; Abubakar et al., 2020). Elgamour et al. (2019) characterized two types of clay minerals from the Safi region, Morocco, at various firing temperatures (250℃-1100℃). These clays have different oxide and mineral compositions. Results indicated that, at different calcination temperatures, values such as the specific surface areas or the porosity of the calcined samples are different. Especially at 700℃, the clay supports made from both clays' porosity was maximal, with values of 23.45 ± 0.66% and 21.61± 0.60% (Elgamour et al., 2019). Natural kaolin samples from Shijiazhuang Minerals Co., Ltd. (China) were calcinated from room temperature to 400℃, 700℃, and 1050℃. Wang et al. (2011) concluded that during calcination at 600℃-900℃, metakaolin was formed. The surface area of the samples decreased with increased calcination temperature. Pore volume and size also increased with temperature (Wang et al., 2011). From the literature, it can be seen that depending on the mineral, and chemical composition of the raw materials, new materials with different properties will be formed by calcination. Therefore, it is necessary to study the physicochemical properties of the raw materials under the firing conditions for each different material before use.
Son Binh area, Ha Tinh province, Vietnam, has excellent potential for sericite. Recent studies have shown that the sericite ore in this area was formed by the hydrothermal metamorphism between rhyolite and their tuff belonging to the Lower Dong Trau sub-formation, in the period from 130.1 to 117.9 million years (Nguyen and Ngo, 2014). In the area, nine industrial sericite ore bodies were identified with the inferred mineral resource (333) and the reconnaissance mineral resource (334a) of about 1,565 million tons (Xuân et al., 2013). The quality of sericite here was quite good, meeting the production requirements in some primary fields (Nguyen et al., 2010; Xuân et al., 2013; Nguyen and Ngo, 2014; Nguyen, 2019). However, up to the present time, there have not been any studies on the characteristics of the Son Binh sericite at different firing temperatures.
In this study, the Son Binh sericite calcined at different temperatures of 300℃-1100℃ was characterized by X-ray diffraction (XRD), Fourier transformation infrared (FT-IR), thermogravimetric thermal analysis (TG)/differential thermal analysis (DTA), Scanning electron microscopy (SEM) - Energy-dispersive X-ray spectroscopy (EDS) and BET specific surface area.
2. Geological setting of the study area
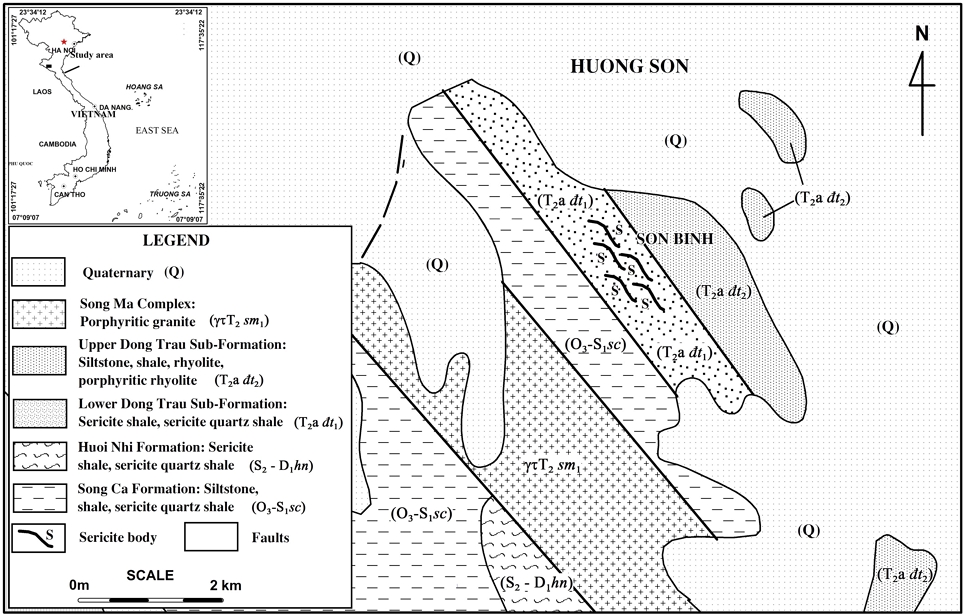
The geological characteristics of the study area are pretty simple, including formations of sedimentary and metamorphic rocks of the Paleozoic - Mesozoic age (Xuân et al., 2013; Nguyen and Ngo, 2014; Nguyen, 2019). The rocks of the Song Ca Formation (O3-S1 sc) are widely distributed and mainly consist of weakly metamorphosed terrigenous sediments. The Huoi Nhi Formation (S2-D1 hn) is composed primarily of sandstone, shale, siltstone, sandstone, and sericite quartz schist. The Dong Trau Formation is divided into two sub-formations: The lower Dong Trau sub-formation (T2a đt1) is mainly composed of rhyolite rocks, rhyolitic tuff, tuffaceous sandstone, tuffaceous siltstone, quartz porphyry. The thickness of the lower sub-formation is 250-950 m. The upper sub-formation (T2a đt2) consists mainly of siltstone, brownish-purple shale, thin layers of sand and gray-brown gravel. The thickness of the upper sub-formation is 700-800 m. Intrusive rock in the area is mainly sub-volcanic porphyritic granite of the Song Ma Complex (γτT2 sm1). This complex's porphyritic granite is closely related in space and originates from the Dong Trau Formation volcanic rocks. The distribution of the intrusive and sedimentary rocks is shown in Fig. 1. In the study area, the northwest-southeast fault system is dominant. The Son Binh sericite mineralization is distributed in the lower Dong Trau sub-formation rocks. Sericite mineralization is discontinuously stretched, forming various bodies in a northwest-southeast direction. The total length of these sericite bodies is more than 4,000 m, and their width ranges from 50 m to 150 m.
3. Methodology
3.1 Sample preparation
The sericite sample was collected from the product stock of the Son Binh mineral processing factory, Ha Tinh, Vietnam. It is called the Son Binh sericite, abbreviated as the SBS sample.
Cylindrical pellets were prepared by uniaxial dry pressing the SBS at 40 MPa and then were air-dried at 60℃ for 24 h using an oven. After that, they were heated at 300℃, 500℃, 700℃, 900℃, and 1100℃ with a heating rate of 5 Kmin-1, using an electric laboratory furnace. For each chosen temperature, the sample was calcined for 2 h and then slowly cooled to room temperature. A portion of the heated samples was ground using the agate mortar and pestle for the subsequent analyses. The calcined SBS samples at 300℃, 500℃, 700℃, 900℃, and 1100℃ are named S3, S5, S7, S9, and S11, respectively. The initial SBS sample is labeled as S0. All samples were kept in desiccators before use.
3.2 Sample characterization
The particle size distribution of the SBS sample was measured by using a Malvern Mastersizer 2000 instrument. The major-element chemical analysis was determined by X-ray fluorescence analysis (XRF, Philips X Unique2) on pressed powder samples. The morphological properties and mineral chemistry of minerals were examined using the scanning electron microscope (SEM - Quanta 450) with energy-dispersive X-ray spectroscopy (EDS). The mineralogical analysis of the samples was performed by X-ray diffraction (XRD). X-ray powder diffraction patterns of the samples with different conditions were also measured using a D5005 Siemens model powder diffractometer with Cu-Kα radiation at 40 kV and 30 mA, scanned from 3° to 70° at a goniometer rate of 2q = 2°min-1. The FT-IR spectra were recorded in the range from 4000 to 400 cm-1 with a resolution of 2 cm-1 by using the Shimadzu IR Prestige-21 spectro-meter instrument. The thermal behavior of each sericite sample was determined using differential and thermogravimetric thermal analysis (DTA/TGA) under a nitrogen atmosphere from room temperature to 1100℃ at a heating rate of 10℃/min. Nitrogen adsorption and desorption isotherms of the thermal-treated SBS samples at -196°C were obtained using a Micromeritics ASAP 2020a instrument.
4. Results and Discussion
4.1 Characteristics of the Son Binh sericite
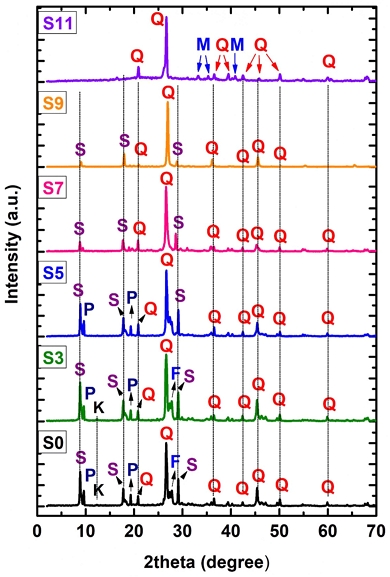
The X-ray diffraction (XRD) pattern of the Son Binh sericite sample (S0) in Fig. 5 indicates that the mineralogical compositions are ~35 wt.% sericite, ~10 wt.% pyrophyllite, ~5 wt.% kaolinite, ~5 wt.% feldspars with ~40 wt.% quartz, and other minor minerals, such as gibbsite. The XRD peaks of these minerals are consistent with other reports (Moon and Moon, 1996; Li et al., 2014; Liang et al., 2019). This result shows that, SBS has similar sericite content as others (González-Miranda et al., 2018). However, the quartz content in the SBS sample is relatively high. It may be due to the origin of sericite deposits related to magmatic activity in the area (Nguyen and Ngo, 2014).
The chemical composition of the SBS was determined by XRF and presented in Table 1. The results show that silica and alumina are the principal oxides with the highest percentage in the SBS sample at 64.94% and 24.53%, respectively. Other minor amounts of oxides are titanium oxide (TiO2) (0.25%) and total iron content (T.Fe) (0.12%). The amount of alkaline elements (Na2O+K2O) is 7.47%. The loss on ignition (LOI) in the SBS sample due to physical combined water, chemically combined water, and volatile matter accounts for 2.0%. It is similar to the chemical compositions of the Son Binh sericite reported in the literature (Nguyen et al., 2010; Xuân et al., 2013; Nguyen, 2019). In addition, it is also consistent with the results of SEM-EDS analysis with the peaks of Al, Si, K, Na, and Fe (Fig. 2).
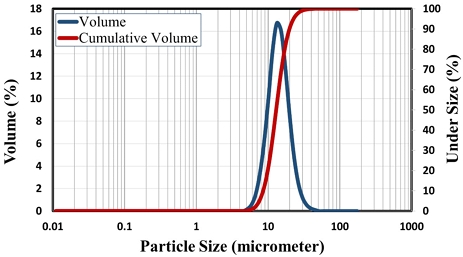
The scanning electron micrograph (SEM) image in Fig. 2 presents the typical sericite morphology with thin sheets, relatively uniform and minor in size. The result of the particle size analysis of the SBS sample shows that the sericite sample has a high proportion of fine particles with main sizes of about 13.75 μm (Fig. 3). Thus, it can be seen that the SBS has a relatively fine grain size that can meet the standards of many different applications.
4.2 Characteristics of the thermal-treated SBS
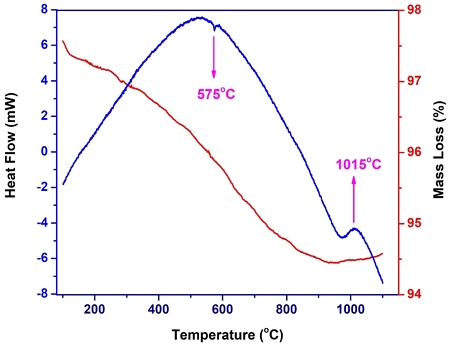
The thermal inspection of the SBS sample by differential thermal analysis (DTA) and thermogravimetric (TG) analysis was carried out in an inert atmosphere to 1100℃ at a heating rate of 5℃/min, and temperature (T) curves were simultaneously recorded. The DTA analysis of the SBS sample shows various reaction peaks (endothermic and exothermic) during heating to 1100℃ (Fig. 4). The first endothermic peak at about 100ºC is due to the removal of physical combined water present in the sample. The endothermic peak at about 575°C may associate with the characteristic SiO2 (α) à SiO2 (β) quartz phase transition or polymorphic transformation (González-Miranda, et al., 2018). The exothermic peak at about 1015°C corresponded to the crystallization of the mullite phase. This temperature is higher than the results of previous publications (Manoharan et al., 2012; González-Miranda et al., 2018). It may be due to the amount and conditions of transformation of sericite and quartz in the SBS sample, impacting on the thermal transformation. The TGA analysis shows various reductions in mass caused by the change of materials. Mass deductions for the SBS sample in the temperature range from 300℃ to 900℃ (about 5%).
Fig. 5 shows the XRD patterns of the raw and the thermal-treated SBS samples (Fig. 5). The XRD patterns show the minerals in the SBS sample (S0) are sericite, pyrophyllite, kaolinite, feldspar, and quartz. The peaks representing these minerals are almost unchanged at the calcination temperature of 300℃ and 500℃, except for the disappearance of kaolinite peaks (S3 and S5). At 700℃, the intensity of these peaks tends to decrease, especially for sericite and pyrophyllite minerals (S7). That is, at this temperature, the structure of sericite and pyrophyllite fighting breaks down and transforms into a new phase. The most apparent change in minerals can be seen in the XRD pattern of the calcined sample at 110 0℃ (S11). Here, the sericite and pyrophyllite peaks disappeared, and the XRD pattern shows peaks of quartz and the new mineral mullite. These XRD results are consistent with the DTA analysis of the SBS sample above (Fig. 4) and other reports (Wang et al., 2016; González-Miranda et al., 2018).
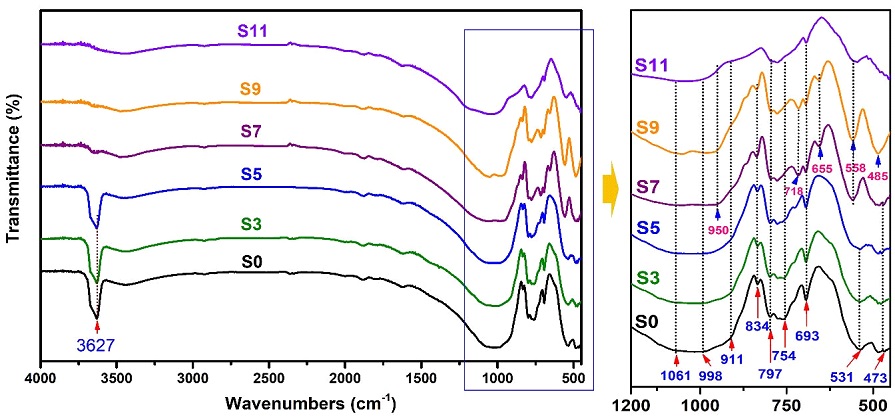
The results of FT-IR analysis in Fig. 6 show the change of O-H, Si-O-Si, and Al-O-Al groups in the SBS samples at different temperatures (Fig. 6). It can be seen that the IR spectrum of the SBS sample at room temperature conditions (S0) is quite similar to previous studies for samples containing typical minerals of sericite, pyrophyllite, kaolinite, and quartz (Janek et al., 2009; Jovanovski et al., 2016; Tang et al., 2016; Selim et al., 2018). The absorption peaks at 3627 cm-1 and 911 cm-1 are assigned to the stretching vibration of the O-H group. The Si-O-Si stretching region comprises two absorption bands at 1061 cm-1 and 998 cm-1. The band at 834 cm-1 is assigned to the stretching vibration of Al-OH (Janek et al., 2009). The stretching mode of Si (Al)-O and Si-O-Si (Al) are presented at the peaks of 797 cm-1 and 754 cm-1 (Tang et al., 2016). The band associated with SiO stretching of quartz was also observed at the height of 693 cm-1 (Ekosse, 2005). The peaks at 531 cm-1 and 473 cm-1 reflect the bending mode of Si-O-Si groups (Jovanovski et al., 2016; Selim et al., 2018). As can be seen, all peaks in the spectrum are unchanged under calcination conditions at 300℃ and 500℃. However, at the firing temperature of 700℃, the O-H group's vibration peaks gradually disappeared. The Si-O-Si stretching region at 1061 cm-1 and 998 cm-1 moved to 1051 cm-1 and 950 cm-1, respectively. The split peaks shifted from 754 cm-1 to 718 cm-1, 531 cm-1 to 558 cm-1, and 473 cm-1 to 485 cm-1, respectively. In addition, a 655 cm-1 peak of Si-O appeared and disappeared at 1100℃. At 1100℃, the apparent spectrum at 558 cm-1, 693 cm-1, and 797 cm-1 represented the existence of the mullite phase. Thus, it can be seen that the shifts and appearances of the peaks in the IR pattern are due to the change of mineral phases during calcination, and it is consistent with the results of the XRD analysis (Fig. 5).
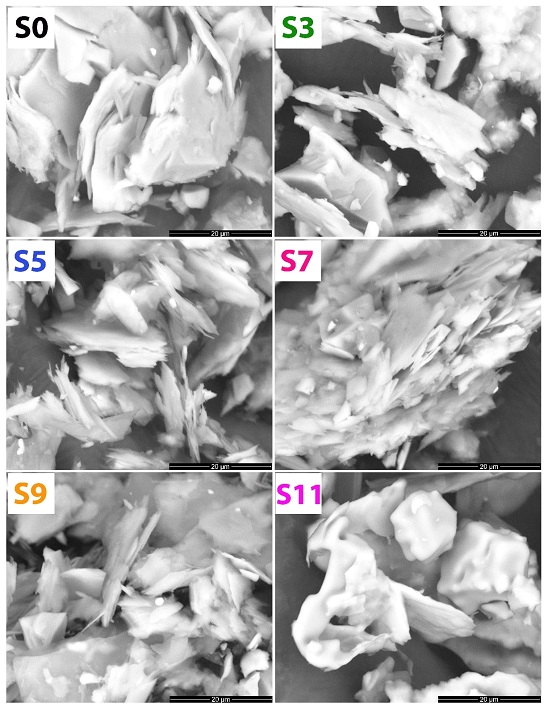
The SEM images of the samples of S0, S3, S5, S7, S9, and S11 are shown in Fig. 7. From the SEM images, it can be seen that sericite and pyrophyllite have fairly straightforward layered structures at room temperature (S0). The layered structure of these plates is almost unchanged when the sample is calcined at 300℃-500℃ (S3-S5). However, it changed and gradually disappeared as the heating temperature increased from 700℃ to 1100℃ (S7-S11). In particular, SEM images for samples calcined at 1100℃ showed that the sericite minerals were almost melted and replaced by the mullite material. The morphological change of minerals according to calcination temperature is consistent with other analytical results such as XRD, FT-IR, and TG-DTA.
Fig. 8 shows the adsorption-desorption isotherm of N2 at liquid N2 temperature of the SBS samples at 300℃, 500℃, 700℃, 900℃, and 1100℃. It can be seen that the isotherm shapes of the thermal-treated SBS at different temperatures are similar and show an almost reversible Type II (Fig. 8). This shape indicates that the thermal-treated SBS samples are dominantly macroporous (Kuila and Prasad, 2013).
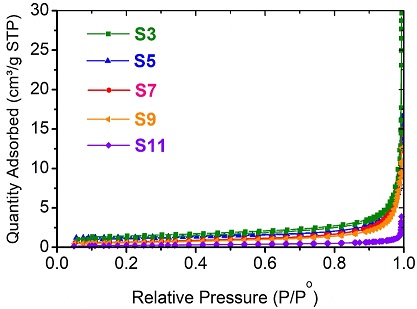
Nitrogen adsorption/desorption isotherms of the thermal-treated SBS at different temperatures (at room temperature (S0), 300℃ (S3), 500℃ (S5), 700℃ (S7), 900℃ (S9), and 1100℃ (S11)).
The BET surface area, pore volume, and pore size of the thermal-treated SBS samples are listed in Table 2. It can be seen that all four values of the BET surface area, the BJH adsorption cumulative surface area of pores between 1.7 nm and 300 nm width, the BJH adsorption cumulative volume of pores between 1.7 nm and 300 nm width, and the BJH adsorption average pore width (4V/A) of the SBS samples decreased with an increase in the calcination temperature. This suggests the influence of calcination temperature on the binding of minerals in the compressed SBS sample with a pressure of about 40 MPa. This binding increases gradually with the rise of the calcination temperature.
5. Conclusion
In this study, X-ray fluorescence analysis (XRF), X-ray diffraction (XRD), Fourier transformation infrared (FT-IR), thermogravimetric thermal analysis (TG)/differential thermal analysis (DTA), Scanning electron microscopy (SEM) - Energy-dispersive X-ray spectroscopy (EDS) and BET specific surface area were used for characterization of the heat-treated Son Binh sericite samples. The sericite was pressed at 40 MPa and calcined from 300℃-1100℃. The analysis results show that the Son Binh samples are mainly layer-form sericite, pyrophyllite, and kaolinite, with an average particle size of about 13.75 μm. The sample's chemical compositions are primarily SiO2 (64.94%) and Al2O3 (24.53%), followed by (Na2O+K2O) (7.47%), TiO2 (0.25%), and total iron content (0.12%). The morphological properties of sericite were not changed during calcination at temperatures of 300℃ to 900℃. The XRD and FT-IR analysis results show a change in mineral phases at the calcination levels from 500℃ to 700℃ and 900℃ to 1100℃. At 1100℃, the appearance of mullite can be attributed to the transformation of sericite or other minerals in the sample. The BET surface area, pore volume, and pore size of the thermal-treated sericite samples decreased with an increase in the calcination temperature. The results presented in this study can be important information for manufacturers using the SBS sericite to produce traditional ceramics or other advanced materials.
Acknowledgments
This research was financially supported by the Hanoi University of Mining and Geology (HUMG) - Vietnam, under grant number T22-25.
References
-
Abubakar, M., Muthuraja, A., Rajak, D.K., Ahmad, N., Pruncu, C.I., Lamberti, L. and Kumar, A., 2020, Influence of Firing Temperature on the Physical, Thermal and Microstructural Properties of Kankara Kaolin Clay: A Preliminary Investigation. Materials, 13, 1872.
[https://doi.org/10.3390/ma13081872]

-
Brasileiro, C.T., de Almeida Filho, H.D., Santana, G.L., Lot, A.V., Conte, S., Zanelli, C., Dondi, M. and Boschi, A.O., 2022, Sericite instead offeldspar in porcelain stoneware: Effect on sinteringand phase evolution. International Journal of Applied Ceramic Technology, 19, 612-622.
[https://doi.org/10.1111/ijac.13916]

-
Ciullo, P.A., 1996, Industrial minerals and their uses: a handbook and formulary. Noyes Publications, 640 p.
[https://doi.org/10.1016/B978-081551408-4.50003-X]

-
Ekosse, G.I.E., 2005, Fourier transform infrared spectrophotometry and X-ray powder diffractometry as complementary techniques in characterizing clay size fraction of kaolin. Journal of Applied Sciences and Environmental Management, 9, 43-48.
[https://doi.org/10.4314/jasem.v9i2.17289]

-
Elgamouz, A., Tijani, N., Shehadi, I., Hasan, K. and Kawam, M.A.-F., 2019, Characterization of the firing behaviour of an illite-kaolinite clay mineral and its potential use as membrane support. Heliyon, 5, e02281.
[https://doi.org/10.1016/j.heliyon.2019.e02281]

-
González-Miranda, F.D.M., Garzón, E., Reca, J., Pérez-Villarejo, L., Martínez-Martínez, S. and Sánchez-Soto, P.J., 2018, Thermal Behaviour of Sericite Clays as Precursors of Mullite Materials. Journal of Thermal Analysis and Calorimetry, 132, 967-977.
[https://doi.org/10.1007/s10973-018-7046-9]

-
Janek, M., Bugár, I., Lorenc, D., Szöcs, V., Velič, D. and Chorvát, D., 2009, Terahertz Time-Domain Spectroscopy of Selected Layered Silicates. Clays and Clay Minerals, 57, 416-424.
[https://doi.org/10.1346/CCMN.2009.0570402]

-
Jovanovski, G. and Makreski, P., 2016, Minerals from Macedonia. XXX. Complementary Use of Vibrational Spectroscopy and X-ray Powder Diffraction for Spectra-structural Study of some Cyclo-, Phyllo- and Tectosilicate Minerals, A Review. Macedonian Journal of Chemistry and Chemical Engineering, 35, 125-155.
[https://doi.org/10.20450/mjcce.2016.1047]

- Kim, M., Lalhmunsiama, L., Lee, S.M. and Jin, K.J., 2017, Preparation of Natural Wall Paint by Using Sericite Clay. Applied Chemistry for Engineering, 28, 501-505.
-
Kuila, U. and Prasad, M., 2013, Specific surface area and pore-size distribution in clays and shales. Geophysical Prospecting, 61, 341-362.
[https://doi.org/10.1111/1365-2478.12028]

-
Li, H., Feng, Q., Yang, S., Ou, L. and Lu, Y., 2014, The entrainment behaviour of sericite in microcrystalline graphite flotation. International Journal of Mineral Processing, 127, 1-9.
[https://doi.org/10.1016/j.minpro.2013.12.006]

-
Liang, Y., Ding, H., Sun, S. and Chen, Y., 2017, Microstructural Modification and Characterization of Sericite. Materials, 10, 1182.
[https://doi.org/10.3390/ma10101182]

-
Liang, Y., Yang, D., Yang, T., Liang, N. and Ding, H., 2019, The Stability of Intercalated Sericite by Cetyl Trimethylammonium Ion under Different Conditions and the Preparation of Sericite/Polymer Nanocomposites. Polymers, 11, 900.
[https://doi.org/10.3390/polym11050900]

-
Manoharan, C., Sutharsan, P., Dhanapandian, S. and Venkatachalapathy, R., 2012, Characteristics of some clay materials from Tamilnadu, India, and the their possible ceramic uses. Cerâmica, 58, 412-418.
[https://doi.org/10.1590/S0366-69132012000300021]

- Moon, J.-W. and Moon, H.-S., 1996, Characteristics of Sericite Occurred in the Bobae Mine, Pusan, Korea. Economic and Environmental Geology, 29, 129-138.
- Nguyen, T.T.T., 2019, Study on quality characteristics of raw and fine sericite ores in Son Binh area, Ha Tinh province. Journal of Mining and Earth Sciences, 60, 42-50.
- Nguyen, T.T.T. and Ngo, X.T., 2014, Characteristics of sericite mineralization in Son Binh area, Huong Son district, Ha Tinh Province. Its relation with regional tectonic-magmatic phases. Journal of Geology Series A, 340, 37-45 (in Vietnamese with English abstract).
- Nguyen, V.H., Dao, D.A. and Nguyen, T.T.T., 2010, Evaluation of quality and ability to process and use Son Binh sericite ore. Journal of Geology, 322, 38-44 (in Vietnamese).
-
Selim, A.Q., Mohamed, E.A., Seliem, M.K. and Zayed, A.M., 2018, Synthesis of Sole Cancrinite Phase from Raw Muscovite: Characterization and Optimization. Journal of Alloys and Compounds, 762, 653-667.
[https://doi.org/10.1016/j.jallcom.2018.05.195]

-
Tang, J., Zhang, Y. and Bao, S., 2016, The Influence of Roasting Temperature on the Flotation Properties of Muscovite. Minerals, 6, 53.
[https://doi.org/10.3390/min6020053]

- Tran, T., et al., 1996, Geological and mineral map of Ha Tinh - Ky Anh, scale 1:200,000. Department of Geology of Vietnam (Hanoi).
-
Wang, H., Li, C., Peng, Z. and Zhang, S., 2011, Characterization and thermal behavior of kaolin. Journal of Thermal Analysis and Calorimetry, 105, 157-160.
[https://doi.org/10.1007/s10973-011-1385-0]

-
Wang, X., Li, J.-H., Guan, W.-M., Fu, M.-J. and Liu, L.J., 2016, Emulsion-templated high porosity mullite ceramics with sericite induced textured structures. Materials and Design, 89, 1041-1047.
[https://doi.org/10.1016/j.matdes.2015.10.085]

- Xuân, P.T., Phổ, N.V., Trà, D.T., Nga, H.T., Đăng, P.T., Liên, N.T. and Thảo, N.T.T., 2013, Sericite Ore Prospects in Huong Son - Ky Anh region (Ha Tinh Province). Vietnam Journal of Earth Sciences, 35, 97-106 (in Vietnamese with English abstract).

