Deployment of the linear array with geophones on the fault zone of the 2016 Mw 5.5 Gyeongju earthquake
 ; YoungHee Kim1, ‡
 ; Ki Baek Kwon2 ; Jaeseoung Han1 ; Byeong Seok Ahn2 ; Gyeongdon Chai3, 4 ; Yeongjae Choi1 ; Dabeen Heo2 ; Yunsun Jung1 ; Hyunsun Kang1 ; Min Hyug Koh1 ; Joa Kwon2 ; Jun Yong Park1 ; Min-Seong Seo1 ; Young Oh Son1 ; Sangwoo Han1 ; Tae-Seob Kang2
 ; Junkee Rhie1 ; Kwang-Hee Kim5
 ; Jin-Han Ree3
 ; 김영희1, ‡
 ; 권기백2 ; 한재승1 ; 안병석2 ; 채경돈3, 4 ; 최영재1 ; 허다빈2 ; 정윤선1 ; 강현선1 ; 고민혁1 ; 권조아2 ; 박준용1 ; 서민성1 ; 손영오1 ; 한상우1 ; 강태섭2
 ; 이준기1 ; 김광희5
 ; 이진한3
Abstract
After an earthquake with the moment magnitude 5.5 at a city of Gyeongju in South Korea on 12 September 2016, the public concern is raised about the safety of critical structures in surrounding region of the epicenter. The seismological and earth science communities aim to reveal earthquake source properties and fault structures using seismic array data recorded from various sizes of arrays including national permanent arrays and temporary arrays that were constructed after the 2016 Gyeongju earthquake. In particular, the densest broadband temporary array in the epicentral region named Gyeongju Hi-density Broadband Seismic Network provided seismic data to investigate subsurface structure. Furthermore, to better constrain detailed fault structure that is responsible for the 2016 Gyeongju earthquake, an additional seismic campaign of deploying low-cost 69 three-component geophones in a linear array was conducted in 2020. This linear temporary array of geophones is designed to cover the zone of aftershocks and deployed sub-perpendicular to the fault, closest to the mainshock, with a very dense spacing of 200 m. The array operated for one month from 17 November to 20 December 2020. An example of seismic waveforms, filtered at 2-100 Hz, of regional earthquakes shows clear P and S waves, and acquired waveform data during the deployment period can be usable for seismological research. This technical report contains information regarding the instrument, details about the deployment, and quality of the seismic waveforms.
초록
2016년 9월 12일에 경주에서 발생한 모멘트 규모 5.5의 지진이 발생한 이후, 이와 관련된 공공 안전에 대한 관심이 증폭되었다. 지진이 발생한 이후, 국가 광역 지진관측망, 대학교에서 설치한 임시 지진관측망, 그리고 경주지진 원인 단층 규명을 위한 경주 고밀도 광대역 지진관측망자료는 경주지진과 연관 단층의 특성을 파악하는데 효과적으로 이용되고 있다. 이러한 지진 관측 네트워크의 목적을 공유하며, 경주지진 여진 지역에 약 200 m 간격으로 69대의 저비용 3성분 지오폰을 선형으로 배열하여 지진 자료를 획득하였다. 지오폰 선형 배열 관측망은 지진 단층대에 거의 수직하게 배치되었으며, 2020년 11월 17일부터 12월 20일까지 약 한 달간 가동되었다.관측 자료에 대하여 간단한 필터링(2-100 Hz) 만으로 인근에서 발생한 국지지진의 P파와 S파를 뚜렷하게 확인할 수 있었다. 또한 가동 기간 동안 발생한 광역 또는 원거리 지진의 신호를 분석하는데 이용할 수 있을 것으로 기대한다. 조밀한 지오폰 선형 배열 관측 자료는 경주지진의 본진 및 여진과 관련된 원인 단층의 상세한 구조를 규명하는데 기여할 수 있을 것으로 기대한다.
Keywords:
2016 Gyeongju earthquake, geophone array, seismic data, fault structure키워드:
2016 경주지진, 지오폰 배열, 지진 자료, 원인 단층 구조1. Introduction
On 12 September 2016, the earthquake with the moment magnitude (Mw) 5.5 occurred in Gyeongju city in South Korea (Fig. 1), and this event is the largest earthquake to have hit the city after modern seismic observation began in 1978. The largest Mw 5.1 foreshock occurred at 10:44:32 UTC and the mainshock followed it at 11:32:55 UTC on 12 September 2016 (Fig. 1; Kim et al., 2017a). The largest aftershock with Mw 4.3 occurred on 19 September 2016 (Fig. 1; Kim et al., 2017a). The earthquake caused damages on buildings near its epicenter without casualty (Jin et al., 2020). Although the degree of earthquake damage is intermediate (Jin et al., 2020), the earthquake raised public concern about the safety of nuclear power facilities located 27 km from the epicenter (Fig. 2). The power plant is constructed to sustain up to 0.2 g and the maximum acceleration by the mainshock at the powerplant reached to 0.12 g, according to the Nuclear Safety and Security Commission.

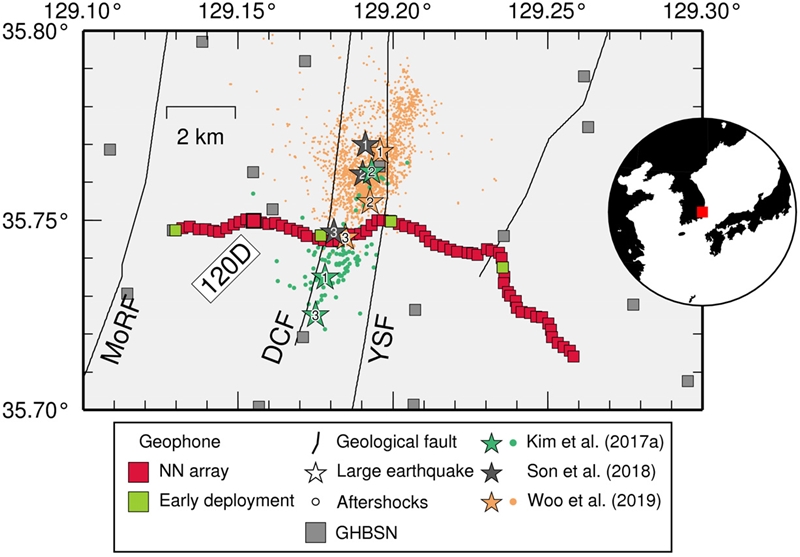
Map of the geophone array in Gyeongju, South Korea. The NN array covers a zone of seismicity reported by previous studies (Kim et al., 2017a; Son et al., 2018; Woo et al., 2019). Colored star and circle denote slightly different epicenters determined by the studies. The station 120D is marked by a thicker line. The numbers (1, 2, and 3) on colored stars indicate epicenters of the Mw 5.1 earthquake at 2016/9/12 10:44:33 (foreshock), the Mw 5.5 at 2016/9/12 11:32:55 (mainshock), and the Mw 4.3 at 2016/9/19 11:33:59 (the largest aftershock), respectively. YSF: Yangsan fault. DCF: Deokcheon fault (Kim et al., 2017b); MoRF: Moryang fault.

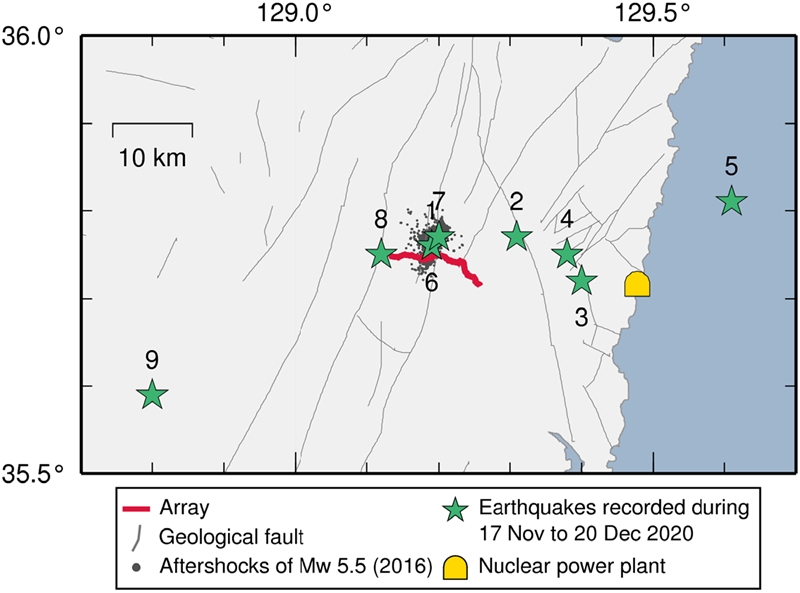
Nine crustal earthquakes occurred during the operational period of NN array from 17 November to 20 December 2020. Catalog of the earthquakes is obtained from http://necis.kma.go.kr (accessed on 27 January 2021). Waveforms recorded at the station 120D (Fig. 1) are shown in Fig. 4.
Temporary seismic array consisting of 27 broadband seismometers was first constructed near/at the epicenter to monitor aftershocks till February 2017 (Kim et al., 2016a, 2016b). The aftershocks recorded from various arrays including national permanent arrays and several temporary arrays revealed complex fault geometries below the epicentral region (Hong et al., 2017; Kim et al., 2017a, 2018; Son et al., 2018; Woo et al., 2019). For seismic hazard assessment, the large-scale project of building the very first densest array (denoted as Gyeongju Hi-density Broadband Seismic Network, GHBSN) began in 2017, and this temporary array consisted of 200 broadband seismometers in the area of 50 km by 50 km (grey squares in Fig. 1). An average interstation distance is 4.5 km. This array is expected to allow to lower the earthquake detection threshold, locate earthquakes with high precision, and delineate faults in the region.
To better constrain the detailed subsurface fault structure that is responsible for the 2016 Gyeongju earthquake, seismic campaign of deploying low-cost 69 three-component geophones in a linear array began in 2020. Although the causative fault has not been identified on any surface outcrops, previous studies have shown that the hypocenters of the 2016 Gyeongju earthquake sequence define planar ruptures (Kim et al., 2016a; Son et al., 2018; Woo et al., 2019). We call this causative fault the Naenam fault since almost all of the epicenters of the 2016 Gyeongju earthquake sequence are located in the Naenam-myeon area. The name of this geophone array is assigned as Naenam Fault Array with network code of ‘NN’. We considered following points in designing and deploying the NN array. First, the array covers the region of relocated seismicity (Kim et al., 2017a; Son et al., 2018; Woo et al., 2019) that mostly sits between two surface faults (Yangsan fault (YSF) and Deokcheon fault (DCF)). The array was thus linearly deployed sub-perpendicular to the YSF and DCF that are both north-northeast-south-southwest-trending. Second, considering the focal depths of the mainshock (13-15 km) and aftershocks (12-16 km) (Kim et al., 2017a; Son et al., 2018; Woo et al., 2019), the aperture of the NN is set as 15 km in length (or 12 km orthogonal to the fault) to ensure vertical resolution down to ~16 km, given the limited number of the geophones (Fig. 1). Third, the interstation distance of ~200 m is set to maximize a 2-dimensional resolution (horizontal-to-vertical plane) of imaged subsurface structure with total 69 geophones. Subsurface structure of electrical resistivity above 5 km depth is investigated by audio-magnetotelluric survey along several profiles in the region of GHBSN array (Uhm et al., 2021), and one of the profiles is closely positioned to our NN array. In this report, we detail a description of sensor type, instrumentation procedures, and quality of recorded seismic waveforms.
2. Seismic instrument and deployment
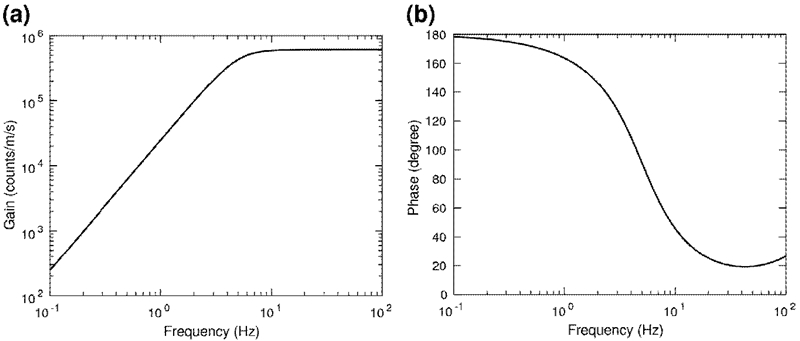
The instrument of the NN array is IGU-16HR 3C SmartSolo in three-orthogonal components of Dynamic Technologies with 5 Hz of corner frequency. The instrument response is shown in Fig. 3. The instrument includes battery (50 days operating life) and spike. A sampling rate is set to 500 Hz for recording high frequency signals of small-magnitude earthquakes. A pre-field survey was conducted in July 2020 with a purpose of finding potential deployment sites along the linear profile, checking site condition at each site, and deploying geophones at four sites (green square in Fig. 1) to evaluate noise level of the signals recorded before the campaign of deploying the 69 geophones. The four geophones were replaced three times by fully-charged ones every month. On 17 November 2020, the seismic array campaign began, and each geophone was installed to the ground with its own spike.
All geophones were deployed along a road (number ‘904’) after permissions by local government or/and private landowners. This road is positioned roughly perpendicular to the strike of the subsurface fault (Fig. 1). Most of the geophones were installed on soil surface next to the paved road, and a few sites in farm, crop field, embankment, and dried river bed. The deployment of the 69 geophones was completed in three days from 17 to 19 November 2020. The NN array operated for slightly over 1-month period before battery ran out. Most of the geophone batteries ran out in 19-22 December 2020. All the geophones were retrieved from the sites on 4-5 January 2021.
Station name is defined with three-digit numbers and one character, such as ‘120D’. The three-digit number is assigned to each station in an ascending order along the array from west to east for convenience in data processing. The character ‘D’ indicates the main period of deployment (17 November to 20 December 2020). Similarly, ‘A’, ‘B’, and ‘C’ mean three different periods of the early deployments for the four sites that were conducted on 31 July to 28 August, 28 August to 28 September, and 8 October to 10 November in 2020, respectively (Fig. 1). Channels ‘DPZ’ and ‘EPZ’ mean 500 and 250 Hz of the sampling rates of the vertical component, respectively, following the protocol used in Ahern et al. (2009).
Information of the data, including coordinates of the stations, instrument responses, site condition, a list of local earthquakes recorded by the array (Fig. 2), and deployment log is provided at https://www.naenamarray2020.info (last update on 17 June 2021), which of a copy is also stored at a permanent repository at https://doi.org/10.5281/zenodo.4661926. About one-month of continuous seismic waveform data are retrieved without any loss of data. A size of the total data is 1.2 terabyte.
3. Seismic waveform data
During the operational period from 17 November to 20 December 2020, the National Earthquake Comprehensive Information System (http://necis.kma.go.kr/) reported nine crustal earthquakes that occurred near the NN array with the local magnitude (ML) ranging from 0.8 to 1.2 (Fig. 2). Among the events, three earthquakes with event numbers of ‘1’, ‘6’, and ‘7’ are located within the zone of the aftershocks near the NN array. Other events (‘2’, ‘3’, ‘4’) are located relatively away from the NN toward east. One event (‘5’) occurred offshore. Fig. 4 shows vertical components of the nine earthquakes shown in Fig. 2. The waveform data are processed by removing the instrument response and bandpass filtering in 2-100 Hz, and the data processing reveals clear P and S arrivals and S wave coda (Fig. 4).

Vertical waveforms of the station 120D for the nine events shown in Fig. 2. The waveforms for the events from 1 to 9 are shown in (a-i), respectively. The event number, local magnitude (ML), and the epicentral distance to the 120D (D) are specified in each panel. The waveforms are filtered in 2-100 Hz. P and S arrivals are highlighted in pink and blue colors, respectively. The earthquake information is obtained from ‘http://necis.kma.go.kr’ (last accessed on 12 January 2021).
4. Summary
In 2020 we constructed a linear dense geophone array, denoted as Naenam Fault Array with the network code of NN, at the epicentral area of the 2016 Mw 5.5 Gyeongju earthquake, and collected seismic waveform data for ~1 month. The NN array was positioned nearly sub-perpendicular to the fault responsible for the mainshock. The aperture of the array was set as 12 km perpendicular to the fault in consideration of focal depths of the 2016 Gyeongju earthquake. Nine crustal earthquakes with ML 0.8-1.2 occurred during the operation period. The record sections of the nine events show clear P and S waves. Collected continuous seismic waveform data can be usable for various seismological research.
Acknowledgments
We thank Sang-Jun Lee for contributing to design the early plan of deployment. We are grateful to Gyeongju-si, Gyeongsangbuk-do, and landowners for permission to install the geophones. Authors acknowledge the Nuclear Safety Research Program through the Korea Foundation of Nuclear Safety (KoFONS), granted financial resource from the Nuclear Safety and Security Commission (NSSC), Republic of Korea (No. 1705010). H.L. and deployment participants were also partially supported by Development of unified 3-D seismic velocity model program (KMI2019-00110) through Korea Meteorological Administration. The data underlying this paper will be shared on request to the first and corresponding authors until the data is released to public.
References
- Ahern, T., Casey, R., Barnes, D., Benson, R., Knight, T. and Trabant, C., 2009, SEED reference manual, version 2.4.
-
Hong, T.-K., Lee, J., Kim, W., Hahm, I.-K., Woo, N.C. and Park, S., 2017, The 12 September 2016 ML 5.8 midcrustal earthquake in the Korean Peninsula and its seismic implications. Geophysical Research Letters, 44, 3131-3138.
[https://doi.org/10.1002/2017GL072899]

-
Jin, K., Lee, J., Lee, K.-S., Kyung, J.B. and Kim, Y.-S., 2020, Earthquake damage and related factors associated with the 2016 ML = 5.8 Gyeongju earthquake, southeast Korea. Geosciences Journal, 24, 141-157.
[https://doi.org/10.1007/s12303-019-0024-9]

-
Kim, K.-H., Kim, J., Han, M., Kang, S.Y., Son, M., Kang, T., Rhie, J., Kim, Y., Park, Y., Kim, H., You, Q. and Hao, T., 2018, Deep Fault Plane Revealed by High‐Precision Locations of Early Aftershocks Following the 12 September 2016 ML 5.8 Gyeongju, Korea, Earthquake. Bulletin of the Seismological Society of America, 108, 517-523.
[https://doi.org/10.1785/0120170104]

-
Kim, K.-H., Kang, T.-S., Rhie, J., Kim, Y., Park, Y., Kang, S.Y., Han, M., Kim, Jeongmu, Park, J., Kim, M., Kong, C., Heo, D., Lee, H., Park, E., Park, H., Lee, S.-J., Cho, S., Woo, J.-U., Lee, S.-H. and Kim, J., 2016a, The 12 September 2016 Gyeongju earthquakes: 2. Temporary seismic network for monitoring aftershocks. Geosciences Journal, 20, 753-757.
[https://doi.org/10.1007/s12303-016-0034-9]

-
Kim, Y., He, X., Ni, S., Lim, H. and Park, S.C., 2017a, Earthquake source mechanism and rupture directivity of the 12 september 2016 Mw 5.5 Gyeongju, South Korea, earthquake. Bulletin of the Seismological Society of America, 107, 2525-2531.
[https://doi.org/10.1785/0120170004]

-
Kim, Y., Rhie, J., Kang, T.-S., Kim, K.-H., Kim, M. and Lee, S.-J., 2016b, The 12 September 2016 Gyeongju earthquakes: 1. Observation and remaining questions. Geosciences Journal, 20, 747-752.
[https://doi.org/10.1007/s12303-016-0033-x]

-
Kim, Y.-S., Kim, T., Kyung, J.B., Cho, C.S., Choi, J.-H. and Choi, C.U., 2017b, Preliminary study on rupture mechanism of the 9.12 Gyeongju Earthquake. Journal of the Geological Society of Korea, 53, 407-422.
[https://doi.org/10.14770/jgsk.2017.53.3.407]

-
Son, M., Cho, C.S., Shin, J.S., Rhee, H. and Sheen, D., 2018, Spatiotemporal distribution of events during the first three months of the 2016 Gyeongju, Korea, earthquake sequence. Bulletin of the Seismological Society of America, 108, 210-217.
[https://doi.org/10.1785/0120170107]

-
Uhm, J., Heo, J., Min, D.-J., Oh, S.-H. and Chung, H.-J., 2021, Imaging strategies to interpret 3-D noisy audio-magnetotelluric data acquired in Gyeongju, South Korea: data processing and inversion. Geophysical Journal International, 225, 744-758.
[https://doi.org/10.1093/gji/ggab002]

-
Woo, J.-U., Rhie, J., Kim, S., Kang, T.-S., Kim, K.-H. and Kim, Y., 2019, The 2016 Gyeongju earthquake sequence revisited: aftershock interactions within a complex fault system. Geophysical Journal International, 217, 58-74.
[https://doi.org/10.1093/gji/ggz009]

