최근 남극 세종과학기지 인근 브랜스필드 해협에서 발생한 이상 지진 활동(2020.08.-2021.02.)
초록
USGS (US Geological Survey)는 남극반도 브랜스필드 해협에서 2020년 8월 29일에 발생한 첫 번째 지진(Mw 4.9) 이후 규모 4.0-6.9에 이르는 170건의 지진 발생을 보고했으며, 이는 이 지역에서 발생한 과거 지진을 고려해보면 이상 지진 활동으로 여겨진다. 한편, 군발지진 발생 가운데 2021년 1월 23일에 Orca 해저화산에서 북동쪽으로 약 200 km 떨어진 곳에서 발생한 Mw 6.9 지진은 2021년 2월까지 가장 큰 이벤트로 기록되었다. 킹조지섬에 위치한 JUBA 지진관측소에 기록된 지진 기록에 STA/LTA 방법을 적용하여 초기 분석한 결과, 총 34,101 이벤트가 검출되었으며, 2020년 11월 초까지 하루에 100여 차례 이상 지진이 발생하다가 그 이후로 발생 횟수가 적어짐을 확인하였다. USGS로부터 모멘트 텐서 해석 자료가 제공된 27건의 지진에 관한 지진발생기구 분류 분석 결과는 대부분의 이벤트가 주향이동단층 활동에 의해 발생했음을 지시한다. 보상선벡터 쌍극자 성분이 10%를 초과하는 일부 이벤트는 해저화산환경 관련 체적변화에 의해 발생했다고 해석할 수도 있으나, 이 부분은 국제협력을 통해 더 많은 자료를 수집하여 보다 세밀한 분석이 요구되는 사항이다.
Abstract
There have been 170 earthquakes with seismic magnitudes ranging from 4.0-6.9 in the Bransfield Strait, Antarctic Peninsula, reported by the USGS since the first event (Mw 4.9) occurred on 29 August 2020, which is anomalously high seismicity in this region. The largest event in the earthquake swarm sequence occurred ~200 km northeast of the Orca submarine volcano on 23 January 2021, which has a magnitude Mw 6.9. We investigated the seismic data recorded at JUBA where is located in the King George Island and found that total 34,101 events were detected by applying the STA/LTA method and the daily occurrence exceeds 100 events until early November 2020 then gets smaller. Furthermore, the Focal Mechanisms Classification analysis for 27 earthquakes that moment tensor solutions are provided by the USGS indicates that most events are characterized by strike-slip faultings and a few normal faulting events. Some events with a compensated linear vector dipole component of more than 10% may implicate volumetric changes associated with submarine volcanic environments, even though it should be carefully examined by collecting more data through international collaborations.
Keywords:
anomalously high seismicity, earthquake swarm, Bransfield Strait, Antarctic Peninsula키워드:
이상 지진 활동, 군발지진, 브랜스필드 해협, 남극 반도1. 서 언
남극반도(Antarctic Peninsula)와 남셰틀랜드 군도(South Shetland Islands) 사이에는 브랜스필드 해협(Bransfield Strait)이라는 배호분지(back-arc basin)가 위치하고 있다(그림 1). 남셰틀랜드 섭입대(South Shetland Trench)는 약 4백만 년 전에 섭입활동을 멈춘(Larter and Barker, 1991) 이후 섭입판의 후퇴(slab rollback)와 스코시아판과 남극판 간의 다소 복잡한 횡인장성 운동(transtentional motions)에 의해 북서-남동 방향으로 비대칭적 확장이 진행중이다(Lawver et al., 1996; Barker and Austin, 1998; Robertson Maurice et al., 2003).
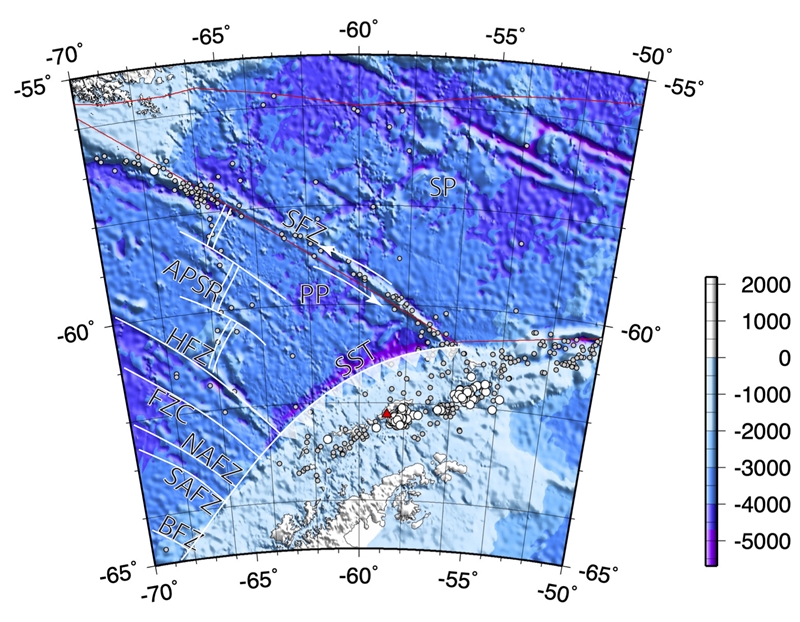
Map of the study area showing topography, earthquake locations, and major tectonic features. Larger white small circles are earthquake locations reported by USGS from 29 August 2020 to 12 February 2021, and smaller grey circles indicate historical seismicity. A red triangle represents the King Sejong Station. Plate boundaries are marked by red lines. APSR: Antarctic Phoenix Spreading Ridge, BFZ: Biscoe Fracture Zone, HFZ: Hero Fracture Zone, NAFZ: North Anvers Fracture Zone, SAFZ: South Anvers Fracture Zone, PP: Phoenix Plate, SFZ: Shackleton Fracture Zone, SST: South Shetland Trench, and SP: Scotia Plate.
브랜스필드 분지(Bransfield Basin)는 지질구조 특성상 서쪽, 중앙, 동쪽 분지로 크게 나눌 수 있다(Grad et al., 1993; Christeson et al., 2003). 이 가운데 중앙분지(Central Bransfield Basin; CBB)에서는 배호분지에서 흔히 발견되는 젊은 분출 현무암이 발견되기도 하지만, 해양 탄성파 탐사로 확인된 지각의 두께는 20-26 km 까지 달하여 해저확장(seafloor spreading)이 진행중이라고 단정하기도 어렵기 때문에 단순한 지체구조 모델로 설명하기엔 매우 복잡한 특성을 보인다(Lawver et al., 1996).
Lee et al. (2000)은 CBB 내에는 지진이 거의 관측되지 않고 주로 CBB 서쪽과 동쪽 경계부에서 지진이 집중되어 발생함을 근거로 브랜스필드 해협의 확장 증거가 없으며 경계부 발생 지진 역시 섭입대 활동과는 직접적인 연관성이 부족하다고 보고하였다. 지난 50여 년간 브랜스필드 분지에서 규모 5 이상의 지진은 45회 발생했으며 가장 큰 지진은 1971년에 발생한 규모 7의 지진으로 지진학적으로 활발한 지역으로 보고되고 있다(그림 2; Almendros et al., 2020). USGS (US Geological Survey)는 전 세계적으로 150여 곳의 GSN (Global Seismic Network) 지진관측소를 운영하면서 지진 관련 정보를 준실시간으로 제공하고 있으나, 남극반도 지역은 상시 지진관측이 가능한 관측소가 부족하여 규모 4 이하의 지진관측 및 보고가 매우 제한적이다. 하지만 최근 이 지역에서 수행된 광범위한 지진 관측연구(예, Dziak et al., 2010; Almendros et al., 2020) 결과, 매우 많은 수의 규모 4 이하 지진이 CBB 내 확장축을 따라 발생하고 있으며, 특히 해저화산을 중심으로 군발지진도 빈번하게 관측됨을 확인하였다. 일반적으로 해저면 지진계 및 수중음향관측망은 해저에서 발생하는 소규모 지구조 활동을 보다 민감하게 포착 가능하여(관측 범위 및 성능 향상) 이전에는 볼 수 없었던 현상을 관측한 것으로 판단된다. 단층면해(fault mechanism)가 제공된 지진의 경우 대부분 진원이 천부에 위치하고 있고 정단층 혹은 주향이동단층으로 결정되어 CBB 확장 가설을 뒷받침한다(Pelayo and Wiens, 1989; González-Casado et al., 2000). 또한 주변에 설치되어 운영중인 GPS 변동 자료를 살펴보더라도(Dietrich et al., 2001) 세종기지가 위치한 킹조지섬을 비롯한 남셰틀랜드 군도는 남극반도를 기준으로 북서 방향으로 매년 약 1 cm 가량 이동하는 전형적인 배호분지 확장 현상이 여전히 지속되고 있음을 확인할 수 있다.

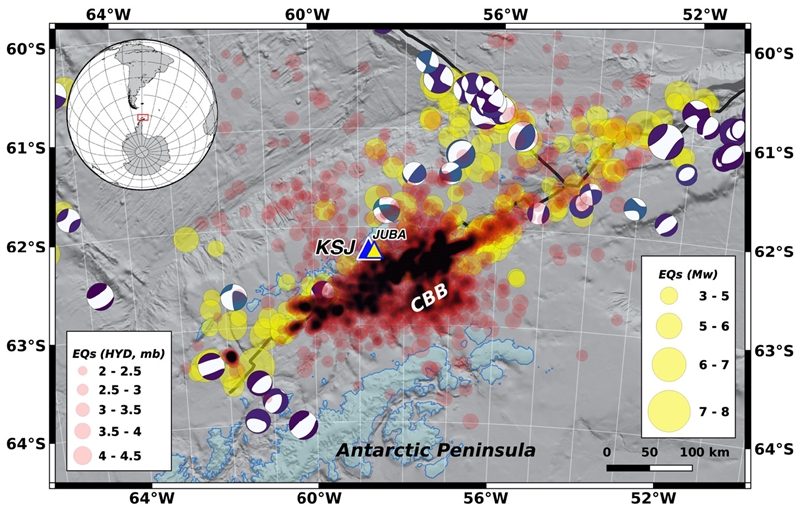
Historical seismicity (USGS; https://earthquake.usgs.gov/earthquakes/search; yellow circles) occurred in and around South Shetland Islands from 1964. Beachballs represent the Global Centroid Moment Tensor information (https://www.globalcmt.org). Most of earthquakes took place along the plate boundaries. KSJ and JUBA represent the King Sejong Station (Republic of Korea) and the Carlini Base (Argentina), respectively.
USGS가 이 지역에서 1964년 4월 19일 발생한 지진을 최초 보고한 이래 약 50여 년간 크고 작은 지진 활동이 이어졌으나 대부분 단발성 이벤트에 그쳤다. 하지만, 2020년 8월 29일 남극 세종과학기지 부근에서 발생한 규모 4.9 지진 이후 2021년 2월 12일까지 총 170차례 중규모 이상 지진이 지속적으로 발생(USGS, 2021)하였으며, 대부분의 지진이 기지로부터 약 30 km 떨어진 Orca 해저화산 부근에 집중되어 발생하는 등 매우 이례적인 지진활동이 관측되고 있다. 특히 2021년 1월 23일 발생한 규모 6.9 지진은 40여 년 만에 발생한 가장 큰 지진으로 기록되기도 하였다. 브랜스필드 해협 부근 남극반도 및 남셰틀랜드 군도에는 대한민국 남극과학기지인 세종기지를 비롯하여 약 40여 기지가 운영되고 있으며, 남극 하계연구활동 시기에는 수백에서 수천 명까지 상주하고 있어 지속적 지진 발생에 따른 위기감이 고조되고 있는 상황이다. 이 단보에서는 USGS에서 보고한 지진 발생 현황 및 아르헨티나 Carlini 기지에서 운영중인 JUBA 관측소 획득 자료를 초기 분석한 결과를 공유하고 국제협력 연구 가능성 및 진행 상황을 보고하고자 한다.
2. 지진 발생 현황
USGS에서 발표한 남셰틀랜드 군도 주변에서 발생한 지진의 위치를 살펴보면 주로 판경계부에 집중해 있으며, CBB 내부에는 별다른 지진 활동이 기록되지 않았다(그림 2). 하지만 이 지역에서 2005년 12월부터 2007년 12월까지 극지연구소가 미국해양대기청(National Oceanic and Atmospheric Administration; NOAA)과 국제협력을 통해 수행한 수중음향관측연구에 따르면 CBB 내 총 3,146번의 소규모 지진 활동(mb 2.0-4.5)이 해저 확장축을 따라 관측되었으며, 특히 해저화산 부근에서 군발지진이 발생(Dziak et al., 2010)하는 등 CBB 내 지체구조적 운동이 활발한 것으로 보인다(그림 3).
Earthquake locations (heatmap) determined by the Autonomous Underwater Hydrophone network conducted from December 2005 to December 2007 are overlaid with pinky circles (Dziak et al., 2010). Note that the acoustic source level for individual event is translated into the body wave magnitude (mb) ranging 2.0-4.5. There are a number of small events, which were previously not identified, occurred along the Bransfield Strait during the experiment period indicating a tectonically active region.
USGS에 따르면 2020년 8월 29일 12:47:03 (UTC)에 규모 4.9 지진이 발생한 이후 2021년 2월 13일 00:00:00까지 규모 4.0-6.9 지진이 총 170회 발생했으며, 이 지진들의 진원 위치를 기준으로, 세종과학기지 부근의 Orca 해저화산 주변 지진군과 이로부터 북동쪽으로 약 200 km 가량 떨어진 곳에서 발생한 지진군, 두 그룹으로 분류할 수 있다(그림 4). 대부분의 지진이 Orca 해저화산 부근에서 집중적으로 발생했으며, 주로 주향이동 단층으로 인한 지진 발생으로 보고되었다. 이곳에서 발생한 지진은 세종과학기지가 흔들릴 정도의 영향을 미쳤고, 기지 내 생활 중인 연구자들로 하여금 큰 불안감을 불러일으켜 지진 발생원인 규명 및 파급효과에 관한 관심이 고조되고 있다(https://imnews.imbc.com/replay/2020/nwdesk/article/5986856_32524.html).

A series of earthquakes occurring from 29 August 2020 to 12 February 2021 is presented by red circles. The heatmap indicates that most earthquake locations are concentrated near KSJ (dark reds). Moment tensors (GCMT) for major earthquakes are also plotted. There are two distinct clusters observed near KSJ and far northeast.
3. 관측 자료
지진은 주로 판경계부 혹은 판내부에서 발생하는데, 발생원인 등을 규명하기 위해서는 단층 등에 축적되고 있는 변형력(응력) 등을 면밀히 관측하여야 한다. 최근 지진 발생에 관한 연구의 동향을 살펴보면 육상 측위 및 인공위성 합성 개구 레이더(Syntheic Aperture Radar; Zhao et al., 2018) 등을 활용한 지진 발생 전후 지표 변형을 비교하여 지진 발생원인에 관한 보다 다학제적인 연구 활동이 이루어지고 있다. 이 장에서는 이번 연구에서 사용한 육상 측위 자료 및 실시간 지진관측 자료에 관하여 설명하고자 한다.
3.1 육상 측위 자료
남극 킹조지 섬 내의 GNSS(Global Navigation Satellite System) 상시 관측소는 우루과이 기지인 General Artigas Station (UYBA), 칠레 기지인 Base Presidente Eduardo Frei Montalva (FREI) 및 우리나라 세종과학기지에서 운영되고 있으며, 이 관측소들은 주요 진앙지로부터 약 30-50 km 떨어져 있다. 세종과학기지에서의 GNSS 관측소 자료는 현재 국토지리정보원에서 관리하고 있으나, 분석결과를 제공하고 있지 않아 이번 초기 연구에서는 사용하지 않았다. UYBA와 FREI의 GNSS 자료는 UNAVCO (http://www.unavco.org)나 MAGNET geodetic network (http://geodesy.unr.edu/magnet.php)을 통해 준실시간으로 배포되고 있으며, 24시간 및 5분 간격의 위치 정보를 제공한다(Blewitt et al., 2018). FREI 관측소는 1997년부터 2017년까지, UYBA 관측소는 2017년부터 현재까지 운영 중이다.
3.2 지진관측 자료
지진이 발생한 브랜스필드 해협 주변에는 남극 상주기지 및 연안 기반암 지역에 지진관측소가 설치되어 운영되고 있으나, 상시 관측소의 수가 적고 진원과의 거리가 멀어(>100 km) 소규모 군발지진의 정확한 위치결정 및 원인규명에 제한이 따른다. 현재 주요 진원지로 부터 300 km 이내에 위치하고 FDSN (International Federation of Digital Seismograph Networks)에 등록되어 IRIS (Incorporated Research Institutions for Seismology)로 자료가 실시간 전송되고 있는 지진관측소는 아르헨티나에서 운영하고 있는 Carlini Station (JUBA; 62.24ºS/58.66ºW)과 Esperanza Station (ESPZ; 63.40ºS/57.00ºW)이 유일하다. 분석에 사용된 자료는 세종과학기지와 인접한 JUBA 관측소의 수직 성분(BHZ; sampling rate: 20 Hz) 관측 자료이다.
4. 초기 분석결과
4.1 육상 측위 관측결과
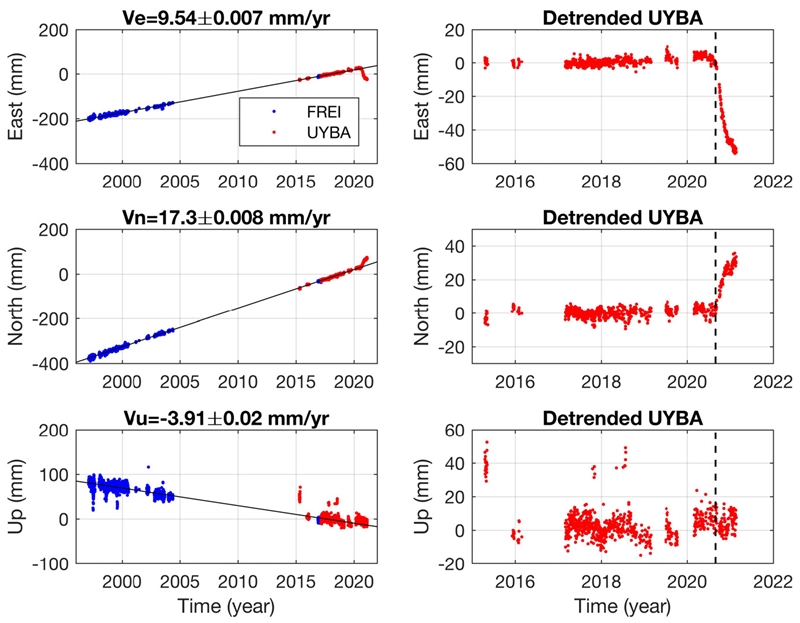
그림 5의 왼쪽 그림은 UYBA 및 FREI 관측소에서의 IGS14 (International Terrestrial Reference Frame 2014; Altamimi et al., 2016)를 기준으로 한 상대 위치 변화를 보여준다. 2020년 이전까지 두 관측소 모두 북동 방향으로 약 20 mm/yr의 속도로 이동하고 있으며, 평균 수평 이동속도는 19.8 mm/yr이다. 남극판을 기준으로 한 상대적 이동속도는 북서 방향으로 약 7.1 mm/yr이며, 이는 배호분지의 확장과 관련되어 있을 것으로 보인다. 그림 5의 오른쪽 그림은 평균 이동속도를 제거한 UYBA 관측소의 상대 위치 변화를 나타낸다. 브랜스필드 지진 발생 이후 2021년 2월까지 UYBA 관측소는 평균 수평 이동 성분에 대하여 서쪽으로 약 50 mm, 북쪽으로 약 30 mm 이동 중이다. 지진 발생 이후의 이동 방향은 2020년 이전까지 남극판을 기준으로 한 상대적 변위 방향과 유사하며, 이 방향성이 배호분지의 확장과 관련이 있다면, 2020년 발생한 지진의 원인 역시 배호분지의 확장과 관련이 있을 가능성이 높다. 2020년 지진 발생과 관련된 수평 변위는 8월경부터 시작되었으며, 10월경 가장 빠른 변위 속도에 도달하였고, 이 시기에는 서쪽으로 약 270 mm/yr, 북쪽으로 약 120 mm/yr의 속도로 이동하였다. 10월 이후로는 점진적으로 수평 이동 속도가 감속되고 있다. 이러한 사실로부터 CBB가 여전히 확장 진행중임을 확인할 수 있으나, 단발적 이동 현상인지 향후 지속적인 움직임을 보여줄지는 보다 장기적 관점에서 접근해야 할 사항이다. 수직 변위에서는 약간의 수직상승(약 5.6 mm)이 발생한 것으로 보이나, 연간 변화 등을 고려하였을 때 지진 관련 변위로 확신하기는 어렵다. 최근 지진 활동의 감소로 인하여 지진 변위(coseismic displacement)는 충분히 진행된 것으로 보이나, 여전히 향후 추가적인 지진 발생에 따른 변위와 지진 후 변위(postseismic displacement)의 양상에 주목할 필요가 있다.
4.2 지진관측 결과
2020년 8월 29일 지진 규모(Mw) 4.9 지진이 남극반도 브랜스필드 해협에서 발생(62.44ºS/58.18ºW)한 이래 2021년 2월 12일까지 총 170 차례 크고 작은 지진(4.0-6.9)이 지속적으로 발생하고 있다(USGS, 그림 4). 군발지진이 세종과학기지 부근에서 집중적으로 발생하고 있으며, 2021년 1월 23일 발생한 규모(Mw) 6.9 지진이 북동쪽 지역에서 발생하고 수차례 여진이 이어지고 있다. 그림 4와 같이 크게 두 부류의 군발지진이 형성되었고, 세종과학기지 부근 발생 지진은 대부분 주향이동단층의 단층면해를 보여준다. 기지 주변 발생 지진은 주로 Orca 해저화산 주변에서 발생하여 화산활동과 밀접한 연관성을 유추할 수 있으나, 추가 자료를 확보하여 보다 면밀한 분석을 수행할 필요가 있다.
연구대상 기간 중 발생하여 JUBA 관측소에 기록된 대표적 두 지진(진원시: 2020년 8월 29일 12:47:03, 2021년 1월 23일 23:36:51)을 보다 상세히 살펴보고자 주파수 분석 및 지진에너지 방출에 관한 분석을 실시하였다(그림 6). 그림 6a 상단 지진 파형(0.5-5 Hz 대역필터 적용) 및 가운데 스펙트로그램에서 확인 가능한 바와 같이 USGS에서 보고한 첫 번째 발생 지진 이전에도 이미 다수의 소규모 지진이 발생하여 기록되었고, 흥미로운 점은 주파수 대역을 살펴보면 harmonic 성분(1, 3, 4 Hz)이 뚜렷하게 관찰되는데, 이는 해저화산 활동 시 관찰되는 현상 중 하나로(Dziak and Fox, 2002), 해당 지진과 Orca 해저화산 활동과의 연관 가능성을 유추해 볼 수 있다. 그림 6a, 6b 하단은 2020년 8월부터 2021년 2월까지 보고된 지진 활동을 규모와 함께 도시하였다. GPS 관측 분석결과와 마찬가지로 지진 활동이 11월에 들어서면서 급격히 감소하는 양상을 보여주고 있다. 그 이후 1월 중순까지 소강상태를 유지하다 1월 23일에는 최근 40여 년 사이 가장 큰 규모(Mw 6.9)의 지진이 Orca 해저화산으로부터 북동쪽으로 약 200 km 떨어진 곳에서 발생하였다. 빨간색으로 표현된 누적 지진에너지 방출량은 경험식 log E = 1.5 Mw + 4.8 (Kanamori and Anderson, 1975; Bormann and Di Giacomo, 2011)으로 산출되었으며, Mw 규모가 발표된 지진에 한정하여 계산을 수행하였다. mb 규모로 보고된 지진의 경우에는 대부분 규모 4.5 미만에 해당하여 초기 분석 시 누적 에너지 추세 변동에 큰 영향을 미치지 않아 배제하였다.
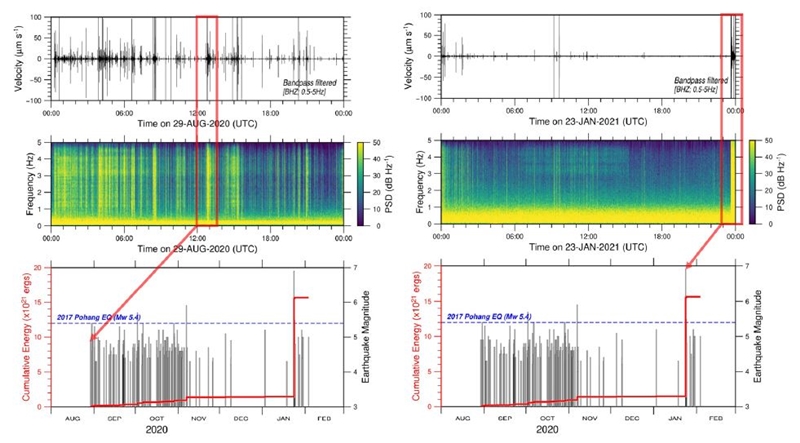
(Top) Bandpass-filtered (0.5-5 Hz) seismograms for (a) 29 August 2020 (Mw 4.9) and (b) 23 January 2021 (Mw 6.9) events recorded by JUBA. Corresponding events are indicated by red boxes. (Middle) Spectrograms for each earthquake. (Bottom) Cumulative seismic energy over time and earthquake magnitudes. For a reference, the Pohang earthquake (15 November 2017, Mw 5.4) is marked by a dashed blue line.
CBB는 중·소규모 지진이 판 경계부 혹은 해저 확장축을 따라 위치한 해저화산 지역 부근에서 발생(Dziak et al., 2010; Almendros et al., 2020)하는 등 비교적 복잡한 지체구조적 특성을 보이는 영역이다. 이러한 지역에서 수 개월간 이어지고 있는 군발지진의 발생 기원을 추정하고 해저 화산활동과의 연관성을 규명하기 위해서는 단층면해 해석이 요구된다. 이를 위해 USGS로부터 단층면해가 제공된 27개 지진을 대상으로 단층면해 분류(FMC, Focal Mechanisms Classification; Álvarez-Gómez, 2019)를 적용하였다. 그림 7에서 확인할 수 있는 바와 같이 대부분의 지진이 주향이동단층 활동에 의해 발생하였으며 몇몇 정단층에 의한 지진 발생도 관찰된다. FMC 패키지에서 제공하는 보상선벡터 쌍극자(CLVD, compensated linear vector dipole) 비율 자료를 살펴보면, 그림 7 오른쪽 ‘fclvd (CLVD raito; pure double-couple과의 차이를 수치화한 자료)’ 항목에서 노란색(~0)으로 갈수록 이중짝힘(double-couple) 지진원에 가깝고 색이 진해질수록 CLVD 비율이 높아진다. 분석에 사용된 27개 지진의 경우 fclvd 값이 0.07-36% 범위이며 대부분이 약 5% 미만에 해당하는 값을 보이지만, 10%를 초과하는 4건의 지진 발생은 해저화산 활동에 따른 부피 변화와 연관성이 있을 가능성도 있다. 여전히 보다 자세하고 정확한 지진원 특성 규명을 위해서는 추가 자료 확보를 통한 분석이 반드시 필요하다.
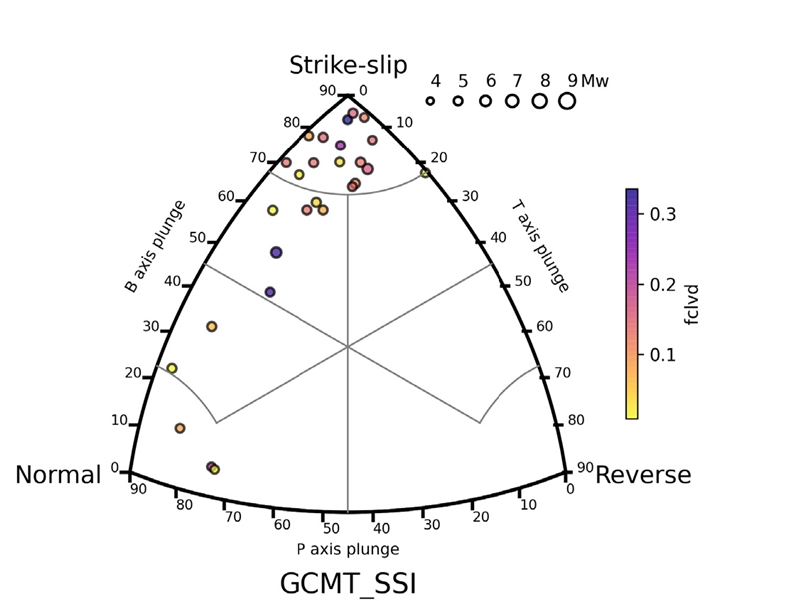
Focal mechanism classification diagram with the compensated linear vector dipole (CLVD) ratio. Many earthquakes are classified as strike-slip events and some are normal. Most events seem to be generated from double-couple sources from an initial interpretation.
USGS에서 공식적으로 제공하는 지진 목록은 대부분 규모 4.0 이상의 지진 자료만 수록하고 있어 이를 활용하여 지진 발생 및 진행에 관하여 전반적으로 이해하기에는 한계가 따른다. 보다 구체적인 연구수행을 위해서는 진원지 부근에서 운영되고 있는 관측 자료의 추가 확보를 통한 재분석이 필요하나, 자료 확보를 위해서는 남극 현장 관측소 직접 방문이 필수적이다. 이 연구에서는 규모가 작은 미소규모 지진을 탐지하기 위해 IRIS에서 제공하는 준실시간 자료 중 진원지에서 가장 가까운 JUBA 관측소 자료(BHZ)만을 사용하였다. 대역필터(0.5-5 Hz)를 통과한 자료(그림 8, 빨간색 지진파형)에 지진 발생 시점을 자동으로 탐지하는데 가장 손쉽게 활용되는 STA/LTA 방법(short window: 1.0 sec, long window: 45.0 sec, threshold: 25)을 적용하였다. 그림 8은 일간 지진 발생(위, 검정색 히스토그램) 및 시간당 지진 발생(아래, 파란색 히스토그램)을 도시하였다. 총 34,101건의 크고 작은 지진이 포착되었고 대부분의 지진이 11월 초까지 일간 100건 이상 발생하다 점차 감소하는 경향을 확인할 수 있다. 이는 앞서 살펴보았던 GPS 관측 및 USGS 제공 자료 분석결과와 잘 일치한다. 단층면해 분류 초기 분석에 의하면 중규모 지진 대부분이 주향이동단층의 움직임에 의해 발생되었다고 판단(그림 8)되나, 발생 위치(그림 4, Orca 해저화산 부근)를 고려하면 해저 화산활동과의 연관성을 완전히 배제하기도 어려운 상황이다. 일반적으로 해저 화산활동은 조석에 의한 영향을 받기도 한다(Tolstoy et al., 2002). 해저 화산체에 가해지는 수직 응력은 조수의 높낮이에 의한 함수이며 브랜스필드 해협이 위치한 남극반도 지역은 남극에서 조수의 높낮이 차가 비교적 큰 곳 중 하나이므로(Egbert and Erofeeva, 2002) 조석에 따른 지진 활동성을 비교하는 것도 지진발생 원인을 규명하는데 도움이 될 수 있다. Orca 화산 부근(62.35ºS/58.2ºW)에서의 조수 높낮이 정보를 TMD 소프트웨어(https://www.esr.org/research/polar-tide-models/tmd-software/)에서 제공하는 2 km 공간 해상도를 가지는 남극반도 모델을 활용하여 추출하였다(그림 8 하단 회색 곡선). 주로 해수면이 하강할 때 해저면에 가해지는 수직 응력이 감소하여 해저 화산활동이 촉발되곤 하는데, 2020년 8월-11월 사이에는 시각적으로 부분적인 상관성이 있어 보이기도 하지만, 여전히 통계적 분석을 통한 정량적 해석이 추가로 필요한 부분이다.
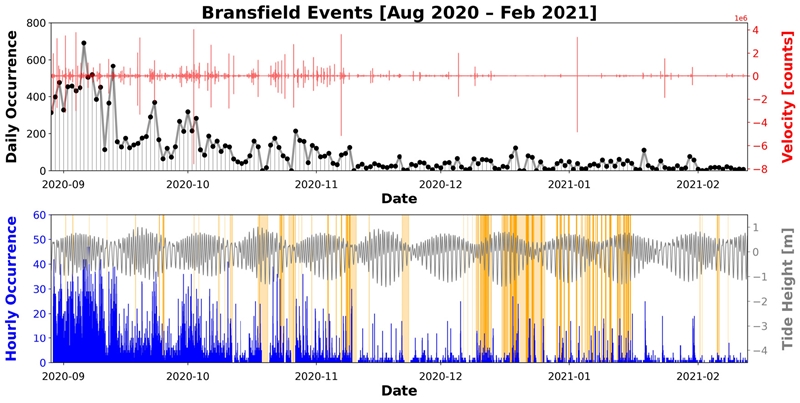
Daily (upper) and hourly (lower) occurrences during the period detected by applying the STA/LTA algorithm. In total, 34,101 events are detected. Most of the events took place at the early stage. The number of occurrences decreases as time goes by, but it seems to be still active. A band-pass filtered (0.5-5 Hz) seismogram is shown in red at the upper panel. Tide height was also plotted on the lower panel for a quick comparison. Data gaps are shown by the shaded orange color.
5. 제 언
이 단보의 목적은 2020년 8월 29일 이후 지금까지 지속적으로 발생하고 있는 남극 브랜스필드 해협 지진 발생의 원인규명 및 관련 연구에 관한 진행과정 등에 관한 전반적 이해를 지진학적 관점에서 상세한 분석을 통해 증진하는데 있다기 보다는, 지진발생 현황을 빠르게 전파하여 남극세종과학기지를 비롯한 40여 남극기지에서 상주하고 있는 연구진의 불안감을 완화하고 선제적 안전대책 마련을 촉진하는데 있다. 이 일련의 지진 활동에 관한 지구물리학적 접근 및 남극 기지운영상 안전성 제고 측면에서 다음과 같은 국제협력 활동을 제안하고자 한다.
1) IRIS에서 제공하는 준실시간 자료 외에 이탈리아, 스페인 등 인근 기지 및 야외에 설치하여 운영하고 있는 지진관측망 자료 획득 및 공유 방안 마련
2) 준실시간 자료 전송이 가능한 관측망 확대로 킹조지섬 지진 조기경보 체계 구축
3) 추가 자료 확보 및 상세 분석으로 지진목록 완결성 향상
4) 연구선 혹은 무인잠수정을 활용하여 Orca 해저화산 지역 정밀 해저지형도 작성으로 지진 발생 위치 특정 및 지진 발생에 따른 지표 변형 현상 관찰
5) 특이 지진 발생 원인규명을 위하여 지속적으로 지진이 발생하고 있는 Orca 해저화산 및 이곳으로부터 북동쪽으로 200 km 떨어져 있는 또 하나의 지진 발생 지역을 대상으로 장기 해저면지진계 관측 실시 및 확대
상기 내용은 남극이라는 특수성을 고려하면 신뢰를 바탕으로 한 적극적인 국제협력이 수반되어야 하며, 도출될 결과는 이례적 지진 활동 규명에 따른 새로운 학문적 발견뿐만 아니라 이역만리 혹한 환경에서 고군분투하고 있는 자국민 안전확보 측면에서도 크게 기여할 것으로 기대한다.
Acknowledgments
이 연구는 해양수산부 R&D 연구과제(PM21020; KIMST20190361) 및 극지연구소 정책연구과제(PE21390)의 지원을 받아 수행되었습니다.
References
-
Almendros, J., Wilcock, W., Soule, D., Teixidó, T., Vizcaíno, L., Ardanaz, O., Granja-Bruña, J.L., Martín-Jiménez, D., Yuan, X., Heit, B., Schmidt-Aursch, M.C., Geissler, W., Dziak, R., Carrión, F., Ontiveros, A., Abella, R., Carmona, E., Agüí-Fernández, J.F., Sánchez, N., Serrano, I., Davoli, R., Krauss, Z., Kidiwela, M. and Schmahl, L., 2020, BRAVOSEIS: Geophysical investigation of rifting and volcanism in the Bransfield strait, Antarctica. Journal of South American Earth Sciences, 104, 102834.
[https://doi.org/10.1016/j.jsames.2020.102834]

-
Altamimi, Z., Rebischung, P., Métivier, L. and Collilieux, X., 2016, ITRF2014: A new release of the International Terrestrial Reference Frame modeling nonlinear station motions. Journal of Geophysical Research: Solid Earth, 121, 6109-6131.
[https://doi.org/10.1002/2016JB013098]

-
Álvarez-Gómez, J.A., 2019, FMC-Earthquake focal mechanisms data management, cluster and classification. SoftwareX, 9, 299-307.
[https://doi.org/10.1016/j.softx.2019.03.008]

-
Barker, D.H.N. and Austin, Jr., J.A., 1998, Rift propagation, detachment faulting, and associated magmatism in Bransfield Strait, Antarctic Peninsula. Journal of Geophysical Research: Solid Earth, 103(B10), 24017-24043.
[https://doi.org/10.1029/98JB01117]

-
Blewitt, G., Hammond, W.C. and Kreemer, C., 2018, Harnessing the GPS Data Explosion for Interdisciplinary Science. EOS, 99.
[https://doi.org/10.1029/2018EO104623]

-
Bormann, P. and Di Giacomo, D., 2011, The moment magnitude Mw and the energy magnitude Me: common roots and differences. Journal of Seismology, 15, 411-427.
[https://doi.org/10.1007/s10950-010-9219-2]

-
Christeson, G.L., Barker, D.H.N., Austin Jr., J.A. and Dalziel, I.W.D., 2003, Deep crustal structure of Bransfield Strait: Initiation of a back arc basin by rift reactivation and propagation. Journal of Geophysical Research: Solid Earth, 108(B10).
[https://doi.org/10.1029/2003JB002468]

-
Dietrich, R., Dach, R., Engelhardt, G., Ihde, J., Korth, W., Kutterer, H.J., Lindner, K., Mayer, M., Menge, F., Miller, H., Müller, C., Niemeier, W., Perlt, J., Pohl, M., Salbach, H., Schenke, H.W., Schöne, T., Seeber, G., Veit, A. and Völksen, C., 2001, ITRF coordinates and plate velocities from repeated GPS campaigns in Antarctica - an analysis based on different individual solutions. Journal of Geodesy, 74, 756-766.
[https://doi.org/10.1007/s001900000147]

-
Dziak, R.P. and Fox, C.G., 2002, Evidence of harmonic tremor from a submarine volcano detected across the Pacific Ocean basin. Journal of Geophysical Research: Solid Earth, 107(B5), ESE 1-1-ESE 1-11.
[https://doi.org/10.1029/2001JB000177]

-
Dziak, R.P., Park, M., Lee, W.S., Matsumoto, H., Bohnenstiehl, D.R. and Haxel, J.H., 2010, Tectonomagmatic activity and ice dynamics in the Bransfield Strait back-arc basin, Antarctica. Journal of Geophysical Research: Solid Earth, 115(B1).
[https://doi.org/10.1029/2009JB006295]

-
Egbert, G.D. and Erofeeva, S.Y., 2002, Efficient Inverse Modeling of Barotropic Ocean Tides. Journal of Atmospheric and Oceanic Technology, 19, 183-204.
[https://doi.org/10.1175/1520-0426(2002)019<0183:EIMOBO>2.0.CO;2]

-
González-Casado, J.M., Robles, J.L.G. and López-Martí nez, J., 2000, Bransfield Basin, Antarctic Peninsula: Not a normal backarc basin. Geology, 28, 1043-1046.
[https://doi.org/10.1130/0091-7613(2000)028<1043:BBAPNA>2.3.CO;2]

-
Grad, M., Guterch, A. and Janik, T., 1993, Seismic structure of the lithosphere across the zone of subducted Drake plate under the Antarctic plate, West Antarctica. Geophysical Journal International, 115, 586-600.
[https://doi.org/10.1111/j.1365-246X.1993.tb01209.x]

- Kanamori, H. and Anderson, D.L., 1975, Theoretical basis of some empirical relations in seismology. Bulletin of the Seismological Society of America, 65, 1073-1095.
-
Larter, R.D. and Barker, P.F., 1991, Effects of ridge crest-trench interaction on Antarctic-Phoenix Spreading: Forces on a young subducting plate. Journal of Geophysical Research: Solid Earth, 96(B12), 19583-19607.
[https://doi.org/10.1029/91JB02053]

- Lawver, L.A., Sloan, B.J., Barker, D.H.N., Ghidella, M., Von Herzen, R.P., Keller, R.A., Klinkhammer, G.P. and Chin, C.S., 1996, Distributed, Active Extension in Bransfield Basin, Antarctic Peninsula: Evidence From Multibeam Bathymetry. GSA Today, 6, 1-11.
-
Lee, D.K., Jin, Y.K., Kim, Y. and Nam, S.H., 2000, Seismicity and tectonics around the northern Antarctic Peninsula from King Sejong station data. Antarctic Science, 12, 196-204.
[https://doi.org/10.1017/S0954102000000250]

-
Pelayo, A.M. and Wiens, D.A., 1989, Seismotectonics and relative plate motions in the Scotia Sea region. Journal of Geophysical Research: Solid Earth, 94(B6), 7293-7320.
[https://doi.org/10.1029/JB094iB06p07293]

-
Robertson Maurice, S.D., Wiens, D.A., Shore, P.J., Vera, E. and Dorman, L.M., 2003, Seismicity and tectonics of the South Shetland Islands and Bransfield Strait from a regional broadband seismograph deployment. Journal of Geophysical Research: Solid Earth, 108(B10).
[https://doi.org/10.1029/2003JB002416]

-
Tolstoy, M., Vernon, F.L., Orcutt, J.A. and Wyatt, F.K., 2002, Breathing of the seafloor: Tidal correlations of seismicity at Axial volcano. Geology, 30, 503-506.
[https://doi.org/10.1130/0091-7613(2002)030<0503:BOTSTC>2.0.CO;2]

- USGS, 2021, https://earthquake.usgs.gov/earthquakes/search, (February 13, 2021).
-
Zhao, D., Qu, C., Shan, X., Gong, W., Zhang, Y. and Zhang, G., 2018, InSAR and GPS derived coseismic deformation and fault model of the 2017 Ms7.0 Jiuzhaigou earthquake in the Northeast Bayanhar block. Tectonophysics, 726, 86-99.
[https://doi.org/10.1016/j.tecto.2018.01.026]


