
한반도 지각 구조 상세화 연구의 동향과 쟁점

초록
본 논평에서는 한반도 지각 속도 구조 상세화 연구의 동향과 쟁점을 개괄하였다. 지진 파형에는 지진원, 전파 매질, 관측소 부지, 계기응답 및 잡음의 영향에 관한 정보가 포함되어 있으며, 이 가운데 전파 매질 정보를 이용해 지진파 속도의 공간 분포 모델을 개발하는 과정을 지각 구조 상세화로 정의하였다. 한반도 속도 구조 모델은 주시 분석, 주시 토모그래피, 수신 함수 분석, 표면파 분산 분석, 배경 잡음 토모그래피 등 다양한 전통적 기법을 통해 발전해 왔으며, 최초의 1D 모델 이후 지진 관측망 확충과 계산 기술 발달에 힘입어 1D에서 2D, 3D로, 그리고 남한 내륙 중심에서 북한·제주도 등 주변 지역으로 연구 범위가 확장되어 왔다. 지각 규모 굴절파 실험과 같은 임시 관측망 자료 역시 지각 구조 규명에 활용되었다. 최근에는 파형 전체 정보를 활용하는 파형 역산법과 독립형 지오폰(노드) 기반 고밀도 탐사를 통한 고해상도 모델 개발이 주요 발전 방향으로 부상하고 있으며, 이와 함께 이용 가능한 기존 및 신규 모델을 체계적으로 축적·공유하기 위한 데이터베이스 구축도 이루어지고 있다. 그러나 지진 재해 평가에 중요한 천부 지각 구조의 해상도는 여전히 제한적이며, 이방성 및 감쇠 모델의 정교화도 향후 과제로 남아 있다. 천부 모델 개선을 위해서는 고주파수 지진파 자료의 활용과 고밀도 탐사 자료와 광역 모델의 통합이 필요하며, 이를 통해 보다 현실적인 지진동 모사와 지진 재해 저감에 기여할 수 있을 것으로 기대된다.
Abstract
This paper reviews trends and issues in research on the detailed crustal structure of the Korean Peninsula. Seismic waveforms recorded by seismometers contain contributions from the earthquake source, propagation medium, station-site effects, instrument response, and noise. In this paper, high-resolution crustal-structure studies are defined as the development of spatial seismic-velocity models using information on the propagation medium. Velocity structure models for the Korean Peninsula have been developed using a range of conventional techniques, including travel-time analysis, travel-time tomography, receiver function analysis, surface-wave dispersion analysis, and ambient-noise tomography. Since the first 1D model, advances in seismic network density and computational capability have driven progress from 1D to 2D and 3D models, and have expanded the study area from the South Korean mainland to North Korea and Jeju Island. Temporary-network data, such as crustal-scale refraction experiments, have also contributed to constraining crustal structure. More recently, full-waveform inversion methods and high-resolution imaging using dense nodal geophone arrays have emerged as key directions for future development. Efforts are also underway to archive and disseminate available models through an online database. Nonetheless, the resolution of shallow crustal structure-critical for seismic hazard assessment-remains limited, and further refinement of anisotropy and attenuation models is needed. Improving shallow-crustal models will require the incorporation of high-frequency seismic data and the integration of dense-array survey results with regional-scale models. These advances are expected to enable more realistic ground-motion simulations and contribute to seismic hazard mitigation.
Keywords:
crustal structure of the Korean Peninsula, seismic velocity model, waveform inversion, ambient noise tomography, receiver functions키워드:
한반도 지각 구조, 지진파 속도 모델, 파형 역산, 배경 잡음 토모그래피, 수신 함수1. 서 론
지진학은 지진과 그로 인한 지진파(탄성파)의 발생, 전파, 그리고 영향을 연구하는 지구물리학의 한 분야이며, 대부분의 연구에서 지진계에 기록된 지진관측 파형을 기본적인 연구 자료로 사용한다. 지진계에 기록된 지진 파형에는 지진원, 전파 매질, 관측소 부지, 계기응답 및 잡음의 영향이 포함되어 있다. 계기응답은 알려진 정보를 이용하여 보정할 수 있으며, 보정된 파형을 분석하면 지진원과 전파 매질의 특성을 추정할 수 있다. 이 가운데 전파 매질에 관한 정보를 이용하여 지진파에 영향을 미치는 물리적 특성의 공간 분포를 규명하는 과정을 지각 구조 상세화로 정의할 수 있다. 이러한 물리적 특성에는 지진파 속도, 밀도, 임피던스, 이방성, 감쇠 등이 포함된다. 본 논평에서는 이 가운데 지각 구조 연구의 핵심적인 물리량인 지진파 속도 구조 모델을 중심으로 논의하고자 한다.
지진파 속도 구조 모델은 연구 목적과 자료 분포에 따라 1D, 2D 또는 3D 형태로 표현되며, 3D 모델의 경우 공간에 따른 P파 속도(Vp)와 S파 속도(Vs)의 분포로 나타난다. Vp와 Vs는 매질의 탄성계수와 밀도에 의해 결정되며, 암석 조성, 온도, 압력, 공극률, 균열 및 유체의 영향을 받는다. 따라서 속도 구조 모델은 지각 두께와 암석학적·열적 상태를 제약하고 지각 진화 과정을 이해하는 데 중요한 정보를 제공한다. 다만 서로 다른 물리적 요인이 유사한 속도 변화를 유발할 수 있으므로, 구체적인 지질학적 해석에는 다른 지질·지구물리 자료와의 종합이 필요하다.
탄성파 전파를 설명하는 이론적 토대는 19세기에 정립되었으며, 이후 수치해석 기법과 컴퓨터 기술의 발전으로 복잡한 매질에서의 지진파 전파를 계산할 수 있게 되었다. 앞서 언급한 바와 같이 지진파형에는 지진원과 매질에 대한 정보가 포함되어 있고, 지진파 속도 구조 모델은 매질 정보를 담고 있다. 따라서 지진파 속도 구조 모델이 있으면 크게 두 가지 연구를 수행할 수 있으며, 두 가지 모두 속도 구조 모델의 정확도가 연구 결과에 큰 영향을 주게 된다.
첫 번째는 지진파형에서 속도 구조 모델과 전파 이론을 이용하여 매질의 영향을 보정하고 지진원 정보를 추정하는 것이다. 간단한 예로 지진파의 전파 속도를 알고 있으면 지진계에 기록된 지진파의 도달시간으로부터 지진의 발생 위치와 발생 시각을 계산할 수 있다. 두 번째는 지진원 정보를 알고 있을 경우, 속도 구조 모델을 이용한 수치 계산을 통해 원하는 위치의 지진동을 계산하는 것이다. 이때 지진원은 이미 발생한 지진이 될 수도 있고, 아직 발생하지 않았지만 향후 발생할 수 있는 지진 시나리오가 될 수도 있다. 특정 위치의 지진동을 정확하게 계산하는 일은 지진 피해를 예측하고 저감 대책을 수립하는 데 필수적이다.
그림 1은 Song et al. (2022)에서 사용한 한반도 남부의 1D 및 3D 속도 구조 모델을 바탕으로 국내에서 발생한 지진의 합성 파형을 계산하고, 이를 관측 파형과 비교한 예이다. 관측 파형과 3D 속도 구조 모델로 계산한 합성 파형은 전반적으로 유사한 반면, 1D 모델로 계산한 파형은 일부 성분에서 도달시간, 진폭 및 파형 형태에 상대적으로 큰 차이를 보인다. 이는 지진원 매개변수의 추정과 지진파 전파 모사에서 3D 속도 불균질성을 고려하는 것이 중요함을 보여준다.
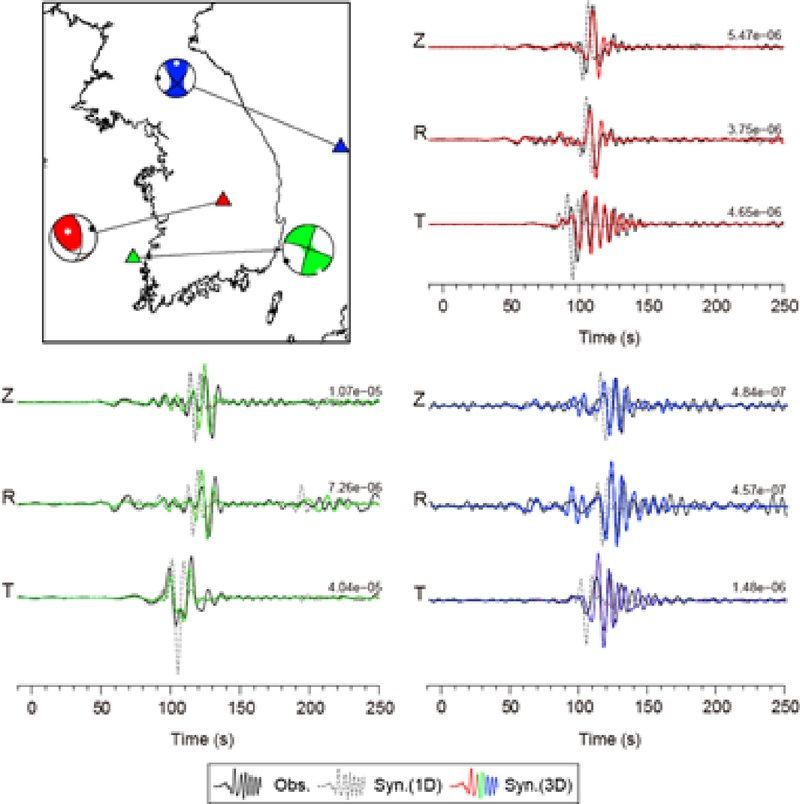
Comparison of observed and synthetic three-component waveforms for three earthquakes in South Korea. Synthetic waveforms were newly calculated using the one-dimensional and three-dimensional velocity models described in Song et al. (2022). Black traces show the observations, gray traces show synthetics calculated using the 1-D model, and the colored traces show synthetics calculated using the 3-D model for the corresponding event-station pairs. Triangles mark station locations, and focal-mechanism solutions are plotted at the earthquake epicenters. Z, R, and T denote the vertical, radial, and transverse components, respectively.
2. 지각 속도 구조 연구 방법과 한반도 속도 구조 모델의
지진파 속도 구조 모델 개발에는 다양한 방법이 사용된다. 가장 직관적인 방법은 지진파형에서 지진원 정보를 적절히 설정하거나 보정한 뒤, 선택한 시간창과 주파수 대역에 포함된 위상과 진폭 정보를 이용하여 매질의 속도 구조를 결정하는 파형 역산 방법이다. 파형 역산의 이론적 기반은 1980년대에 제시되었으나, 대규모 3D 탄성파 전파 계산과 수반법을 이용한 지역 규모의 적용은 계산 자원의 발전과 함께 2000년대 이후 본격화되었다(e.g., Tarantola, 1984; Tromp et al., 2005). 이를 이용하여 지각 구조를 영상화한 대표적인 사례로는 캘리포니아 남부 지역에 대한 Tape et al. (2009)의 연구가 있다.
전체 파형을 이용하는 방법이 개발되기 전에는 지진파형으로부터 유용한 정보들을 먼저 추출하고 이를 이용하여 속도 구조 모델을 개발하는 방법들이 주로 사용되었으며, 이러한 방법들은 계산 비용과 자료의 요구량, 해석의 직관성 등에서 장점이 있기 때문에 현재도 많이 사용되고 있다. 전통적으로 사용되는 방법 중 한반도 지각 속도 구조 모델 개발에 많이 활용된 방법으로는 주시 분석, 표면파 분산 분석, 수신 함수 분석, 주시 토모그래피, 배경 잡음 토모그래피 등이 있으며 이해를 돕기 위해 국내에서 이루어진 대표적인 연구 결과들을 소개하기 전에 각 방법에 대해 간단한 설명을 하고자 한다.
2.1. 주시 분석
지구 내부의 지진파 속도 변화와 불연속면에서의 반사(reflection), 굴절(refraction) 및 전환(conversion)으로 인하여 지진계에 도달하는 다양한 위상의 지진파 주시(travel time)가 달라지기 때문에 여러 관측소에 기록된 주시 자료를 분석하면 매질의 속도 구조를 계산할 수 있다. 주시를 이용하여 지각의 속도 구조를 계산한 가장 유명한 연구로는 1909년에 이루어진 모호로비치치의 모호면 발견이 있다. 이 연구를 통해 지각 하부에 지진파 속도가 급격히 증가하는 불연속면이 존재한다는 사실이 밝혀졌으며, 이후 이 불연속면은 지각과 맨틀의 경계인 모호면으로 해석되었다. 모호면 발견 이후 주시 분석은 지구 내부 구조를 탐구하는 핵심적인 방법으로 자리 잡았다. 주시 분석에는 자연 지진과 인공 지진 모두 사용될 수 있으며, 대표적인 지각 구조 연구로는 1984년부터 2005년까지 약 20년 동안 캐나다에서 진행된 지각 탐사 프로젝트인 Lithoprobe가 있다(Hammer et al., 2010).
2.2. 주시 토모그래피
Aki and Lee (1976)의 연구는 근거리 지진의 초동 P파 주시를 이용하여 3D 속도 이상을 영상화한 선구적인 연구로, 현대적인 근거리 지진 토모그래피의 발전에 중요한 기반을 제공하였다. 지진파의 주시는 전파 경로와 경로상의 속도 분포에 따라 결정되기 때문에 다양한 전파 경로를 통과해온 지진파의 주시를 종합 분석하면 속도의 공간적 분포를 계산할 수 있다. 초기에는 속도 분포를 블록 형태로 설정하고 지진파가 직선 경로를 따라 전파된다고 가정하는 단순한 방식이 사용되었지만, 파선 추적법 및 역산 기법의 발전을 통해 현재는 3D 모델에서의 복잡한 속도 변화를 반영하는 모델들이 개발되고 있다. 주시 토모그래피는 두 시추공 사이의 속도 구조 모델 개발에서부터 전 지구 스케일의 모델 개발까지 다양하게 적용될 수 있지만, 지각 규모에서는 근거리 지진 자료를 이용하는 근거리 지진 토모그래피(local earthquake tomography) 방법이 주로 사용된다.
2.3. 수신 함수 분석
수신 함수 방법은 지진파가 지구 내부를 전파할 때 지각과 맨틀의 경계인 모호면과 같은 불연속면에서 P파의 일부가 S파로(혹은 S파가 P파로) 변환되는 특성을 이용하여 지하의 속도 구조, 특히 불연속면의 구조를 분석하는 방법이다. 주로 사용되는 P파 수신 함수 방법을 예로 원리를 설명하면 다음과 같다. 지진에서 발생하여 지진계에 도달한 P파와 전파되는 도중 불연속면에서 S파로 변환되어 지진계에 도달하는 파 사이에는 시간 차가 발생하게 된다. 방사 성분에서 수직 성분을 디컨볼루션하여 P파 수신 함수를 계산한다. 이 과정에서는 두 성분에 공통으로 포함된 지진원 시간 함수와 먼 전파 경로의 영향이 대체로 억제되고, 관측소 하부에서 생성된 P-S 변환파 신호가 상대적으로 강조된다. 수신 함수 해석은 1970년대에 제안되었으며, Langston (1979)에 의해 체계적으로 정립되었다. 수신 함수 역산을 통하여 관측소 하부의 1D 속도 구조를 직접 결정하거나 Zhu and Kanamori (2000)가 제안한 직접 변환파와 다중반사파의 중합 기법을 이용하여 Vp/Vs와 지각 두께를 동시에 추정하는 방법이 널리 사용된다. 그림 2는 합성 수직 및 방사 성분으로부터 계산한 P파 수신 함수의 예로, 디컨볼루션을 통해 직접 변환파와 지각 다중반사파가 상대적으로 강조되는 것을 보여준다.
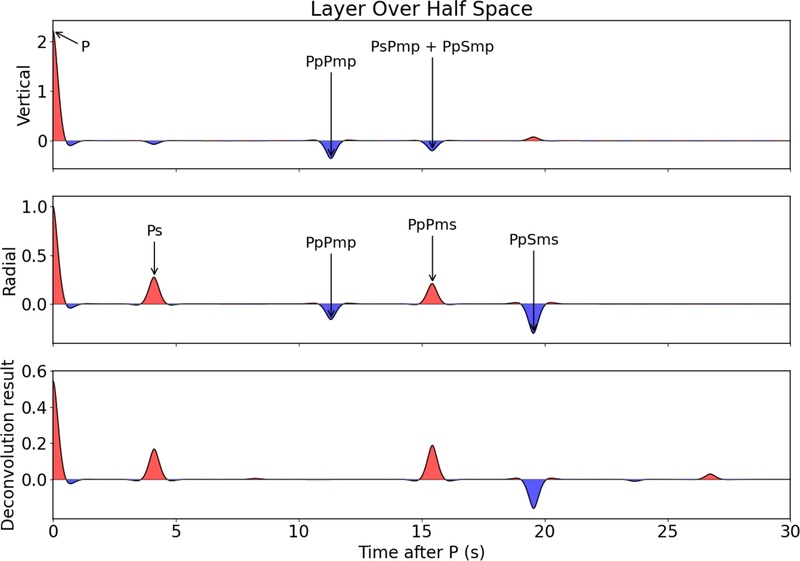
Example of a P-wave receiver function calculated from synthetic waveforms using the 1-D velocity model of Lee (1979). The direct Ps conversion and crustal multiples, including PpPms and PpSms, are indicated.
2.4. 표면파 분산 분석
표면파 분산(surface-wave dispersion)은 지각과 상부 맨틀의 지진파 속도 구조 연구에 널리 사용되는 자료이다. 표면파는 주기에 따라 지하 구조에 민감한 깊이가 달라지며, 일반적으로 짧은 주기의 표면파는 천부 구조에, 긴 주기의 표면파는 더 깊은 구조에 영향을 받는다. 이로 인해 표면파의 군속도(group velocity)와 위상속도(phase velocity)가 주기에 따라 달라지며, 이러한 현상을 분산이라고 한다. 그림 3은 합성 Rayleigh 파 기본모드의 위상속도와 군속도 분산 곡선의 예를 보여준다.
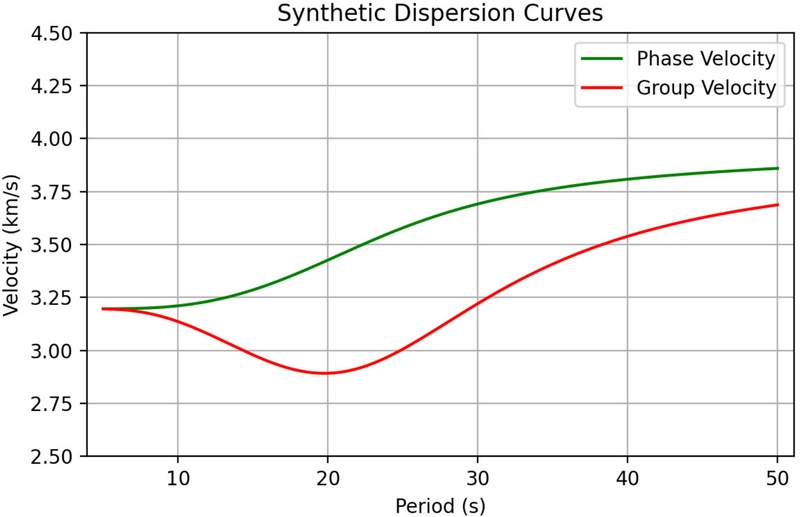
Synthetic fundamental-mode Rayleigh-wave phase- and group-velocity dispersion curves calculated using the 1-D velocity model of Lee (1979).
여러 주기에서 측정한 군속도 또는 위상속도로 분산 곡선을 구성하고 이를 역산하면 깊이에 따른 지진파 속도 구조, 특히 전단파 속도 구조를 추정할 수 있다. 이때 속도 구조에 대한 깊이별 민감도와 해상 가능한 깊이 범위는 사용한 분산 자료의 주기 범위에 의해 제한되며, 제한된 주기 대역에서는 서로 다른 속도 구조가 유사한 분산 특성을 나타낼 수 있다. 따라서 수신 함수나 주시 자료와 함께 분석하면 속도 구조에 대한 제약을 강화할 수 있다. 표면파 분산을 이용한 속도 구조 연구의 이론적 가능성은 Jeffreys (1925)에 의해 제안되었으며, 이후 PREM (Preliminary Reference Earth Model; Dziewonski and Anderson, 1981)을 비롯한 다양한 지역 및 전 지구 속도 구조 모델 개발에 활용되고 있다.
2.5. 배경 잡음 토모그래피
배경 잡음 토모그래피는 두 지진계에 기록된 장기간의 배경 잡음을 상호상관하면, 적절한 잡음원 분포와 확산장 조건에서 두 관측소 사이의 경험적 그린함수에 근사하는 파형을 복원할 수 있다는 이론에 기반하고 있다. 파동의 에너지가 방향성이 없는 확산장(diffuse field) 상태일 때 이러한 현상이 발생한다는 점은 음향학 분야에서 이론적(Lobkis and Weaver, 2001), 실험적(Weaver and Lobkis, 2001)으로 먼저 보고되었으며, 지진의 코다파(Campillo and Paul, 2003)와 지진 배경 잡음(Shapiro and Campillo, 2004)의 상호상관에서도 동일한 현상이 발생하는 것이 밝혀졌다. 상호상관 함수에서 표면파와 실체파(body wave)를 모두 추출할 수 있는 것으로 알려져 있으나, 실체파보다는 추출된 표면파에서 군속도와 위상속도를 측정하여 구성한 분산 곡선으로부터 속도 구조를 계산하는 방법이 지금까지는 주로 사용되고 있다(e.g., Shapiro et al., 2005). 그림 4는 관측소 간 거리에 따라 정렬한 배경 잡음 상호상관 함수의 예이며, 양과 음의 시간 지연에서 표면파 신호가 관찰된다.
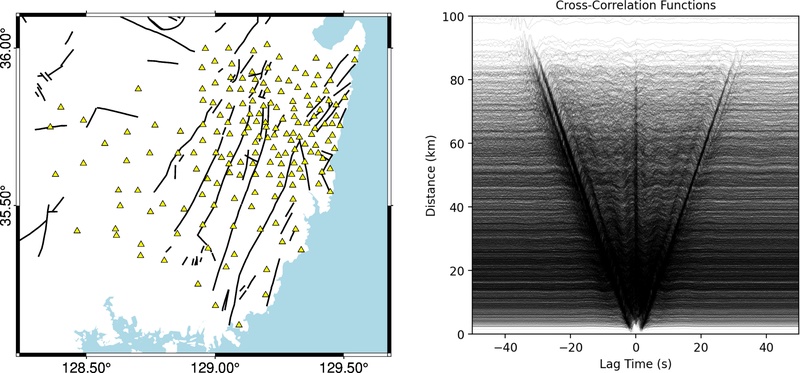
Example of vertical-component ambient noise cross-correlation functions. The left panel shows the stations used to compute the cross-correlation functions, and the right panel shows the vertical-component cross-correlation functions sorted by interstation distance and filtered over periods of 0.5–20 s. One year of ambient noise data, from April 2024 to April 2025, was used. Coherent Rayleigh-wave arrivals are visible at both positive and negative lag times, with arrival times increasing with interstation distance.
자연 지진을 사용하는 표면파 토모그래피 방법과 비교하여 배경 잡음 토모그래피는 크게 두 가지 장점을 가지고 있다. 첫째, 지진 발생 여부에 의존하지 않고 상시로 존재하는 지구의 잡음을 이용하기 때문에 자료 수집이 안정적이고, 지진 발생이 적은 지역에서도 활용이 가능하다. 둘째, 모델의 공간적 해상도가 지진계 분포에 좌우되고 다수의 관측소 쌍에서 경로를 확보할 수 있어 조밀한 관측망에서는 높은 공간 해상도를 기대할 수 있다. 또한 배경 잡음에서는 자연 지진 자료에 비해 상대적으로 짧은 주기의 표면파를 안정적으로 활용할 수 있어 천부 지각 구조를 제약하는 데 유리한 반면, 자연 지진을 이용한 표면파 토모그래피는 보다 긴 주기의 표면파를 활용하여 더 깊은 구조를 제약할 수 있다. 따라서 두 방법은 서로 다른 깊이 범위의 구조를 제약하는 데 상호보완적으로 활용될 수 있다. 이러한 장점 때문에 지진 발생 빈도에 비해 관측망의 밀도가 높은 남한 지역의 속도 구조 모델 개발에 적합한 방법이다. 그림 5는 배경 잡음 자료에서 측정한 2초 주기 위상속도를 이용한 2D 토모그래피 결과의 예이다.
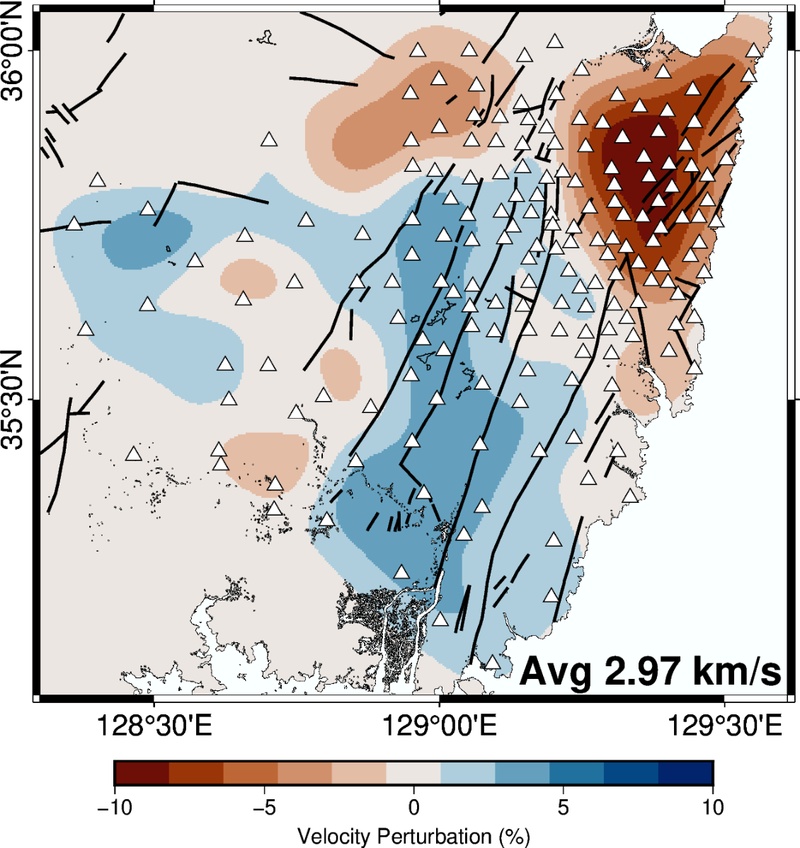
Example of a 2-D Rayleigh-wave phase-velocity map at a period of 2 s derived from ambient-noise cross-correlations. Colors indicate phase-velocity perturbations relative to a reference velocity of 2.97 km/s. Triangles mark station locations, and black lines indicate fault traces.
2.6. 한반도 1D 지각 속도 구조 모델의 발전
앞서 설명한 여러 방법을 이용한 한반도(특히 남한 지역) 속도 구조 모델은 지속적으로 개발되어 왔으며, 지진 관측망의 확충, 분석 기술의 발달과 가용 계산 자원의 확대에 따라 1D 모델에서 2D 및 3D 모델로 확장되면서 지각 구조의 수평적·수직적 불균질성을 더욱 상세히 표현하는 방향으로 발전해 왔다. 이러한 발전 과정의 초기에는 주로 주시 분석을 이용한 1D 속도 구조 연구가 이루어졌다. Lee (1979)는 대구, 부산, 엄원, 서울, 인천, 평양에서 관측된 1936년 쌍계사 지진의 주시 자료를 분석하여 한반도 지각의 평균 두께, Vp, Vs 및 상부 맨틀 Vp를 결정하였다. 이 모델은 지진학적 방법을 이용하여 제시된 최초의 한반도 지각 속도 구조 모델로 알려져 있다. 그림 6은 Lee (1979)의 결과를 수정하여 제시한 것으로, 진앙 거리에 따른 초동 주시의 변화를 보여준다. 지각과 맨틀을 전파하는 지진파의 속도 차이로 인하여 약 190 km 거리에서 초동 주시 곡선의 기울기가 달라지는 것을 확인할 수 있다.
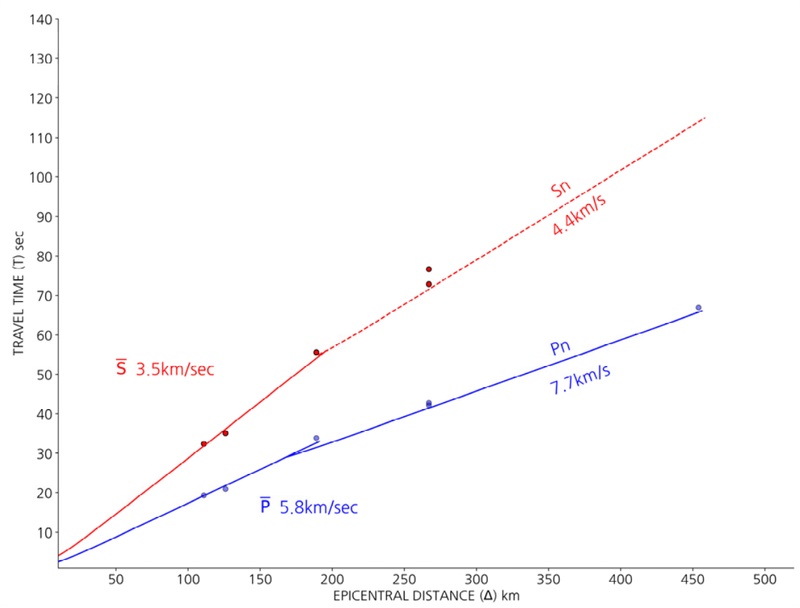
P- and S-wave travel times for the 1936 Ssanggyesa earthquake. The change in the apparent P-wave velocity from approximately 5.8 to 7.7 km/s reflects the crossover from the crustal branch to the upper-mantle Pn branch at an epicentral distance of approximately 190 km. Redrawn after Lee (1979).
Kim and Kim (1983)은 기상청, 미국지질조사소, 일본 기상청에서 재검토된 1936년 지리산(쌍계사) 지진, 1978년 홍성지진, 1981년 포항지진, 1982년 사리원지진과 울진지진의 주시 자료를 이용하여 속도 구조를 결정하였고, Kim and Jung (1985)은 경상분지를 포함한 남부 지역을 대상으로 위치의 정확도가 높은 인공 지진 자료만을 사용하여 1D 속도 구조 모델을 결정하였다. 이외에도 주시 분석을 이용하여 개발된 여러 1D 속도 구조 모델들이 제시되었다 (Kim, 1995; Kim, 1999). Chang and Baag (2006)은 주시 자료와 파형 자료를 결합하여 한반도 남부의 1D P파 속도 구조 모델을 제시하였다. 이들은 10개 광대역 관측소에 기록된 1999년 ML 3.4 경주지진의 파형과 근거리 단주기 관측소 5개소의 직접 P파(Pg) 주시, 원거리 광대역 관측소 5개소의 Pn 주시 및 이 중 3개소의 PmP 주시를 이용하였다. 유전알고리즘에 기반한 결합 역산을 통해 이들 자료를 동시에 설명하는 모델을 결정하였으며, 한반도 남부의 지각을 3개 층으로 구분하고 그 하부에 상부 맨틀 반무한층을 설정하였다. Lee and Baag (2008)은 유사한 방법을 2004년 ML 3.9 대구 지진에 적용하여 3층 지각 구조 모델을 획득하였으며, 지역별로 최적 1D 모델 사이에 차이가 있음을 보여주었다. Kim et al. (2011)은 주시 자료를 사용하지 않고, 2004년과 2007년에 한반도 남부 내륙에서 발생한 Mw 3.6 및 Mw 4.6 지진의 합성 파형을 관측 파형과 직접 비교하는 방식으로 지각을 3개의 층으로 나누는 모델을 개발하였다. 설정한 매개변수 범위에서 Vp, Vs 및 각 층의 두께를 전체 격자 검색하여 목적 함수를 최소화하는 모델을 탐색하였다. 이들 모델과 후술할 북한 지역 모델을 포함한 한반도 주요 1D Vp 및 Vs 모델의 비교는 그림 7에 제시하였다.
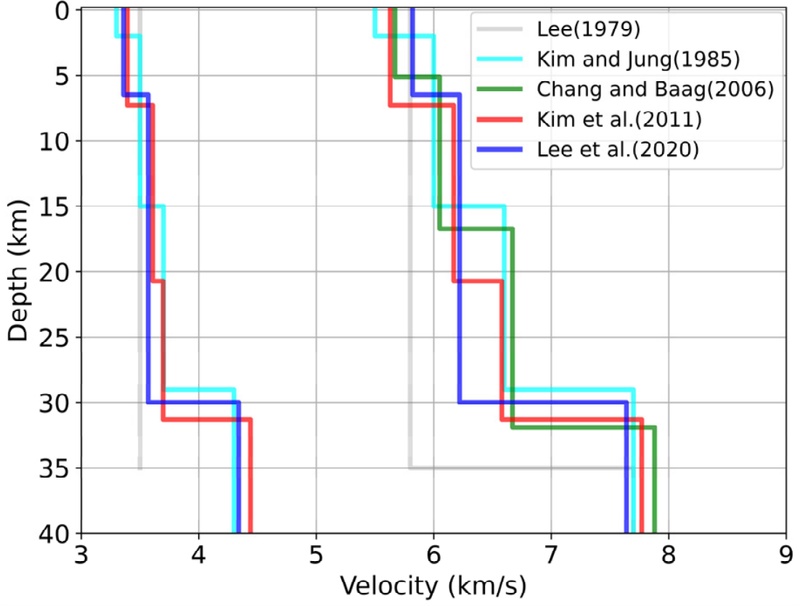
Comparison of major one-dimensional velocity models for the Korean Peninsula. The left profiles show Vs, and the right profiles show Vp.
2.7. 주시 토모그래피를 이용한 한반도 속도 구조 연구
주시를 이용한 3D 지각 속도 구조 모델 개발에 전통적으로 많이 사용되는 방법은 근거리 지진 주시 자료를 역산하는 토모그래피 방법이다. 이 방법을 적용하려면 지진 발생 분포와 관측망의 분포가 모델 개발에 적합해야 한다. 한반도 남부의 경우 지진 발생 빈도가 높지 않고 분포도 고르지 않기 때문에 근거리 지진 토모그래피 연구 결과가 상대적으로 적지만, 대표적인 연구로는 Kim et al. (2017)이 있다. Kim et al. (2017)은 2001년부터 2014년까지 한반도 내륙과 해역에서 발생한 747개 지진으로부터 측정한 19,935개의 P파 도달시간을 분석하여 3D Vp 모델을 구축하였다. 계산 영역은 깊이 70 km까지 설정되었으나, 분해능 시험에서 주요 구조가 안정적으로 복원된 깊이는 대체로 약 30 km 이내이므로 해석은 주로 상부 및 중부 지각에 한정된다. 주시에 기반한 다른 연구로는 한반도 지각 아래 상부 맨틀의 Vp를 Pn 토모그래피를 이용하여 연구한 Hong and Kang (2009)의 연구와 근거리 지진의 P파와 S파의 도달시간 차이로부터 한반도 상부 지각의 Vp/Vs비를 연구한 Jo and Hong (2013)의 연구가 있다.
2.8. 수신 함수를 이용한 한반도 속도 구조 연구
수신 함수를 이용한 속도 구조 연구는 개별 관측소 하부 구조에 대한 연구(Yoo and Lee, 2001; Chang et al., 2004)에서 시작되어 남한 지역 전체에 대한 연구(Chang and Baag, 2005; Yoo et al., 2007)로 확장되었다. Chang and Baag (2005)과 Yoo et al. (2007)은 모두 수신 함수와 표면파 분산 자료의 복합 역산을 통하여 속도 구조 모델을 개발하였다. 수신 함수는 관측소 하부 불연속면의 깊이 변화에 민감한 반면, 표면파 분산은 깊이별 평균 전단파 속도에 민감하다. 이러한 보완적인 특성으로 인하여 복합 역산을 수행하면 보다 신뢰할 수 있는 모델의 개발이 가능하다. Chang and Baag (2005)은 남한 지역 18개 광대역 관측소 하부의 전단파 속도 구조 모델을 추정하고 이를 이전 결과(Chang et al., 2004)와 종합하여 남한 지역에서 26~36 km의 분포를 가지는 2D 모호면 깊이 모델과 6.02~6.51 km/s의 지각 평균 Vp를 제시하였다. Yoo et al. (2007)은 80개의 관측소를 사용하여 평균 지각 두께 32.7 km를 가지면서 26~38 km 사이에서 변화하는 모호면 깊이 모델과 남한 지역 하부 약 50 km 깊이까지의 3D Vs 모델을 제시하였다. Lee et al. (2016)은 경주 지역에 설치된 19개의 조밀한 임시·영구 관측소 자료로 계산한 수신 함수를 분석하여 해당 지역 하부의 3D 모델을 제시하였다.
2.9. 배경 잡음 분석을 이용한 한반도 속도 구조 연구
배경 잡음 상호상관을 이용한 한반도 속도 구조 연구는 Kang and Shin (2006)에서 시작되었다. Kang and Shin (2006)은 한반도 남부에 설치된 91개의 가속도 관측소에 한 달 동안 기록된 수직 성분 자료의 상호상관 함수에서 2~4초 주기의 Rayleigh 파 군속도를 측정하여, 2D 군속도 토모그래피 결과를 도출하였다. 2D 토모그래피 결과는 지표에서 관찰되는 지질학적 특성과 밀접한 연관성을 보였으며, 이를 통해 배경 잡음을 이용한 속도 구조 연구의 가능성을 확인하였다. Cho et al. (2007)은 80개 이상의 광대역 및 가속도 관측소 자료를 분석하여 1, 2, 3 및 6초 주기의 Rayleigh 파와 Love 파에 대한 한반도 남부의 2D 군속도 지도를 제시하였다. 또한 한반도 남부를 북서-남동 방향으로 가로지르는 측선에서 분산 곡선을 역산하여 2D 전단파 속도 구조 모델을 제시하였다. 배경 잡음 자료에서 추출한 분산 곡선 역산 자료만을 이용하여 계산된 한반도 남부 전역에 대한 3D 속도 구조 모델은 Choi et al. (2009)에서 처음 제시되었으나, 사용된 주파수 대역의 한계로 인하여 상부 지각에 해당하는 약 8.25 km 깊이까지의 모델만 계산되었다.
2.10. 한반도 지각 규모 굴절파 실험
한반도 지역의 속도 구조 연구에는 주로 기상청과 지질자원연구원 등에서 운영하는 영구 관측망 자료가 사용되었지만, 특별한 목적을 위해 설치된 임시 관측망 자료가 사용되기도 한다. 특히 2002년에는 한반도 최초의 지각 규모 굴절파 실험인 KCRT-2002가 ‘서산-경주’ 측선에서 실시되었으며, 2004년(KCRT-2004)과 2008년(KCRT-2008)에는 각각 ‘연천-고성’ 및 ‘강화-영덕’ 측선을 따라 실험이 실시되었다. 세 차례 KCRT 탐사의 측선 위치는 그림 8에 제시하였다. KCRT 자료를 이용한 다양한 연구들이 수행되었으며, 대표적인 연구를 소개하면 다음과 같다. Cho et al. (2006)과 Cho et al. (2013)은 반복적인 파선 추적과 최소제곱 주시 역산을 결합한 방법(Zelt and Smith, 1992)을 이용하여 KCRT-2002와 KCRT-2004 측선의 2D 지각 속도 구조 모델을 결정하였다. 두 측선에서 지각 두께는 28~34.9 km이며, 이는 전형적인 확장된 대륙 지각의 두께와 유사하다(Christensen and Mooney, 1995). Kim et al. (2007)은 KCRT-2002와 KCRT-2004 자료를 이용한 초동 주시 토모그래피로 결정한 2D Vp 모델을 발표하였으며, 같은 방법을 사용하여 KCRT-2008에 대한 모델도 결정하였다(Kim et al., 2010). Jung et al. (2007)과 Jung et al. (2008)은 2002년과 2004년 자료의 단주기 Rayleigh 파 군속도 분산 곡선으로부터 천부 지각(< 1.5 km) Vs 모델을 개발하였으며, 이를 한반도 내륙과 인근에서 발생한 지진의 Rayleigh 파 군속도 자료와 결합하여 한반도 남부 지역 약 10 km 깊이까지의 3D 전단파 속도 구조 모델을 제시하였다(Jung et al., 2011).
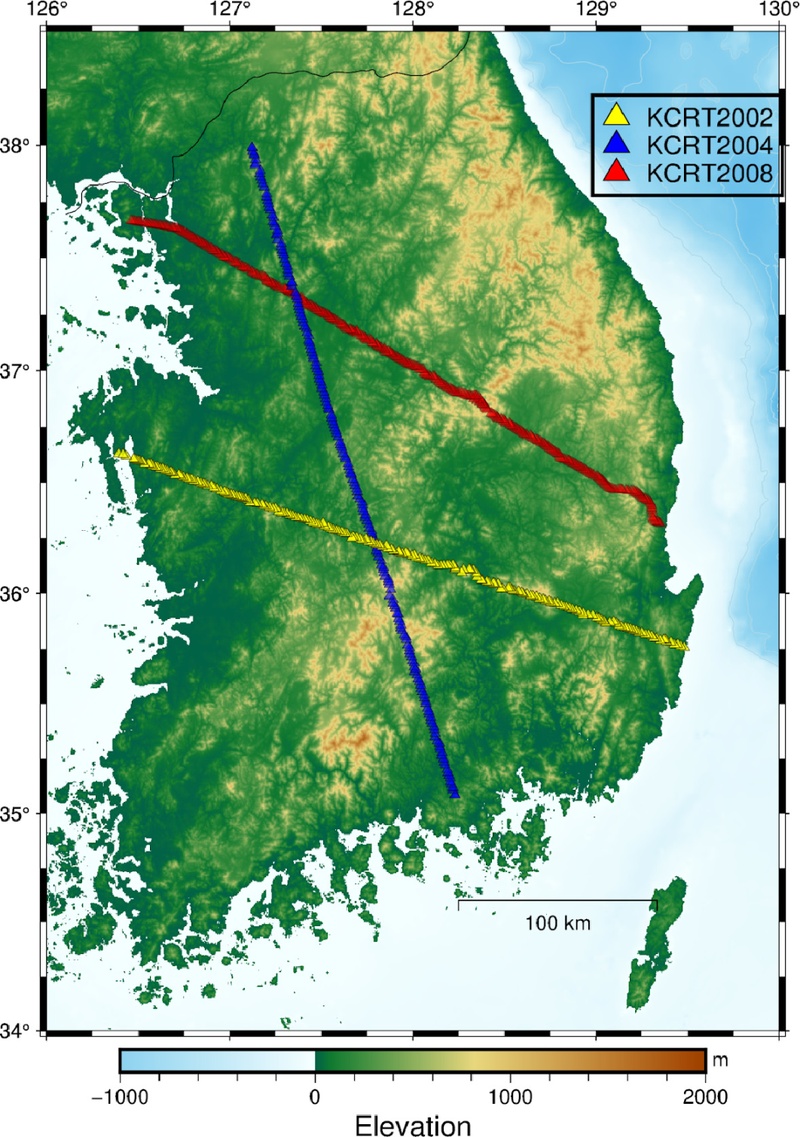
Locations of the KCRT-2002, KCRT-2004, and KCRT-2008 crustal-scale seismic profiles across the southern Korean Peninsula. The profiles extend from Seosan to Gyeongju, Yeoncheon to Goseong, and Ganghwa to Yeongdeok, respectively. Background colors indicate surface elevation.
2.11. 북한과 제주도의 지각 속도 구조 연구
한반도의 속도 구조 모델 개발은 영구 관측망이 조밀하게 운영되는 남부 내륙 지역을 중심으로 이루어졌으며, 한반도 북쪽 지역과 제주도 등 도서 지역에 대한 속도 구조 모델은 상대적으로 잘 알려지지 않았다. 제주도 지역의 경우 서울대, 부경대를 중심으로 2013~2017년 기간 동안 운영된 20개의 임시 지진 관측소와 3개의 영구 관측소에 기록된 자료를 이용하여 수신 함수 분석(Kang et al., 2021), 배경 잡음 토모그래피(Lee et al., 2021), 원거리 주시 토모그래피(Song et al., 2018) 연구가 수행되었다. 제주도 지역의 임시 및 영구 지진 관측소 분포는 그림 9와 같다. 수신 함수 분석 결과에 의하면 제주도의 지각 두께는 26~40 km의 범위에서 변화하며 한라산 중앙부에서의 지각 두께가 상대적으로 얇고, 제주도의 서쪽과 남동부에서는 상대적으로 두꺼운 것으로 나타났다. 또한 배경 잡음 토모그래피 결과에서는 제주도 상부 지각에 화산 활동과 관련된 것으로 해석되는 저속도 이상이 관찰되었다(Lee et al., 2021). 북한 지역 속도 구조 연구로는 Lee et al. (2020)이 있다. Lee et al. (2020)은 남한과 중국 동북 지역 지진계 사이의 배경 잡음 상호상관 자료로부터 Rayleigh 파의 군속도 분산 곡선을 추출하고 이를 역산하여 북한 지역의 평균적인 1D 속도 구조 모델을 제시하였다(그림 7).
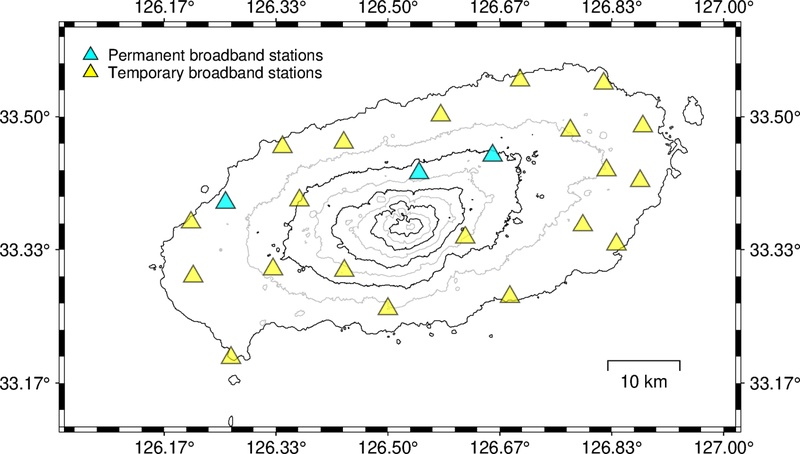
Distribution of the three permanent and 20 temporary broadband seismic stations used in crustal-structure studies of Jeju Island. The black and gray lines represent topographic elevation contours at 200 m increments, with alternating contours shown in black and gray for clarity.
3. 한반도 지각 속도 구조 연구의 최근 동향
제2장에서 살펴본 연구를 바탕으로 한반도 지각 속도 구조 연구는 다양한 방향으로 발전하고 있다. 최근에는 고밀도 관측망과 발전된 분석 기법을 이용하여 특정 지역의 지각 구조를 상세하게 영상화하는 연구가 활발하게 이루어지고 있다. 수도권에서는 표면파 헬름홀츠 토모그래피를 이용하여 지각 및 최상부 맨틀의 3D 전단파 속도 구조가 연구되었으며(Park et al., 2024), 영남권에서는 고밀도 광역 관측망의 수신 함수를 이용한 상세 지각 구조 연구가 수행되었다(Kim et al., 2026). 강원권에서도 고밀도 관측 자료와 헬름홀츠 토모그래피를 이용하여 지각 및 최상부 맨틀의 3D 전단파 속도 구조가 제시되었다(Park et al., 2026). 이러한 연구와 함께 최근의 주요 발전 방향으로는 파형에서 추출한 일부 정보가 아니라 파형 전체를 활용하여 속도 구조를 추정하는 파형 역산법의 적용과 독립형 지오폰을 이용한 고밀도 관측을 통한 고해상도 모델 개발이 있다. 이와 함께 기존 및 신규 속도 구조 모델을 체계적으로 축적·공유하여 활용성을 높이기 위한 데이터베이스 구축도 이루어지고 있다. 구축된 데이터베이스는 웹페이지(https://tomo.snu.ac.kr)를 통해 이용할 수 있으며, 속도 구조 모델의 검색뿐 아니라 사용자가 선택한 영역의 모델을 합성 파형 계산에 필요한 입력 파일 형식으로 제공한다.
3.1. 고밀도 지오폰 탐사
독립형 지오폰은 수십 년 동안 주로 능동 지진원 연구(Active-Source Seismology)에 사용되어 왔지만(e.g., Mooney and Brocher, 1987), 지오폰 장비 및 분석 기술의 발전에 힘입어 최근에는 수동 지진원 연구에도 많이 사용되고 있다. 지오폰 센서, 디지털 변환기, 배터리를 모두 포함한 작은 일체형 지진 시스템은 ‘노드(nodes)’라고 불리며, 가볍고 설치가 쉽기 때문에 한 번에 수백에서 수천 개의 장비를 설치하여 다양한 지진학적 연구에 활용할 수 있다. 최근의 노드는 센서와 디지타이저 성능이 향상되어 연구 목적에 따라 비교적 넓은 주파수 대역의 자료를 기록할 수 있으며, 배터리 용량과 표본화율에 따라 수주에서 수개월 동안 독립적으로 운영할 수 있다. 고밀도 노드를 사용하면 높은 공간적 해상도로 지하 구조를 영상화할 수 있기 때문에 상세한 지하 구조 영상화가 필요한 지역에서 많이 사용된다. 국내에서도 고밀도 노드를 이용한 지각 구조 상세화 연구가 활발하게 이루어지고 있으며, 주로 천부 지각의 고해상도 모델을 개발하거나 단층의 흔적 등을 찾는 데 이용되고 있다. 고밀도 지오폰을 이용한 대표적인 연구 사례로는 포항 분지(Kang, 2024)와 밀양단층(Liu et al., 2024)에 대한 연구가 있으며, 그림 10은 춘천 분지 구조 연구를 위해 설치된 고밀도 지오폰의 설치 예를 보여준다.
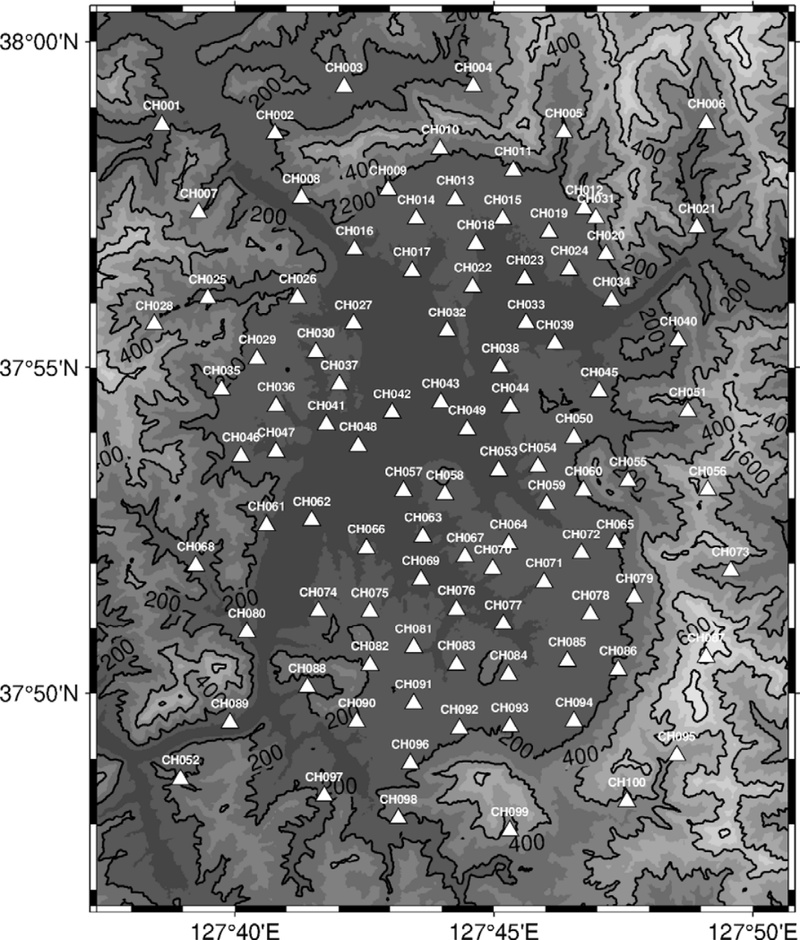
Distribution of the dense nodal geophone array deployed for the Chuncheon Basin survey. Triangles indicate node locations, and contours show surface topography.
3.2. 파형 역산법을 이용한 지각 속도 구조 모델 개발
파형 역산법을 이용하여 속도 구조 모델을 개발하기 위해서는 관측 파형의 주요 특징을 어느 정도 재현할 수 있는 초기 모델이 필요하다. 현재 개발 중인 한반도 3D 속도 구조 모델은 배경 잡음 토모그래피로 산출한 3D 전단파 속도 구조를 출발 모델로 사용하고, 이를 지진파 주시 자료의 역산을 통해 보완한 뒤 파형 역산의 초기 모델로 활용한다. 이와 같이 서로 다른 자료와 방법을 단계적으로 결합하면 초기 모델과 실제 구조 사이의 차이를 줄이고, 파형 역산이 국소 최솟값에 수렴할 가능성을 줄이는 데 도움이 될 수 있다.
고전적인 파선 이론 기반의 주시 토모그래피는 지진파의 파장이 지하 구조의 공간적 변화 규모에 비해 매우 짧다는 고주파수 근사를 적용한다. 이 방법에서는 파선 추적으로 계산한 전파 경로를 따라 속도 변화에 대한 민감도가 분포한다고 가정하고, 관측 주시와 계산 주시의 차이를 이용해 모델을 갱신한다. 그러나 실제 지진파는 유한한 주파수 대역을 가지며, 지진파의 주파수 특성은 지진 규모, 진원 시간 함수 및 전파 매질의 물성 등에 따라 달라지며, 관측되는 파형은 진원 메커니즘과 전파 방향의 영향도 받는다.
유한 주파수의 지진파는 무한히 가는 파선상의 구조뿐 아니라 파선 주변의 일정한 부피 영역에 존재하는 구조의 영향도 받는다. 이러한 민감도는 주파수와 파동의 종류에 따라 달라지며 감도 커널(sensitivity kernel)의 형태로 표현된다(Hung et al., 2000). 따라서 보다 정확한 토모그래피를 위해서는 파선상의 민감도만을 사용하는 대신, 주파수 의존적 감도 커널과 적절한 모델 파라미터화를 적용할 필요가 있다.
파형 역산은 관측 파형과 현재 속도 구조 모델에서 계산한 합성 파형 사이의 차이를 이용하여 모델을 반복적으로 갱신하는 방법이다. 도달시간뿐 아니라 위상, 진폭 및 파형 형태의 차이를 함께 활용할 수 있으므로, 주시나 분산 곡선과 같이 파형에서 추출한 일부 정보만을 이용하는 방법보다 지진 기록에 포함된 정보를 폭넓게 사용할 수 있다. 다만 파형의 진폭은 속도 구조뿐 아니라 감쇠, 지진원 및 관측소 부지 효과에도 영향을 받으므로, 목적 함수와 주파수 대역을 적절히 설정해야 한다.
파형 역산을 수행하려면 3D 지각 구조에서의 지진파 전파를 정밀하게 계산해야 한다. 3D 지각 구조에서의 합성 파형 계산에는 스펙트럴 요소법(Spectral Element Method; Komatitsch and Tromp, 1999)과 같은 수치해석 기법이 널리 사용된다. 계산 영역을 3D 격자로 구성하고, 진원 위치, 진원 시간 함수 및 진원 메커니즘을 적용하여 각 관측소에서의 합성 파형을 산출한다.
속도 구조의 각 위치가 관측 파형과 합성 파형의 차이에 미치는 영향을 계산하기 위해 수반법(adjoint method)을 사용한다. 먼저 두 파형의 차이를 정량화하는 목적 함수를 정의하고, 파형 잔차로부터 관측소별 수반원(adjoint source)을 구성한다. 이후 실제 진원에서 계산한 전진 파동장과 수반 파동장의 시간적·공간적 상호작용을 통해 감도 커널을 계산하고, 이를 이용해 목적 함수의 모델 매개변수에 대한 기울기를 구성한다(Tromp et al., 2005; Fichtner et al., 2006).
하나의 지진 사건에 대해 여러 관측소의 수반원을 합산하면 해당 사건의 전체 자료가 목적 함수에 기여하는 기울기를 한 번의 수반파 계산으로 효율적으로 산출할 수 있다. 여러 지진 사건을 사용하는 경우에는 일반적으로 사건별로 전진 및 수반 파동장을 계산한 뒤, 각 사건에서 얻은 기울기를 합산하여 모델의 갱신 방향을 결정한다.
계산된 기울기를 이용해 속도 구조 모델을 갱신한 뒤 새로운 합성 파형을 계산하고, 관측 파형과의 차이를 다시 평가한다. 이러한 과정은 목적 함수의 감소가 충분히 작아지거나 설정한 반복 횟수에 도달할 때까지 반복된다. 실제 역산에서는 불필요한 단파장 변화를 억제하고 안정적인 해를 얻기 위해 감도 커널의 평활화, 사전조건화 및 정규화 등을 함께 적용한다.
그림 11과 12는 한반도 지각을 대상으로 진행 중인 파형 역산에서 얻어진 예비 결과를 이용하여, 반복적인 모델 갱신과 이에 따른 파형 적합도 변화를 예시한 것이다. 그림 11은 초기 모델과 반복 역산 후 모델 사이의 변화를 보여주며, 그림 12는 1D 모델, 초기 3D 모델 및 갱신된 3D 모델에서 계산한 합성 파형을 관측 파형과 비교한 예이다. 이들 그림은 파형 역산의 적용 과정과 모델 개선 가능성을 정성적으로 설명하기 위한 것으로, 개별 속도 이상의 지질학적 의미나 모델의 정량적 정확성을 제시하기 위한 것은 아니다. 모델의 신뢰성과 해상도에 대한 평가는 향후 자료 처리 및 역산 조건의 정리와 독립 자료 검증을 통해 수행할 필요가 있다.
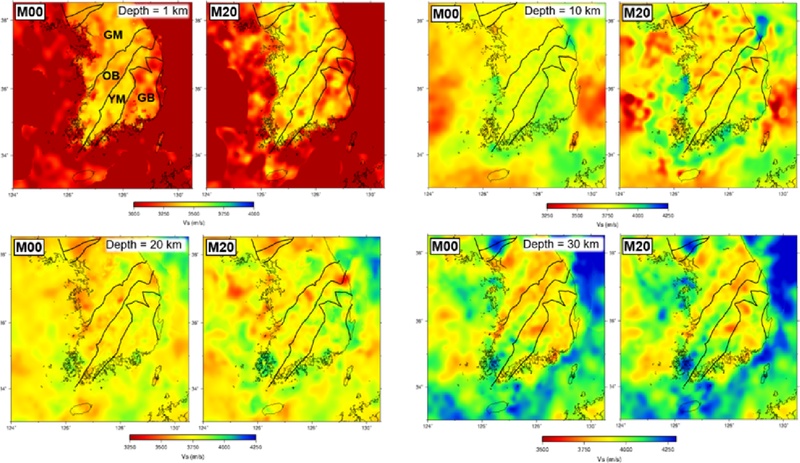
Illustrative example of changes in a three-dimensional shear-wave velocity model during iterative waveform inversion. M00 and M20 denote the initial model and a preliminary model obtained after 20 waveform-inversion iterations, respectively. The same color scale is used within each M00-M20 pair, whereas the velocity range differs among depths. GM, OB, YM, and GB denote the Gyeonggi Massif, Okcheon Belt, Yeongnam Massif, and Gyeongsang Basin, respectively. The results are presented to illustrate the model-updating process, and no quantitative geological interpretation of individual velocity anomalies is attempted.
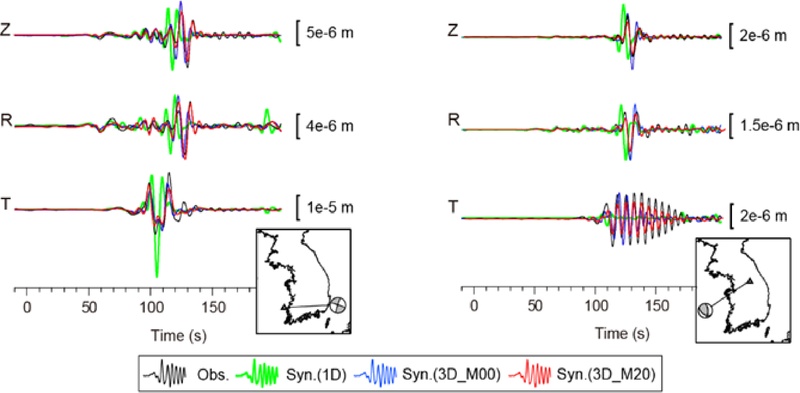
Illustrative comparison of observed three-component waveforms with synthetics calculated using a one-dimensional velocity model for the southern Korean Peninsula of Kim et al. (2011), an initial three-dimensional model (M00), and a preliminary model obtained after 20 waveform-inversion iterations (M20). Black, green, blue, and red traces represent the observations, the 1-D model, M00, and M20, respectively. Z, R, and T denote the vertical, radial, and transverse components. Amplitude scale bars are given in meters. The comparison is intended to illustrate qualitative changes in waveform fit during iterative model updating rather than to provide a quantitative validation of the velocity models.
4. 한반도 지각 구조 상세화 연구의 쟁점 및 발전 방향
한반도 지각 구조 상세화 연구가 지진파 속도 구조 연구를 중심으로 이루어져 왔고, 최근에는 파동방정식 기반 파형 역산과 고밀도 관측 자료가 도입되면서 한반도 지각 구조 모델의 방법론적 정교화가 빠르게 진행되고 있다. 하지만 지진동에 큰 영향을 미치는 천부 지각의 속도 구조 모델은 아직 개선의 여지가 남아 있다. 또한 지진파의 전파 방향과 편광에 따른 속도 변화를 나타내는 이방성(anisotropy) 모델과 상세한 감쇠(attenuation) 모델의 개발도 필요하다.
현재 구축된 한반도 3D 지각 속도 구조 모델은 지각 전체 구조에 초점을 맞추고 있으나, 지표 부근에서 수 km 깊이에 이르는 천부 지각 및 퇴적층 구조에 대해서는 해상도가 낮다는 한계가 있다. 그러나 지진동의 진폭과 주파수 특성 등 지진 재해와 직접적으로 연관된 효과는 천부 지각의 속도에 크게 영향을 받으므로, 천부 모델의 개선은 지진재해도 평가를 위해 매우 중요하다. 천부 지각 모델을 개선하기 위해서는 현재 사용되는 대역보다 높은 주파수의 지진파 자료를 활용하고, 고밀도 탐사로 얻은 지역 모델을 광역 모델과 통합할 필요가 있다. 고주파수 자료는 파장이 짧아 상대적으로 작은 규모의 천부 속도 불균질성에 민감하지만, 실제 해상도는 지진파 속도, 주파수, 관측망 간격 및 경로 분포에 따라 달라진다. 높은 주파수까지 포함한 파형 역산에는 더 조밀한 수치 격자와 짧은 시간 간격이 필요하며, 산란과 감쇠 및 천부 구조의 강한 불균질성을 정교하게 모사해야 한다. 또 다른 접근 방법은 고밀도 지오폰 탐사를 통해 구축된 지역 고해상도 모델을 광역 모델과 결합하는 방식을 생각해 볼 수 있으며, 이를 위해서는 서로 다른 공간 해상도를 가지는 모델을 적절히 통합하기 위한 방법론 연구가 필요하다.
기존의 한반도 지각 속도 구조 모델은 대부분 등방성(isotropy)을 가정하여 구축되었다. 하지만 실제 지각에서는 지질 구조의 배열, 광물의 선호방향성 및 균열·응력장 등의 영향으로 지진파의 전파 방향과 편광에 따라 속도가 달라질 수 있으며, 지진파 전파에 따른 에너지 손실을 나타내는 감쇠 특성도 존재한다. 따라서 보다 현실적인 지진파 전파 모사와 지각 구조를 깊이 이해하기 위해 이방성과 감쇠를 포함하는 지각 모델을 개발할 필요가 있다. 이방성과 감쇠를 일관되게 추정하는 직접적인 접근법 가운데 하나는 이방성 및 감쇠 매개변수를 파형 역산의 모델 변수에 포함하는 것이다. 다만 속도, 이방성 및 감쇠 사이의 상충관계를 줄이기 위해서는 충분한 방위각 분포와 넓은 주파수 대역의 자료가 필요하다. 그림 13은 이방성 속도 매개변수를 파형 역산에 포함하여 얻을 수 있는 결과의 예를 보여준다. 이 그림은 방사 이방성 모델의 표현 방식과 향후 연구 가능성을 설명하기 위한 예비 사례이며, 개별 이방성 이상의 지질학적 해석이나 정량적 평가는 수행하지 않았다. 이방성 모델을 신뢰성 있게 해석하기 위해서는 다양한 전파 방향, 입사각, 편광 및 파동 종류를 포함하는 자료와 함께 등방성 속도, 이방성 및 감쇠 사이의 상충관계에 대한 검증이 필요하다.
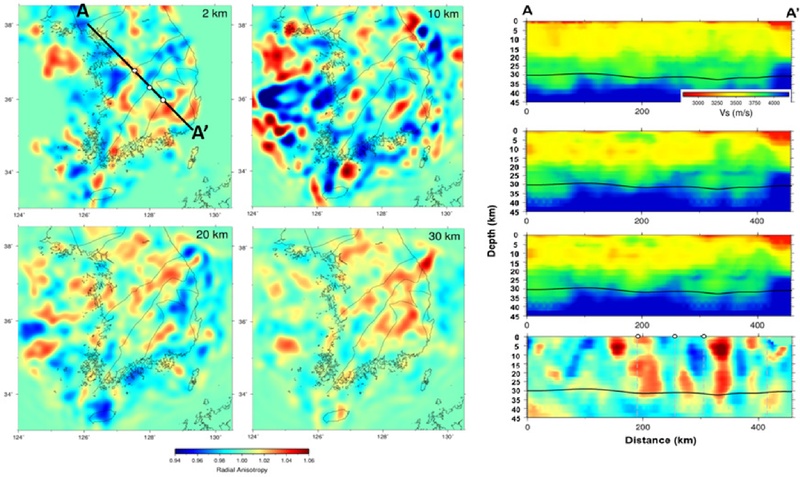
Illustrative example of a preliminary three-dimensional anisotropic velocity model obtained through waveform inversion. The horizontal sections show radial anisotropy at different depths, expressed as the ratio of the horizontally to vertically polarized shear-wave velocities (Vsh/Vsv). Along profile A–A′, the four vertical sections show, from top to bottom, the initial three-dimensional isotropic Vs model, the preliminary Vsh and Vsv models, and Vs radial anisotropy. The solid black line denotes the Moho depth profile shown in Song et al. (2022), based on previous studies (Chang and Baag, 2007; Kim et al., 2015), and the vertical gray dashed lines indicate major tectonic boundaries intersected by the profile. The results are presented to illustrate the representation and potential application of anisotropic waveform inversion; no quantitative interpretation of individual anisotropic anomalies is attempted.
한반도 지각 구조 상세화 연구는 지난 수십 년간 관측망과 분석 기법의 발전에 힘입어 지속적으로 발전해 왔다. 천부 지각 모델을 보완하고 이방성 및 감쇠 특성을 통합하면 모델의 현실성을 높이고, 한반도 지각 구조에 대한 보다 종합적이고 신뢰도 높은 해석을 제시할 수 있다. 이러한 모델은 현실적인 지진동 모사와 지진재해도 평가를 위한 기초 자료로 활용될 것으로 기대된다.
Acknowledgments
이 연구는 2025년 대한민국학술원 '학문연구의 동향과 쟁점' 발간 사업의 지원을 받아 수행되었습니다. 이 논평은 한국연구재단의 정책연구과제(정책연구 202606)의 수행 결과를 토대로 작성되었으며, 한국연구재단의 공식적인 견해와는 다를 수 있습니다. 그림 11–13은 저자와 송정훈 박사가 공동으로 수행 중인 한반도 파형 역산 연구의 미발표 예비 결과를 방법론적 예시로 제시한 것입니다. 해당 결과의 산출과 그림 작성에 기여해 주신 송정훈 박사께 감사드립니다.
References
-
Aki, K. and Lee, W.H.K., 1976, Determination of the three-dimensional velocity anomalies under a seismic array using first P arrival times from local earthquakes: 1. A homogeneous initial model. Journal of Geophysical Research, 81, 4381-4399.
[https://doi.org/10.1029/JB081i023p04381]

-
Campillo, M. and Paul, A., 2003, Long-Range Correlations in the Diffuse Seismic Coda. Science, 299, 547-549.
[https://doi.org/10.1126/science.1078551]
-
Chang, S.-J. and Baag, C.-E., 2005, Crustal Structure in Southern Korea from Joint Analysis of Teleseismic Receiver Functions and Surface-Wave Dispersion. Bulletin of the Seismological Society of America, 95, 1516-1534.
[https://doi.org/10.1785/0120040080]
-
Chang, S.-J. and Baag, C.-E., 2006, Crustal Structure in Southern Korea from Joint Analysis of Regional Broadband Waveforms and Travel Times. Bulletin of the Seismological Society of America, 96, 856-870.
[https://doi.org/10.1785/0120040165]
-
Chang, S.-J. and Baag, C.-E., 2007, Moho Depth and Crustal Vp/Vs Variation in Southern Korea from Teleseismic Receiver Functions: Implication for Tectonic Affinity between the Korean Peninsula and China. Bulletin of the Seismological Society of America, 97, 1621-1631.
[https://doi.org/10.1785/0120050264]
-
Chang, S.-J., Baag, C.-E. and Langston, C.A., 2004, Joint Analysis of Teleseismic Receiver Functions and Surface Wave Dispersion using the Genetic Algorithm. Bulletin of the Seismological Society of America, 94, 691-704.
[https://doi.org/10.1785/0120030110]
-
Cho, H.-M., Baag, C.-E., Lee, J.M., Moon, W.M., Jung, H. and Kim, K.Y., 2013, P- and S-wave velocity model along crustal scale refraction and wide-angle reflection profile in the southern Korean peninsula. Tectonophysics, 582, 84-100.
[https://doi.org/10.1016/j.tecto.2012.09.025]
-
Cho, H.-M., Baag, C.-E., Lee, J.M., Moon, W.M., Jung, H., Kim, K.Y. and Asudeh, I., 2006, Crustal velocity structure across the southern Korean Peninsula from seismic refraction survey. Geophysical Research Letters, 33, L06307.
[https://doi.org/10.1029/2005GL025145]
-
Cho, K.H., Herrmann, R.B., Ammon, C.J. and Lee, K., 2007, Imaging the Upper Crust of the Korean Peninsula by Surface-Wave Tomography. Bulletin of the Seismological Society of America, 97, 198-207.
[https://doi.org/10.1785/0120060096]
-
Choi, J.H., Kang, T.-S. and Baag, C.-E., 2009, Three-dimensional surface wave tomography for the upper crustal velocity structure of southern Korea using seismic noise correlations. Geosciences Journal, 13, 423-432.
[https://doi.org/10.1007/s12303-009-0040-2]
-
Christensen, N.I. and Mooney, W.D., 1995, Seismic velocity structure and composition of the continental crust: A global view. Journal of Geophysical Research, 100, 9761-9788.
[https://doi.org/10.1029/95JB00259]
-
Dziewonski, A.M. and Anderson, D.L., 1981, Preliminary reference Earth model. Physics of the Earth and Planetary Interiors, 25, 297-356.
[https://doi.org/10.1016/0031-9201(81)90046-7]
-
Fichtner, A., Bunge, H.P. and Igel, H., 2006, The adjoint method in seismology: I. Theory. Physics of the Earth and Planetary Interiors, 157, 86-104.
[https://doi.org/10.1016/j.pepi.2006.03.016]
-
Hammer, P.T.C., Clowes, R.M., Cook, F.A., van der Velden, A.J. and Vasudevan, K., 2010, The Lithoprobe trans-continental lithospheric cross sections: imaging the internal structure of the North American continent. Canadian Journal of Earth Sciences, 47, 821-857.
[https://doi.org/10.1139/E10-036]
-
Hong, T.-K. and Kang, T.-S., 2009, Pn Travel-Time Tomography of the Paleo-Continental-Collision and Rifting Zone around Korea and Japan. Bulletin of the Seismological Society of America, 99, 416-421.
[https://doi.org/10.1785/0120080120]
-
Hung, S.H., Dahlen, F.A. and Nolet, G., 2000, Frechet kernels for finite-frequency traveltimes-II. Examples. Geophysical Journal International, 141, 175-203.
[https://doi.org/10.1046/j.1365-246X.2000.00072.x]
-
Jeffreys, H., 1925, On the Surface Waves of Earthquakes. Geophysical Journal International, 1, 282-292.
[https://doi.org/10.1111/j.1365-246X.1925.tb05376.x]
-
Jo, E. and Hong, T.-K., 2013, Vp/Vs ratios in the upper crust of the southern Korean Peninsula and their correlations with seismic and geophysical properties. Journal of Asian Earth Sciences, 66, 204-214.
[https://doi.org/10.1016/j.jseaes.2013.01.008]
-
Jung, H., Jang, Y.-S. and Jo, B.G., 2011, Upper-Crust Shear-Wave Velocity of South Korea Constrained by Explosion and Earthquake Data. Bulletin of the Seismological Society of America, 101, 2819-2832.
[https://doi.org/10.1785/0120110026]
-
Jung, H., Jang, Y.S., Lee, J.M., Moon, W.M., Baag, C.E., Kim, K.Y. and Jo, B.G., 2007, Shear wave velocity and attenuation structure for the shallow crust of the southern Korean Peninsula from short-period Rayleigh waves. Tectonophysics, 429, 253-265.
[https://doi.org/10.1016/j.tecto.2006.10.003]
-
Jung, H., Jang, Y.S., Lee, J.M., Moon, W.M., Baag, C.-E., Kim, K.Y. and Jo, B.G., 2008, Shallow-depth shear wave velocity structure of the southern Korean Peninsula obtained from two crustal-scale refraction profiles. Journal of Applied Geophysics, 66, 59-69.
[https://doi.org/10.1016/j.jappgeo.2008.08.007]
-
Kang, H., Kim, Y., Rhie, J., Kang, T.-S. and Brenna, M., 2021, Seismic crustal structure beneath Jeju Volcanic Island, South Korea from teleseismic P-receiver functions. Geophysical Journal International, 227, 58-75.
[https://doi.org/10.1093/gji/ggab211]
-
Kang, S.Y., 2024, Mapping bedrock topography and detecting blind faults using the fundamental resonance of microtremor: a case study of the Pohang Basin, southeastern Korea. Geophysical Journal International, 238, 806-819.
[https://doi.org/10.1093/gji/ggae194]
-
Kang, T.-S. and Shin, J.S., 2006, Surface-wave tomography from ambient seismic noise of accelerograph networks in southern Korea. Geophysical Research Letters, 33, L17303.
[https://doi.org/10.1029/2006GL027044]
-
Kim, K.-H., Park, J.-H., Park, Y., Hao, T.-Y. and Kim, H.-J., 2017, Crustal structure beneath the southern Korean Peninsula from local earthquakes. Geophysical Journal International, 209, 969-978.
[https://doi.org/10.1093/gji/ggx079]
- Kim, K.-Y., Lee, J.-M., Baag, C.-E., Jung, H.-O., Hong, M.-H. and Kim, J.-Y., 2010, Seismic velocity structure along the KCRT-2008 profile using traveltime inversion of first arrivals. Geophysics and Geophysical Exploration, 13, 153-158.
-
Kim, K.Y., Lee, J.M., Moon, W., Baag, C.-E., Jung, H. and Hong, M.H., 2007, Crustal structure of the southern Korean peninsula from seismic waves generated by large explosions in 2002 and 2004. Pure and Applied Geophysics, 164, 97-113.
[https://doi.org/10.1007/s00024-006-0149-4]
-
Kim, M., Lim, H., Kim, Y., Rhie, J., Kang, T.-S., Kim, K.-H. and Ree, J.-H., 2026, High-resolution P receiver function imaging of seismic crustal structure in the southeastern Korean Peninsula: implications for deformation associated with Miocene backarc extension. Geophysical Journal International, 245, ggag030.
[https://doi.org/10.1093/gji/ggag030]
-
Kim, S., Rhie, J. and Kim, G., 2011, Forward waveform modelling procedure for 1-D crustal velocity structure and its application to the southern Korean Peninsula. Geophysical Journal International, 185, 453-468.
[https://doi.org/10.1111/j.1365-246X.2011.04949.x]
- Kim, S.J. and Kim, S.K., 1983, A Study on the Crustal Structure of South Korea by using Seismic Waves. Economic and Environmental Geology, 16, 51-61 (in Korean with English abstract).
-
Kim, S.K., 1995, A Study on the Crustal Structure of the Korean Peninsular. Journal of the Geological Society of Korea, 31, 393-403 (in Korean with English abstract).
[https://doi.org/10.14770/jgsk.1995.31.4.393]
- Kim, S.K. and Jung, B.H., 1985, Crustal Structure of the Southern Part of Korea. Economic and Environmental Geology, 18, 151-157 (in Korean with English abstract).
-
Kim, W., 1999, P-wave velocity structure of upper crust in the vicinity of the Yangsan Fault region. Geosciences Journal, 3, 17-22.
[https://doi.org/10.1007/BF02910230]
-
Kim, Y., Lee, C. and Kim, S.-S., 2015, Tectonics and Volcanism in East Asia: Insights from Geophysical Observations. Journal of Asian Earth Sciences, 113, 842-856.
[https://doi.org/10.1016/j.jseaes.2015.07.032]
-
Komatitsch, D. and Tromp, J., 1999, Introduction to the spectral element method for three-dimensional seismic wave propagation. Geophysical Journal International, 139, 806-822.
[https://doi.org/10.1046/j.1365-246x.1999.00967.x]
-
Langston, C.A., 1979, Structure Under Mount Rainier, Washington, Inferred From Teleseismic Body Waves. Journal of Geophysical Research, 84, 4749-4762.
[https://doi.org/10.1029/JB084iB09p04749]
-
Lee, D.H., Lee, J.M., Cho, H.-M. and Kang, T.-S., 2016, 3D crustal velocity structure beneath the broadband seismic array in the Gyeongju area of Korea by receiver function analysis. Tectonophysics, 689, 89-106.
[https://doi.org/10.1016/j.tecto.2016.08.022]
-
Lee, K., 1979, On Crustal Structure of the Korean Peninsula. Journal of the Geological Society of Korea, 15, 253-258 (in Korean with English abstract).
[https://doi.org/10.14770/jgsk.1979.15.4.253]
-
Lee, S.-J., Kim, S., Rhie, J., Kang, T.-S. and Kim, Y., 2021, Upper crustal shear wave velocity and radial anisotropy beneath Jeju Island volcanoes from ambient noise tomography. Geophysical Journal International, 225, 1332-1348.
[https://doi.org/10.1093/gji/ggab026]
-
Lee, S.-J., Rhie, J., Kim, S., Kang, T.-S. and Cho, C.S., 2020, 1-D velocity model for the North Korean Peninsula from Rayleigh wave dispersion of ambient noise cross-correlations. Journal of Seismology, 24, 121-131.
[https://doi.org/10.1007/s10950-019-09891-6]
-
Lee, W. and Baag, C.-E., 2008, Local crustal structures of southern Korea from joint analysis of waveforms and travel times. Geosciences Journal, 12, 419-428.
[https://doi.org/10.1007/s12303-008-0041-6]
-
Liu, L., Peng, F., Kang, S.Y., Lee, Y.-C. and Kim, K.-H., 2024, Integrated passive and active seismic profiling for detection of buried faults: a case study at the north end of the Miryang Fault in the Geoncheon Valley, southeastern Korean Peninsula. Geosciences Journal, 28, 659-669.
[https://doi.org/10.1007/s12303-024-0019-z]
-
Lobkis, O.I. and Weaver, R.L., 2001, On the emergence of the Green's function in the correlations of a diffuse field. The Journal of the Acoustical Society of America, 110, 3011-3017.
[https://doi.org/10.1121/1.1417528]
-
Mooney, W.D. and Brocher, T.M., 1987, Coincident seismic reflection/refraction studies of the continental lithosphere: A global review. Reviews of Geophysics, 25, 723-742.
[https://doi.org/10.1029/RG025i004p00723]
-
Park, S., Chang, S.-J., Kim, K.-H. and Sohn, Y.J., 2026, Crustal S-wave velocity structure beneath Gangwon Province, the Korean Peninsula, inferred from Helmholtz tomography. Geophysical Journal International, 244, ggaf440.
[https://doi.org/10.1093/gji/ggaf440]
-
Park, S., Chang, S.-J., Lee, J., Chung, D., Kim, B., Park, S. and Hong, T.-K., 2024, Crustal and uppermost mantle S-velocity structure of the Seoul metropolitan area on the Korean Peninsula from Helmholtz tomography. Tectonophysics, 891, 230518.
[https://doi.org/10.1016/j.tecto.2024.230518]
-
Shapiro, N.M. and Campillo, M., 2004, Emergence of broadband Rayleigh waves from correlations of the ambient seismic noise. Geophysical Research Letters, 31, L07614.
[https://doi.org/10.1029/2004GL019491]
-
Shapiro, N.M., Campillo, M., Stehly, L. and Ritzwoller, M.H., 2005, High-Resolution Surface-Wave Tomography from Ambient Seismic Noise. Science, 307, 1615-1618.
[https://doi.org/10.1126/science.1108339]
-
Song, J.-H., Kim, S., Rhie, J., Lee, S.-H., Kim, Y. and Kang, T.-S., 2018, Imaging of lithospheric structure beneath Jeju Volcanic Island by teleseismic traveltime tomography. Journal of Geophysical Research: Solid Earth, 123, 6784-6801.
[https://doi.org/10.1029/2018JB015979]
-
Song, J.-H., Kim, S., Rhie, J. and Park, D., 2022, Moment tensor solutions for earthquakes in the southern Korean Peninsula using three-dimensional seismic waveform simulations. Frontiers in Earth Science, 10, 945022.
[https://doi.org/10.3389/feart.2022.945022]
-
Tape, C., Liu, Q., Maggi, A. and Tromp, J., 2009, Adjoint Tomography of the Southern California Crust. Science, 325, 988-992.
[https://doi.org/10.1126/science.1175298]
-
Tarantola, A., 1984, Inversion of seismic reflection data in the acoustic approximation. Geophysics, 49, 1259-1266.
[https://doi.org/10.1190/1.1441754]
-
Tromp, J., Tape, C. and Liu, Q., 2005, Seismic tomography, adjoint methods, time reversal and banana-doughnut kernels. Geophysical Journal International, 160, 195-216.
[https://doi.org/10.1111/j.1365-246X.2004.02453.x]
-
Weaver, R.L. and Lobkis, O.I., 2001, Ultrasonics without a Source: Thermal Fluctuation Correlation at MHz Frequencies. Physical Review Letters, 87, 134301.
[https://doi.org/10.1103/PhysRevLett.87.134301]
-
Yoo, H.J., Herrmann, R.B., Cho, K.H. and Lee, K., 2007, Imaging the Three-Dimensional Crust of the Korean Peninsula by Joint Inversion of Surface-Wave Dispersion and Teleseismic Receiver Functions. Bulletin of the Seismological Society of America, 97, 1002-1011.
[https://doi.org/10.1785/0120060134]
- Yoo, H.J. and Lee, K.H., 2001, Crustal Structure under the Taejon (TJN) Station by Receiver Function Methods. Geophysics and Geophysical Exploration, 4, 35-46.
-
Zelt, C.A. and Smith, R.B., 1992, Seismic traveltime inversion for 2-D crustal velocity structure. Geophysical Journal International, 108, 16-34.
[https://doi.org/10.1111/j.1365-246X.1992.tb00836.x]
-
Zhu, L. and Kanamori, H., 2000, Moho depth variation in southern California from teleseismic receiver functions. Journal of Geophysical Research, 105, 2969-2980.
[https://doi.org/10.1029/1999JB900322]