심부 지하 연구 실험실 부지 특성화를 위한 변성암 복합체의 삼차원 지질 모델링
초록
심부 지하 연구 실험실 부지로 고려되고 있는 한국 경상북도 안동시 송천동 지역에 분포하는 불균질한 변성암 복합체의 지층 및 암상 분포를 정량적으로 특성화하고 사실적으로 가시화하기 위하여 삼차원 지질 모델링 기술을 이용한 일련의 삼차원 지질 모델링을 수행하였다. 첫 번째로 지표 지질도가 반영된 수치 표고 모델(DEM) 및 지층정보를 포함한 가상 시추공을 사용하여 지층 경계면 분포를 예측하는 삼차원 층서 모델링을 불연속 평활 보간법(DSI)을 이용하여 수행하였다. 두 번째로 삼차원 층서 모델의 지층 경계면에 기초하여 지층 경계면 사이의 공간을 육면체 격자로 이산화하는 삼차원 격자 모델링을 수행하였다. 세 번째로 삼차원 층서 모델 및 격자 모델을 중합하여 지층 분포를 가시화하는 삼차원 지층 모델링을 수행하였다. 네 번째로 지표 지질도가 반영된 수치 표고 모델 및 지층 정보를 포함한 가상 시추공 외에 암상 정보를 포함한 실제 시추공을 사용하여 고철질 편마암(MGN), 화강암질 편마암(GGN) 및 호상 편마암(BGN)과 같은 세 가지 종류의 암상이 혼재되어 있는 불균질한 편리상 화강암질 편마암(SGG)에 대해서만 암상 분포 및 체적 비율을 예측하는 삼차원 암상 모델링을 수행하였다. 우선 편리상 화강암질 편마암의 엽리 구조의 방향을 사용하여 최적의 이론적 베리오그램을 선정하였으며, 이를 이용하여 조건부 시뮬레이션 기법의 일종인 순차 지시 시뮬레이션(SIS) 및 절단 가우시안 시뮬레이션(TGS)을 각각 수행하였다. 실제 시추공 자료 통계 분석 및 관찰 결과와 마찬가지로 조건부 시뮬레이션 결과는 고철질 편마암이 나머지 두 암상들에 비해서 압도적으로 많이 분포하며, 순차 지시 시뮬레이션 결과에 비해서 절단 가우시안 시뮬레이션 결과에서 화강암질 편마암 및 호상 편마암이 보다 더 산점상으로 산재하여 분포함을 보여준다. 한편 순차 지시 시뮬레이션 결과에 비해서 절단 가우시안 시뮬레이션 결과에서 암상 체적 비율이 실제 시추공 자료 통계 분석 결과와 상대적으로 보다 더 유사하다. 따라서 전반적으로 절단 가우시안 시뮬레이션을 이용한 삼차원 암상 모델이 순차 지시 시뮬레이션을 이용한 삼차원 암상 모델보다 지질학적 및 통계학적 측면에서 좀 더 높은 신뢰성을 나타낸다.
Abstract
A series of three-dimensional geologic modeling is performed using a three-dimensional geologic model to characterize quantitatively and visualize realistically distributions of geologic formations and lithofacies of a heterogeneous metamorphic complex, which is considered as a prospective deep underground research laboratory site, distributed in Songcheon-Dong, Andong-Si, Gyeongsangbuk-Do, Korea. First, three-dimensional stratigraphic modeling is performed using the digital elevation model (DEM) with the surface geologic map, the virtual boreholes with the geologic formation informations, and the discrete smooth interpolation (DSI) method to predict distributions of geologic formation boundaries. Second, three-dimensional grid modeling is performed based on the geologic formation boundaries of the three-dimensional stratigraphic model to dicretize spaces between the geologic formation boundaries into hexahedral grids. Third, three-dimensional geologic formation modeling is performed polymerizing the three-dimensional stratigraphic model and grid model to visualize distributions of geologic formations. Fourth, three-dimensional lithofacies modeling is performed using the actual boreholes with the lithofacies informations as well as the digital elevation model with the surface geologic map and the virtual boreholes with the geologic formation informations to predict distributions and volume fractions of lithofacies of the heterogeneous Schistose Granitic Gneiss (SGG), which has three different lithofacies such as mafic gneiss (MGN), granitic gneiss (GGN), and banded gneiss (BGN). An optimal theoretical variogram is selected using the orientation of foliation structures in the Schistose Granitic Gneiss, and the sequential indicator simulation (SIS) and truncated Gaussian simulation (TGS), which are kinds of conditional simulations, are then performed respectively. The results of the conditional simulations show that mafic gneiss is overwhelmingly distributed compared with the other two lithofacies, and granitic gneiss and banded gneiss are more disseminated and scattered in the results of the truncated Gaussian simulation compared with those of the sequential indicator simulation similarly to the results of the statistical analyses and observations of the actual boreholes. On the other hand, the volume fractions of the lithofacies in the results of the truncated Gaussian simulation are relatively more similar to the results of the statistical analyses of the actual boreholes compared with those of the sequential indicator simulation. As a result, the three-dimensional lithofacies model using the truncated Gaussian simulation show higher reliability than that using the sequential indicator simulation in terms of geology and statistics.
Keywords:
deep underground research laboratory, metamorphic complex, heterogeneity, characterization, visualization, three-dimensional geologic modeling키워드:
심부 지하 연구 실험실, 변성암 복합체, 불균질성, 특성화, 가시화, 삼차원 지질 모델링1. 서 론
최근 에너지자원 탐사, 지열 에너지 개발, 방사성 폐기물 지층 처분, 그리고 이산화탄소 지중 저장 등으로 인해 심부 지층에 대한 필요성과 관심이 증대되고 있다. 이러한 심부 지층에 대한 조사 및 연구에서는 지층, 암상 및 물성 분포를 정확하게 파악하는 것이 매우 중요한 과제이다. 따라서 이를 파악하는데 있어서 물리 탐사 보다 더 정확한 방법인 시추 조사에 주로 의존하게 된다. 그러나 비용, 인력 및 시간 등의 문제로 충분한 시추가 이루어지지 못하는 경우가 많이 발생하기 때문에 심부 지질 자료 획득에 한계성을 가진다(Koo et al., 2006). 이와 같은 문제점을 극복하기 위해서 지구통계학적 기법을 통해 심부 지질을 정량적으로 특성화하고 사실적으로 가시화하는 삼차원 지질 모델링(three-dimensional geologic modeling)이 널리 이루어지고 있다. 앞으로 심부 지층에 대한 조사 및 연구에는 이러한 삼차원 지질 모델링 기술을 기반으로 한 다양한 연구들이 선행 또는 병행되어야 한다.
최근 지구통계학적 기법을 이용하여 삼차원 지질 모델링에 대한 다양한 연구들이 수행되어 왔다. 먼저 퇴적분지의 구조 ․ 층서적인 특성을 분석하기 위해 삼차원 구조 및 층서 모델링이 수행된 바 있다(예, Guyonnet-Benaize et al., 2010; Vilain, 2010). 그리고 퇴적분지의 지형 및 지층 특성 등을 반영하는 삼차원 격자 및 지층 모델링이 수행된 바 있다(예, Gwak and Lee, 2001; Kaufmann and Martin, 2008; Zanchi et al., 2009). 또한 암체 암상과 물성 및 광체 품위에 대한 공간적 분포를 예측하고 불확실성을 정량적으로 평가하기 위해 삼차원 암상 및 물성 모델링이 수행된 바 있다(예, Koo and Jeon, 2005; Kim and Park, 2009; de Almeida, 2010; Kim et al., 2010; Jeong and Jang, 2011; Wang and Huang, 2012). 한편 아직까지 변성암류(metamorphic rocks) 또는 변성암 복합체(metamorphic complex)에 대해서 삼차원 구조, 층서, 격자, 지층, 그리고 암상 및 물성 모델링을 종합적으로 수행하여 삼차원 지질 모델을 수립하는 연구는 시도된 바가 없다.
심부 지하 연구 실험실(deep underground research laboratory, DURL)에 대한 필요성은 요구되는 관련 심부 과학 실험의 원위치 조건 구현에 기인한다. 그러나 그러한 심부 지하 연구 실험실의 건설과 운영은 깊은 심도와 그에 따른 높은 지질학적 불균질성 및 불확실성 때문에 많은 노력과 비용이 소요된다. 이러한 이유로 인해서 심부 지하 연구 실험실의 건설과 운영 이전에 심부 지하 연구 실험실 부지의 지질을 정량적으로 특성화하고 사실적으로 가시화하는 것이 매우 결정적이다.
본 연구의 목적은 삼차원 지질 모델링 기술을 이용하여 최근에 심부 지하 연구 실험실 부지로 고려되고 있는 연구 지역에 분포하는 불균질한 변성암 복합체의 지층 및 암상 분포를 정량적으로 특성화하고 사실적으로 가시화하는 것이다. 이를 달성하기 위하여 먼저 연구 지역에 대한 수치 지형도, 지표 지질도 및 시추공 검층 및 코어 자료와 같은 원시 자료를 수집하여 분석하고 전산화하였으며, 이를 사용하여 삼차원 지질 모델링을 위한 기본적인 전산 입력자료를 생성하고 전산화하였다. 생성된 전산 입력자료는 수치 지형도를 합성하고 지표 지질도가 반영된 수치 표고 모델, 지층 정보를 포함한 가상 시추공 및 암상 정보를 포함한 실제 시추공 등이다. 그리고 이러한 전산 입력 자료를 사용하여 삼차원 층서 모델링, 삼차원 격자 모델링, 삼차원 지층 모델링 및 삼차원 암상 모델링을 순차적으로 수행하였다.
2. 연구 지역
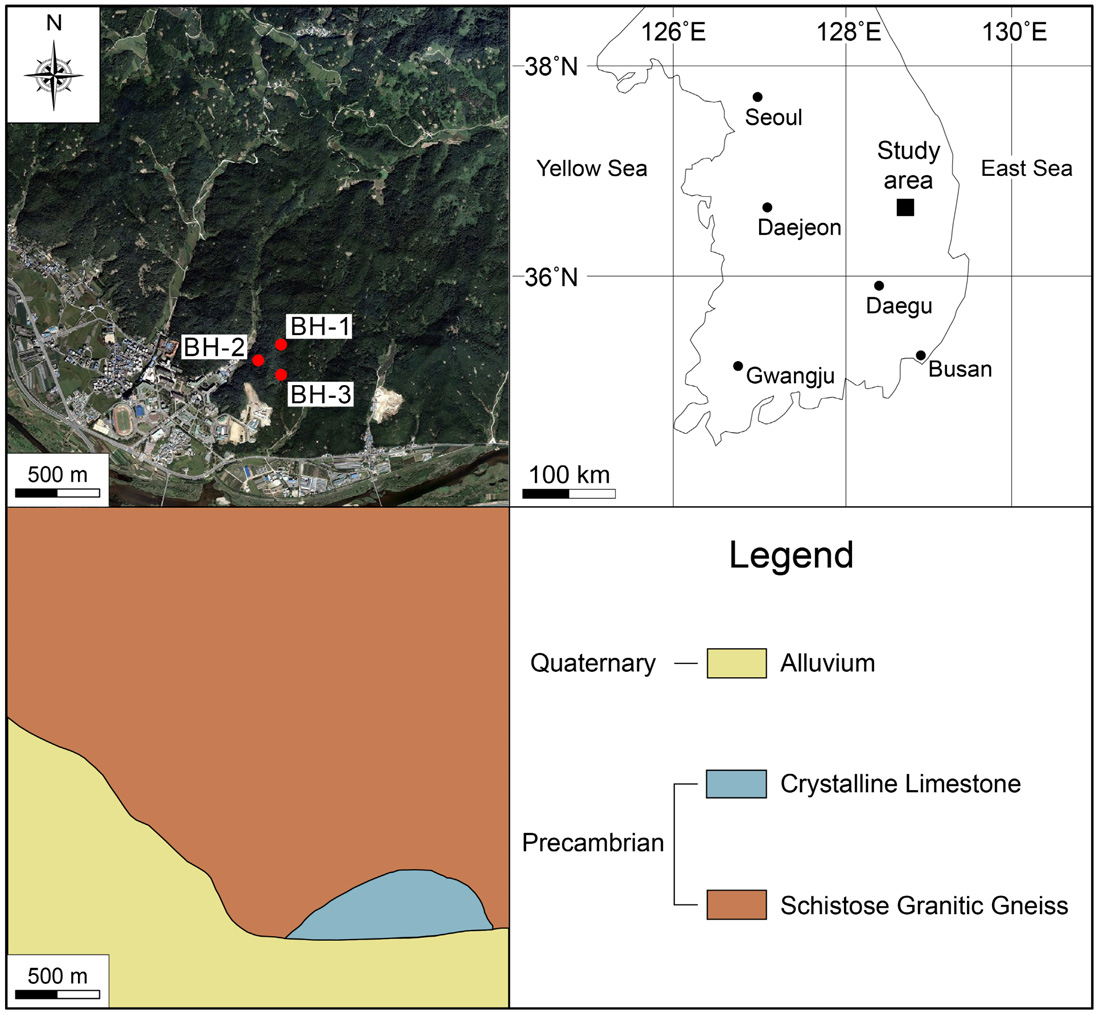
연구 지역은 한국 경상북도 안동시 송천동 일대에 해당하는 지역이며, 경·위도 상 동경 128° 47’ 02”~128° 49’ 10”와 북위 36° 32’ 10”~36° 33’ 53”에 위치하고 있다(그림 1). 지질학적으로 경상분지 북단에 속해있는 연구 지역의 지질은 선캠브리아기 편리상 화강암질 편마암(Schistose Granitic Gneiss, SGG) 및 결정질 석회암(Crystalline Limestone, CLS)을 기반암으로 하여 제4기 충적층(Alluvium, ALV)으로 구성되어 있다(Kim et al., 1970) (그림 1). 편리상 화강암질 편마암은 일종의 불균질한 변성암 복합체(metamorphic complex)로서 고철질 편마암(mafic gneiss, MGN), 화강암질 편마암(granitic gneiss, GGN) 및 호상 편마암(banded gneiss, BGN)과 같은 세 가지 종류의 암상으로 구성되어 있다. 결정질 석회암은 단일 암상으로 구성되어 있다. 이러한 편리상 화강암질 편마암과 결정질 석회암은 치밀하고 풍화를 거의 받지 않아 신선하다. 그리고 충적층은 주로 모래와 자갈의 토양으로 구성되어 있다. 한편 연구 지역에서는 뚜렷한 단층 구조가 관찰되지 않는다. 이러한 이유 때문에 연구 지역은 최근에 심부 지하 연구 실험실 부지로 고려되고 있다.
3. 삼차원 지질 모델링 개요
3.1 삼차원 지질 모델
본 연구에서 삼차원 지질 모델링에 이용된 프로그램은 GOCAD Research Group에서 개발한 GOCAD(Geological Object Computer Aided Design) (Paradigm, 2012)로서 지질 구조 해석이나 격자 모델 생성 및 물성 분포 시뮬레이션, 그리고 탄성파 탐사 자료 해석 등 다양한 기능을 제공하는 삼차원 지질 모델링 소프트웨어이다. 이 소프트웨어는 에너지자원 탐사, 지열 에너지 개발, 방사성 폐기물 지층 처분, 그리고 이산화탄소 지중 저장 등의 매우 다양한 분야에서 활용되고 있다.
3.2 삼차원 지질 모델링 작업흐름도
본 연구를 통해서 수행하고자 하는 삼차원 지질 모델링의 개념을 좀 더 명확하게 정립하기 위해서 작업흐름도로 그 방법론을 정의하였다(그림 2). 먼저 연구 지역에 대한 수치 지형도(그림 2a), 지표 지질도(그림 2b) 및 시추공 검층 및 코어 자료(그림 2c)와 같은 원시 자료를 수집하여 분석하고 전산화하며, 이를 사용하여 삼차원 지질 모델링을 위한 기본적인 전산 입력 자료를 생성하고 전산화한다. 생성된 전산 입력 자료는 수치 지형도를 합성하고 지표 지질도가 반영된 수치 표고 모델(그림 2d), 지층 정보를 포함한 가상 시추공(그림 2e) 및 암상 정보를 포함한 실제 시추공(그림 2f) 등이다. 그리고 이러한 전산 입력 자료를 사용하여 삼차원 층서 모델링(그림 2g), 삼차원 격자 모델링(그림 2h), 삼차원 지층 모델링(그림 2i) 및 삼차원 암상 모델링(그림 2j)을 순차적으로 수행한다.
3.3 삼차원 지질 모델링 영역
본 연구에서는 신뢰도 높은 삼차원 지질 모델링을 수행하기 위하여 상기한 시추공 검층 및 코어 자료가 포함되어 있는 연구 지역의 수평 영역(그림 1)과 동일한 동서 3,000 m, 남북 3,000 m, 그리고 해수면 기준 심도 1,000 m 영역을 삼차원 지질 모델링 영역(geologic modeling domain)으로 설정하였다. 이러한 삼차원 지질 모델링 영역은 경·위도 상 동경 128° 47’ 02”~128° 49’ 10”와 북위 36° 32’ 10”~36° 33’ 53”에 위치하고 있으며(그림 1), 수치 지형도를 합성하고 지표 지질도가 반영된 수치 표고 모델을 포함하고 있다(그림 3a).
3.4 원시 자료 분석 및 전산화
먼저 연구 지역에 대한 수치 지형도(National Geographic Information Institute, 2013) (그림 3a), 지표 지질도(Kim et al., 1970) (그림 3a) 및 시추공(BH-1, BH-2, BH-3) 검층 및 코어 자료(Korea Institute of Geoscience and Mineral Resources, 2013) (그림 3b)와 같은 원시 자료를 수집하여 분석하고 전산화하였다. 그런데 이러한 3개의 실제 시추공(BH-1, BH-2, BH-3)에서는 오직 편리상 화강암질 편마암(SGG)만 관찰되며, 연구 지역 남부에 분포하는 결정질 석회암(CLS) 및 충적층(ALV)은 관찰되지 않는다(그림 3b). 따라서 삼차원 지질 모델링 영역(그림 3a) 내에서 모든 지층의 전반적인 분포를 파악하기 위하여 지표 지질도로부터 추정된 지층 경계면 정보를 가지는 일련의 가상 시추공을 생성하고 전산화하였다. 이러한 가상 시추공은 삼차원 지질 모델링 영역(그림 3a) 내에서 동서 및 남북 방향으로 각각 500 m 간격으로 분포하며, 총 49 (7 × 7)개이다(그림 3c). 이러한 49개의 가상 시추공으로부터 얻어진 지층 상부면의 심도 자료는 표 1에 정리되어 있다. 한편 편리상 화강암질 편마암은 3개의 실제 시추공에서도 상기한 바와 같이 일종의 불균질한 변성암 복합체로서 고철질 편마암(MGN), 화강암질 편마암(GGN) 및 호상 편마암(BGN)과 같은 세 가지 종류의 암상으로 구성되어 있으며, 치밀하고 풍화를 거의 받지 않아 신선하다. 이러한 3개의 실제 시추공으로부터 얻어진 편리상 화강암질 편마암의 암상 정보 자료에 대해 통계 분석을 수행하였으며, 그 결과는 표 2에 정리되어 있다. 표에서 보다시피 고철질 편마암이 93.89%, 화강암질 편마암이 5.38%, 호상 편마암이 0.73%로 고철질 편마암이 압도적으로 많이 분포한다.
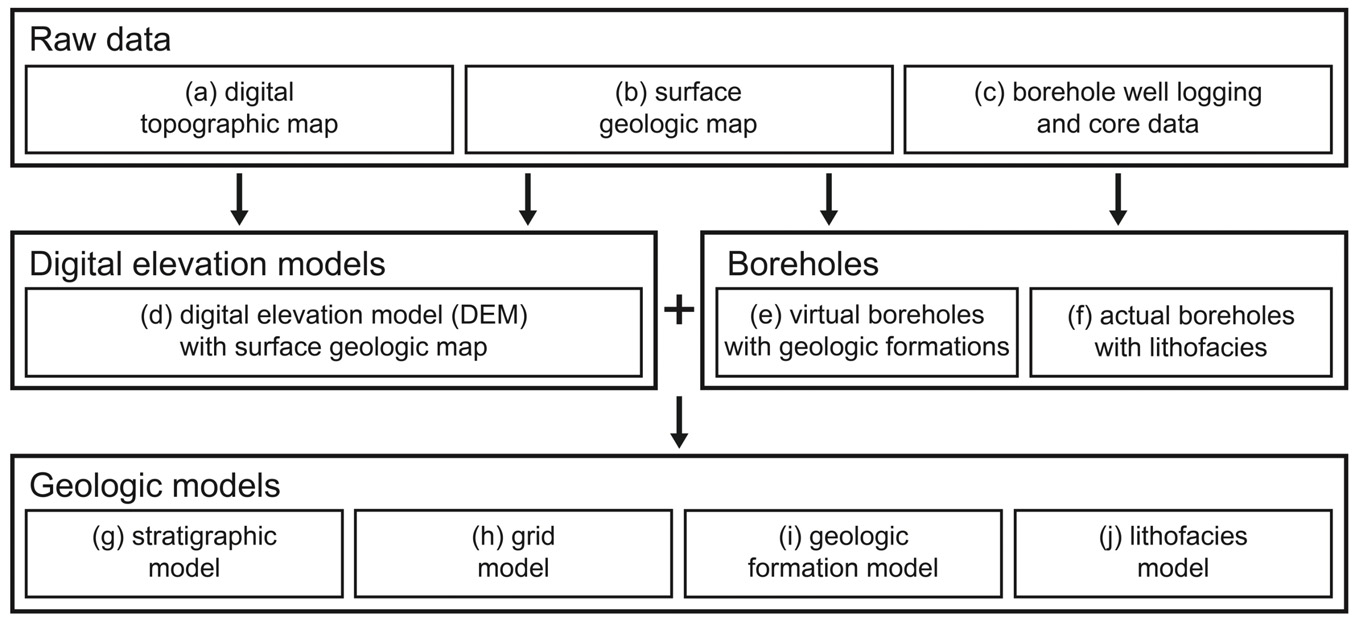
Work flow chart of three-dimensional geologic modeling of the study area through (a) digital topographic map, (b) surface geologic map, (c) borehole well logging and core data, (d) digital elevation model (DEM) with surface geologic map, (e) virtual boreholes with geologic formations, (f) actual boreholes with lithofacies, (g) stratigraphic model, (h) grid model, (i) geologic formation model, and (j) lithofacies model.
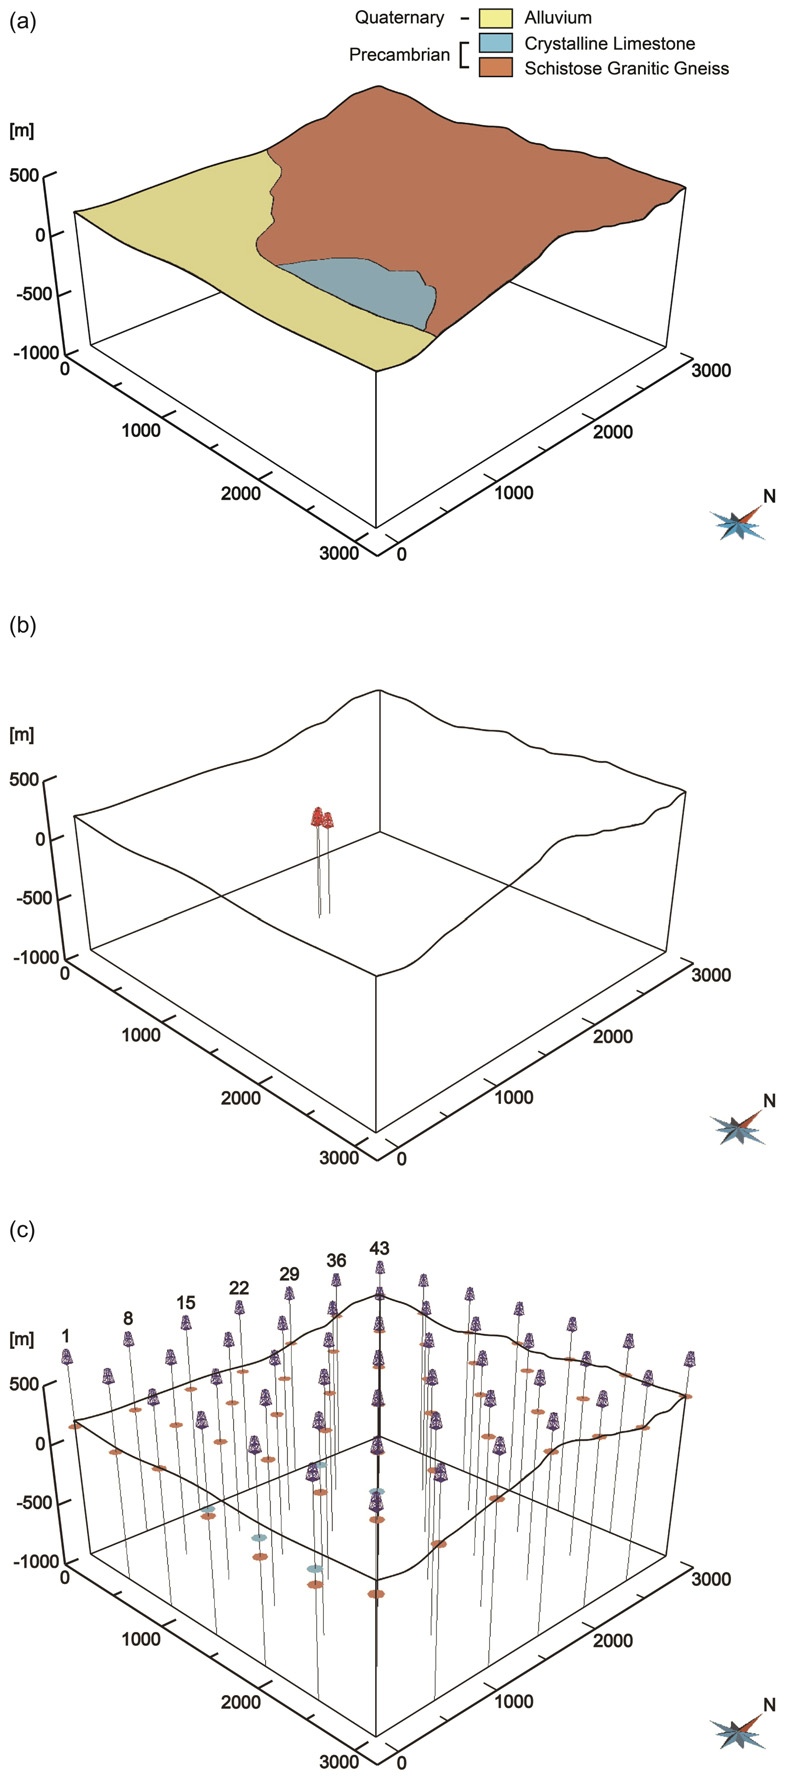
Three-dimensional spatial distributions of (a) geologic modeling domain (digital elevation model with surface geologic map), (b) 3 actual boreholes with lithofacies, and (c) 49 virtual boreholes with geologic formations in the study area.
4. 삼차원 지질 모델링 결과
4.1 삼차원 층서 모델링
삼차원 층서 모델링에서는 앞서 수행된 원시 자료 분석 및 전산화를 통해 얻은 지표 지질도가 반영된 수치 표고 모델(그림 3a) 및 지층 정보를 포함한 49개의 가상 시추공(그림 3c; 표 1)이 각각 지표면 및 지하에서의 지층 경계면으로 사용되었다. 이와 같은 지표 지질도가 반영된 수치 표고 모델 및 지층 정보를 포함한 49개의 가상 시추공으로부터 삼차원 지질 모델링 영역 전체에서 지층 경계면 분포를 예측하는 삼차원 층서 모델링을 불연속 평활 보간법(discrete smooth interpolation, DSI method) (Mallet, 1989)을 이용하여 수행하였으며, 그 결과는 그림 4와 같다. 그림에서 보다시피 생성된 삼차원 층서 모델은 하부로부터 편리상 화강암질 편마암(SGG) 상부면(그림 4a), 결정질 석회암(CLS) 상부면(그림 4b) 및 충적층(ALV) 상부면(그림 4c) 순으로 총 3개의 지층 경계면으로 구성되어 있다. 또한 그림에서 보다시피 삼차원 지질 모델링 영역 내에서 지표면을 기준으로 편리상 화강암질 편마암 상부면 심도는 0~252 m, 결정질 석회암 상부면 심도는 0~115 m, 그리고 충적층 상부면(본 연구에서는 지표면) 심도는 0 m이다.
4.2 삼차원 격자 모델링
상기한 삼차원 층서 모델의 지층 경계면에 기초하여 지층 경계면 사이의 공간을 육면체 격자로 이산화하는 삼차원 격자 모델링을 수행하였으며, 그 결과는 그림 5와 같다. 그림에서 보다시피 생성된 삼차원 격자 모델은 동서 방향으로 100개, 남북 방향으로 100개, 수직 방향으로 50개로 총 500,000개의 육면체 격자로 이산화되어 있다. 특히 삼차원 층서 모델링을 통해 생성된 지층 상부면 중 결정질 석회암(CLS) 및 충적층(ALV) 상부면 주변에서 육면체 격자가 세밀하게 제작되었으며, 인접한 두 지층 상부면의 간격이 좁아지는 부분에서도 육면체 격자가 세밀하게 제작되었다. 그리고 생성된 삼차원 격자 모델은 삼차원 층서 모델링을 통해 생성된 총 3개의 지층 상부면을 경계로 총 3개의 지층 구역(block)으로 분리되어 있다. 한편 삼차원 지질 모델링 영역 내에서 이들 3개의 지층 구역별 격자의 수는 표 3에 정리되어 있다.
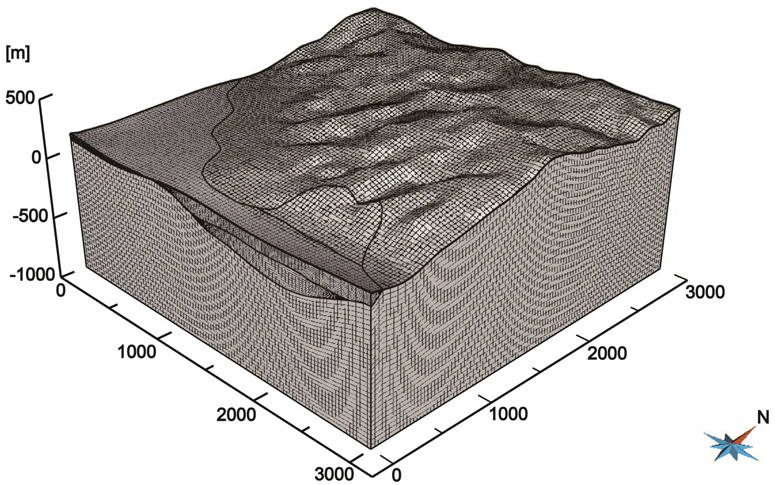
Three-dimensional grid model of the study area with boundaries of Schistose Granitic Gneiss (SGG), Crystalline Limestone (CLS), and Alluvium (ALV).
4.3 삼차원 지층 모델링
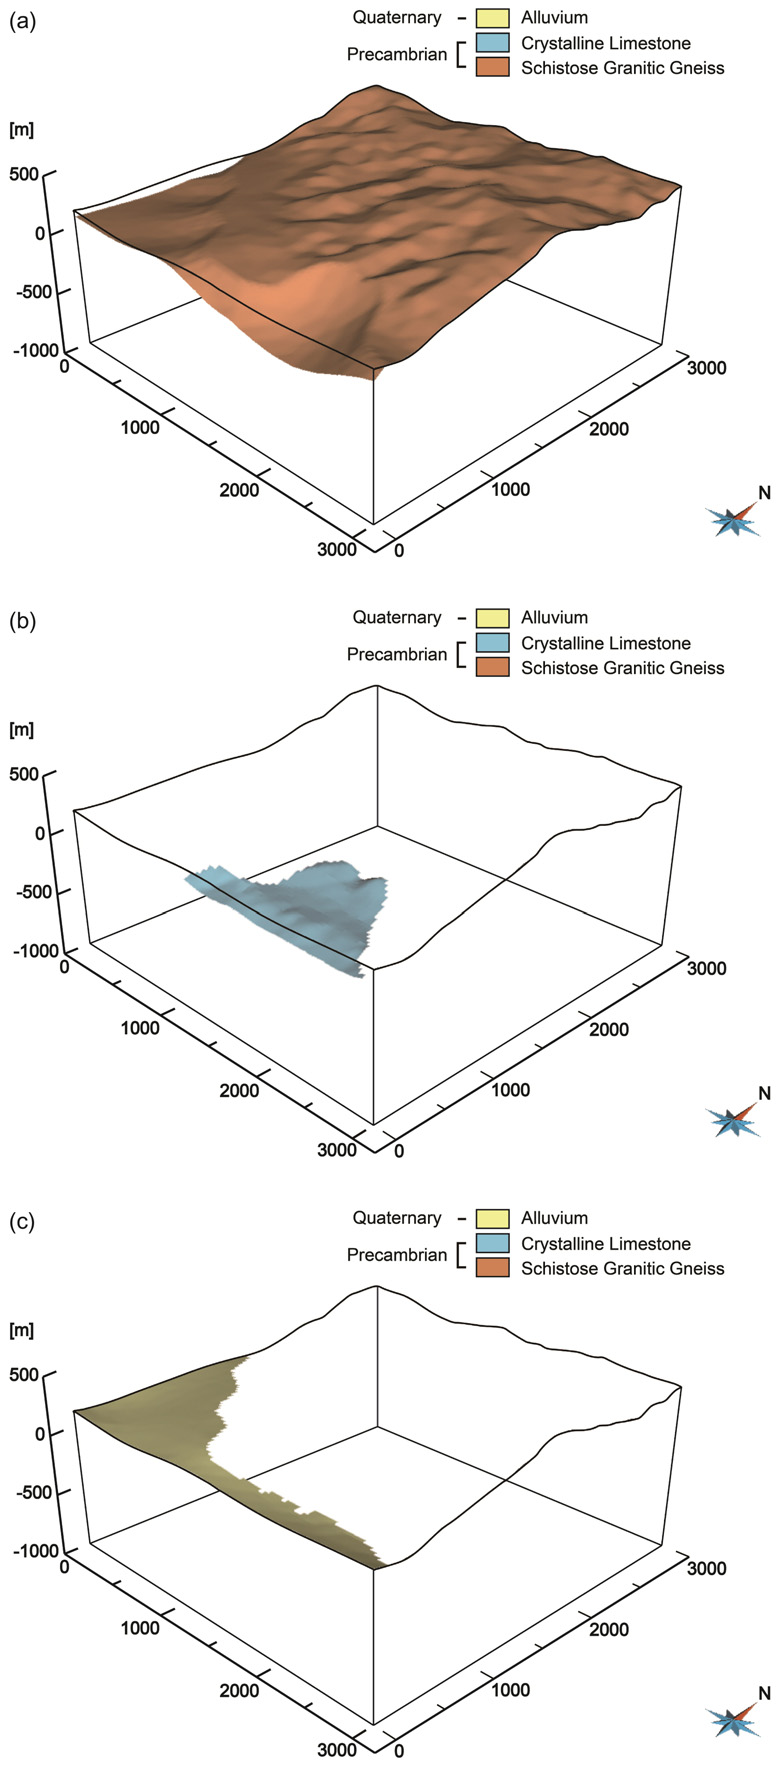
상기한 삼차원 층서 모델 및 격자 모델을 중합하여 지층 분포를 가시화하는 삼차원 지층 모델링을 수행하였으며, 그 결과는 그림 6과 같다. 그림에서 보다시피 생성된 삼차원 지층 모델은 하부로부터 편리상 화강암질 편마암(SGG) (그림 6a), 결정질 석회암(CLS) (그림 6b) 및 충적층(ALV) (그림 6c) 순으로 총 3개의 지층으로 구성되어 있다. 한편 삼차원 지질 모델링 영역 내에서 이들 3개의 지층 구역별 체적 및 체적 비율은 표 3에 정리되어 있다. 표에서 보다시피 3개의 지층들 중에서는 편리상 화강암질 편마암이 가장 많이 분포하며, 충적층이 가장 적게 분포한다.
4.4 삼차원 암상 모델링
삼차원 암상 모델링에서는 앞서 수행된 원시 자료 분석 및 전산화를 통해 얻은 지표 지질도가 반영된 수치 표고 모델(그림 3a) 및 지층 정보를 포함한 49개의 가상 시추공(그림 3c; 표 1) 외에 암상 정보를 포함한 3개의 실제 시추공(그림 3b; 표 2)이 사용되었다. 그리고 결정질 석회암(CLS) 및 충적층(ALV)은 각각 석회암 및 토양(모래, 자갈)과 같은 단일 암상으로만 구성되어 있기 때문에 암상 분포 및 체적 비율을 예측하는 삼차원 암상 모델링을 수행하지 않았으며, 고철질 편마암(MGN), 화강암질 편마암(GGN) 및 호상 편마암(BGN)과 같은 세 가지 종류의 암상이 혼재되어 있는 불균질한 편리상 화강암질 편마암(SGG)에 대해서만 암상 분포 및 체적 비율을 예측하는 삼차원 암상 모델링을 수행하였다. 따라서 3개의 실제 시추공(BH-1, BH-2, BH-3)에 존재하는 편리상 화강암질 편마암의 고철질 편마암, 화강암질 편마암 및 호상 편마암 암상 정보 자료에 대해서만 베리오그램 분석(variogram analysis) 후에 조건부 시뮬레이션을 수행하였다.
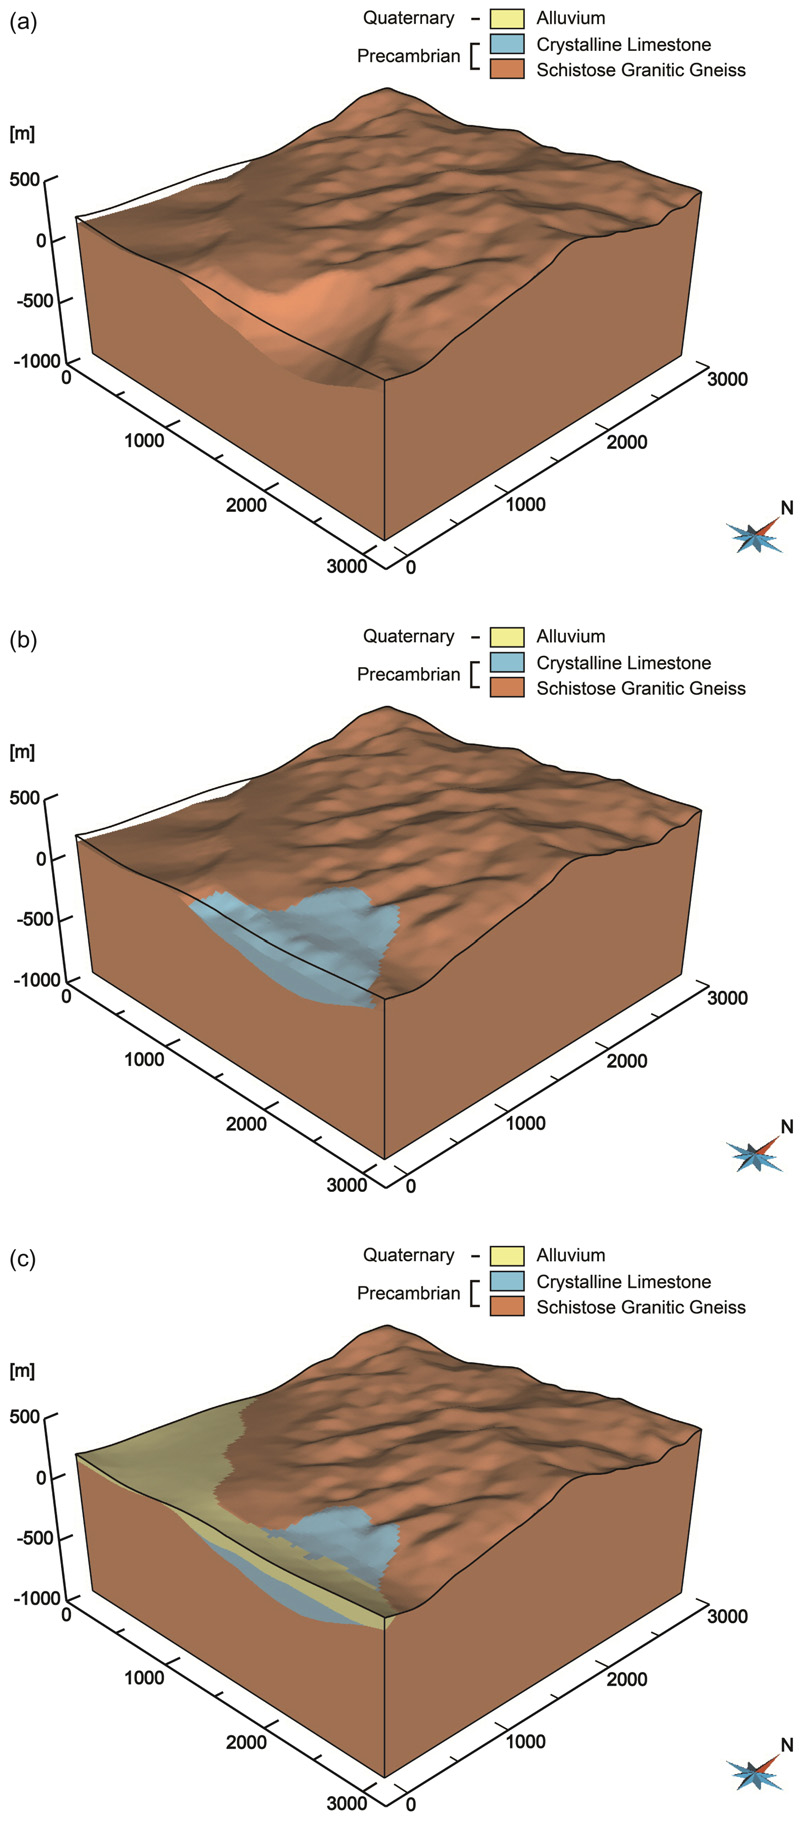
Three-dimensional geologic formation model of the study area with (a) Schistose Granitic Gneiss (SGG), (b) Crystalline Limestone (CLS), and (c) Alluvium (ALV).
3개의 실제 시추공에서 암상의 공간적 상관 관계를 파악하기 위해서 베리오그램 분석(Journel and Huijbregts, 1978; Cressie, 1993)을 수행하였다. 먼저 한 기준점을 중심으로 암상의 방위(azimuth)는 0°에서 180°까지 45° 간격으로, 경사(dip)는 0°에서 90°까지 10° 간격으로 다양한 경우에 대해서 각각 실험적 베리오그램을 계산하였다. 다음으로 세 가지 이론적 베리오그램 모델인 구형 모델(spherical model), 가우시안 모델(Gaussian model) 및 지수 모델(exponential model) 등을 이용하여 이론적 베리오그램을 계산하였다. 그리고 계산된 실험적 베리오그램을 가장 잘 대표할 수 있는, 따라서 삼차원 암상 모델링에 이용될 최적의 이론적 베리오그램을 선정하였다. 이때 이용된 세 가지 조건 중에서 상관 거리(range)는 그 값이 클수록, 회귀오차제곱합(sum of squares of regression error, SSR)은 추정 값과 자료 평균 값과의 차이의 제곱으로서 그 값이 작을수록, 결정계수(coefficient of determination, R2)는 회귀식의 적합도로서 그 값이 1에 가까울수록 최적의 이론적 베리오그램을 의미한다. 하지만 3개의 실제 시추공 자료가 너무 적고 서로 밀집되어 있어서 상기한 세 가지 조건을 만족하는 최적의 이론적 베리오그램을 선정할 수가 없었다. 이에 연구 지역의 지질 자료(Kim et al., 1970; Korea Institute of Geoscience and Mineral Resources, 2013)로부터 편리상 화강암질 편마암(SGG)의 엽리(foliation) 구조의 방향을 사용하여 방위 90°와 경사 70°의 구형 모델을 삼차원 암상 모델링에 이용될 최적의 이론적 베리오그램으로 선정하였다. 이렇게 선정된 최적의 이론적 베리오그램은 삼차원 지질 모델링 영역 내에 분포하는 불균질한 편리상 화강암질 편마암의 암상 특성을 잘 반영하는 것으로 판단된다.
편리상 화강암질 편마암(SGG)의 엽리 구조의 방향을 사용하여 선정된 최적의 이론적 베리오그램을 이용하여 불균질한 편리상 화강암질 편마암 내 고철질 편마암(MGN), 화강암질 편마암(GGN) 및 호상 편마암(BGN)의 암상 분포 및 체적 비율을 예측하기 위하여 조건부 시뮬레이션 기법의 일종인 순차 지시 시뮬레이션(sequential indicator simulation, SIS) (Alabert, 1987) 및 절단 가우시안 시뮬레이션(truncated Gaussian simulation, TGS) (Matheron et al., 1987)을 각각 100회씩 수행하였으며, 그 중에서 각각 제1회에 해당하는 결과는 각각 그림 7 및 그림 8과 같다. 그림에서 보다시피 3개의 실제 시추공 자료 통계 분석 결과(표 2)와 마찬가지로 조건부 시뮬레이션 결과에서도 고철질 편마암이 나머지 두 암상들에 비해서 압도적으로 많이 분포한다. 또한 3개의 실제 시추공 자료 관찰 결과와 마찬가지로 순차 지시 시뮬레이션 결과에 비해서 절단 가우시안 시뮬레이션 결과에서 화강암질 편마암 및 호상 편마암이 보다 더 산점상으로 산재하여 분포한다. 한편 각각 100회씩의 순차 지시 시뮬레이션 및 절단 가우시안 시뮬레이션 결과는 표 4에 정리되어 있다. 표에서 보다시피 평균값(mean)이 순차 지시 시뮬레이션 결과에서는 고철질 편마암이 9.7434 × 10⁹ m3 (92.33%), 화강암질 편마암이 4.1614 × 10⁸ m3 (3.94%), 호상 편마암이 3.9391 × 10⁸ m3 (3.73%)이며, 절단 가우시안 시뮬레이션 결과에서는 고철질 편마암이 1.0035 × 10¹⁰ m3 (95.08%), 화강암질 편마암이 2.6560 × 10⁸ m3 (2.52%), 호상 편마암이 2.5382 × 10⁸ m3 (2.40%)이다. 즉 순차 지시 시뮬레이션 결과에 비해서 절단 가우시안 시뮬레이션 결과에서 암상 체적 비율이 3개의 실제 시추공 자료통계 분석 결과(표 2)인 고철질 편마암 93.89%, 화강암질 편마암 5.38%, 호상 편마암 0.73%와 상대적으로 보다 더 유사하다. 따라서 전반적으로 절단 가우시안 시뮬레이션을 이용한 삼차원 암상 모델이 순차 지시 시뮬레이션을 이용한 삼차원 암상 모델보다 지질학적 및 통계학적 측면에서 좀 더 높은 신뢰성을 나타낸다.
5. 결 론
심부 지하 연구 실험실 부지로 고려되고 있는 한국 경상북도 안동시 송천동 지역에 분포하는 불균질한 변성암 복합체의 지층 및 암상 분포를 정량적으로 특성화하고 사실적으로 가시화하기 위하여 삼차원 지질 모델링 기술을 이용한 일련의 삼차원 지질 모델링을 수행하였다. 이를 달성하기 위하여 먼저 연구 지역에 대한 수치 지형도, 지표 지질도 및 시추공 검층 및 코어 자료와 같은 원시 자료를 수집하여 분석하고 전산화하였으며, 이를 사용하여 삼차원 지질 모델링을 위한 기본적인 전산 입력 자료를 생성하고 전산화하였다. 생성된 전산 입력 자료는 수치 지형도를 합성하고 지표 지질도가 반영된 수치 표고 모델, 지층 정보를 포함한 가상 시추공 및 암상 정보를 포함한 실제 시추공 등이다. 그리고 이러한 전산입력 자료를 사용하여 삼차원 층서 모델링, 삼차원 격자 모델링, 삼차원 지층 모델링 및 삼차원 암상 모델링을 순차적으로 수행하였다. 첫 번째로 지표 지질도가 반영된 수치 표고 모델 및 지층 정보를 포함한 가상 시추공을 사용하여 지층 경계면 분포를 예측하는 삼차원 층서 모델링을 불연속 평활 보간법을 이용하여 수행하였다. 이렇게 생성된 삼차원 층서 모델은 총 3개의 지층 경계면으로 구성되어 있다. 두번째로 삼차원 층서 모델의 지층 경계면에 기초하여 지층 경계면 사이의 공간을 육면체 격자로 이산화하는 삼차원 격자 모델링을 수행하였다. 이렇게 생성된 삼차원 격자 모델은 총 500,000개의 육면체 격자로 이산화되어 있다. 세 번째로 삼차원 층서 모델 및 격자 모델을 중합하여 지층 분포를 가시화하는 삼차원 지층 모델링을 수행하였다. 이렇게 생성된 삼차원 지층 모델은 총 3개의 지층으로 구성되어 있다. 네 번째로 지표 지질도가 반영된 수치 표고 모델 및 지층정보를 포함한 가상 시추공 외에 암상 정보를 포함한 실제 시추공을 사용하여 고철질 편마암(MGN), 화강암질 편마암(GGN) 및 호상 편마암(BGN)과 같은 세 가지 종류의 암상이 혼재되어 있는 불균질한 편리상 화강암질 편마암(SGG)에 대해서만 암상 분포 및 체적 비율을 예측하는 삼차원 암상 모델링을 수행하였다. 우선 편리상 화강암질 편마암의 엽리구조의 방향을 사용하여 최적의 이론적 베리오그램을 선정하였으며, 이를 이용하여 조건부 시뮬레이션 기법의 일종인 순차 지시 시뮬레이션(SIS) 및 절단 가우시안 시뮬레이션(TGS)을 각각 수행하였다. 실제 시추공 자료 통계 분석 및 관찰 결과와 마찬가지로 조건부 시뮬레이션 결과는 고철질 편마암이 나머지 두 암상들에 비해서 압도적으로 많이 분포하며, 순차 지시 시뮬레이션 결과에 비해서 절단 가우시안 시뮬레이션 결과에서 화강암질 편마암 및 호상 편마암이 보다 더 산점상으로 산재하여 분포함을 보여준다. 한편 순차 지시 시뮬레이션 결과에 비해서 절단 가우시안 시뮬레이션 결과에서 암상 체적 비율이 실제 시추공 자료 통계 분석 결과와 상대적으로 보다 더 유사하다. 따라서 전반적으로 절단 가우시안 시뮬레이션을 이용한 삼차원 암상 모델이 순차 지시 시뮬레이션을 이용한 삼차원 암상 모델보다 지질학적 및 통계학적 측면에서 좀 더 높은 신뢰성을 나타낸다. 이와 같이 본 연구를 통해서 제시된 삼차원 지질 모델링 기술과 결과들은 심부 지하 연구 실험실 부지로 고려되는 심부 지층을 정량적으로 특성화하고 사실적으로 가시화하는 데에 매우 유용하게 활용될 수 있으며, 따라서 심부 지하 연구 실험실의 정확한 건설 및 안전한 운영에 실용적인 지침을 제공할 수 있다.
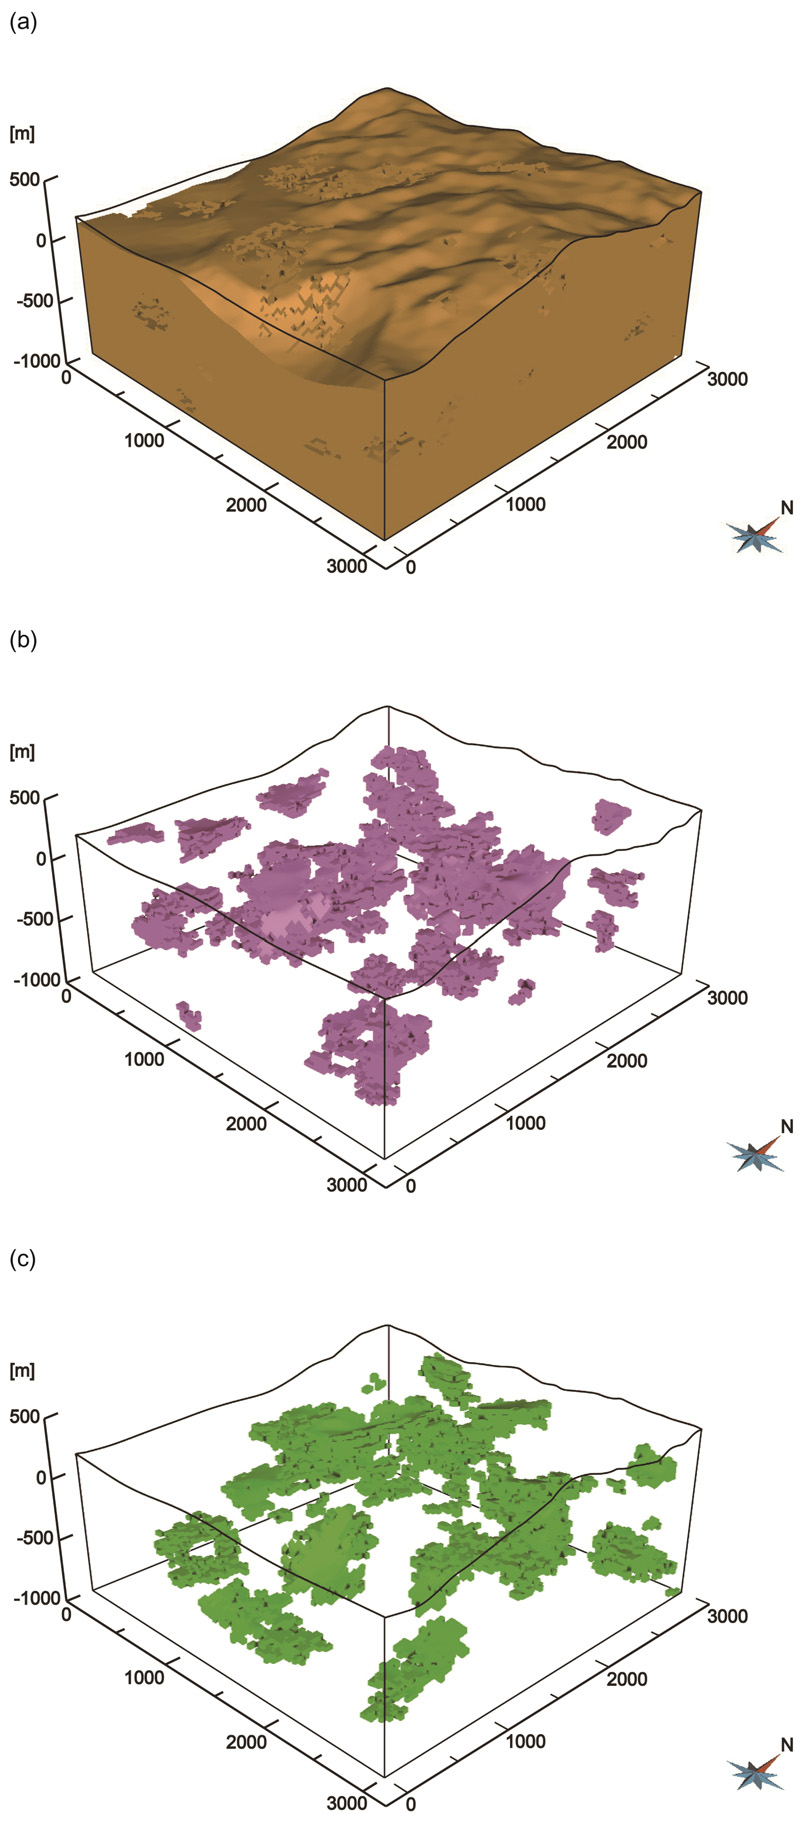
Three-dimensional lithofacies model of the Schistose Granitic Gneiss (SGG) with (a) mafic gneiss (MGN), (b) granitic gneiss (GGN), and (c) banded gneiss (BGN) in the study area using sequential indicator simulation (SIS) with the 1st realization.
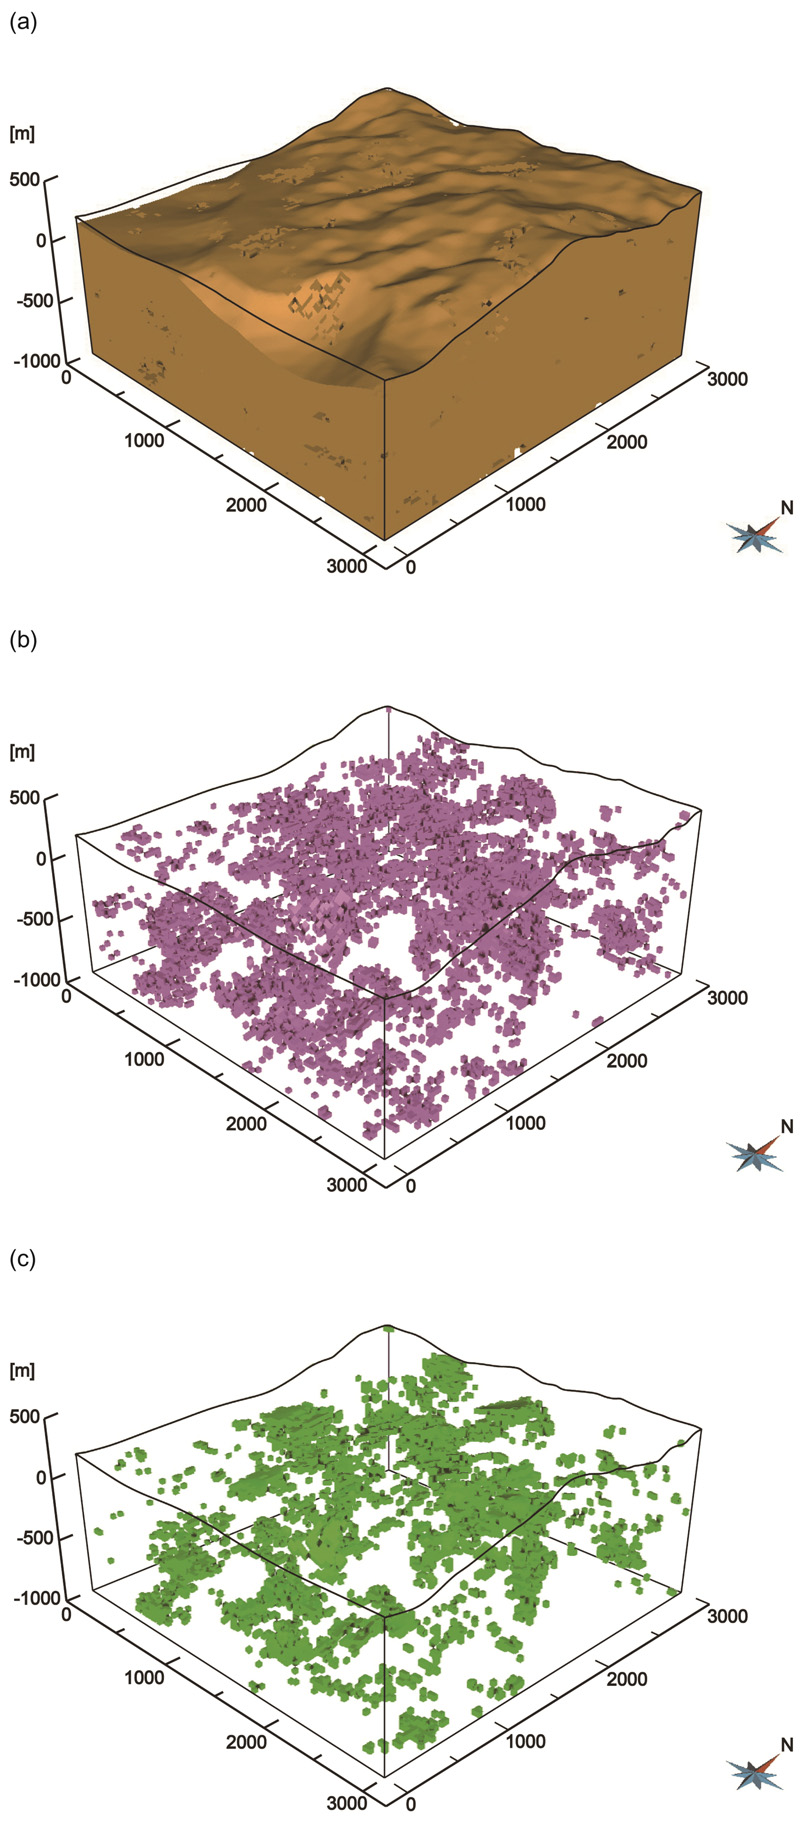
Three-dimensional lithofacies model of the Schistose Granitic Gneiss (SGG) with (a) mafic gneiss (MGN), (b) granitic gneiss (GGN), and (c) banded gneiss (BGN) in the study area using truncated Gaussian simulation (TGS) with the 1st realization.
Acknowledgments
본 연구는 산업통상자원부 산하 한국에너지기술평가원의 방사성폐기물관리기술개발사업 연구비 지원에 의해 수행되었습니다. 본 연구는 또한 부분적으로 미래창조과학부 산하 한국연구재단의 Brain Korea 21 사업 지원에 의해 수행되었습니다. 아울러 본 논문의 심사 과정에서 발전적인 조언과 비판을 해주신 강성승 교수님과 김중휘 교수님께 깊은 감사를 드립니다.
References
-
Alabert, F., (1987), The practice of fast conditional simulations through the LU decomposition of the covariance matrix, Mathematical Geology, 19, p369-386.
[https://doi.org/10.1007/BF00897191]

- Cressie, N.A.C., (1993), Statistics for Spatial Data, revised edition, John Wiley and Sons, New York, USA, p900.
-
de Almeida, J.A., (2010), Stochastic simulation methods for characterization of lithoclasses in carbonate reservoirs, Earth-Science Reviews, 101, p250-270.
[https://doi.org/10.1016/j.earscirev.2010.05.002]

-
Guyonnet-Benaize, C., Lamarche, J., Masse, J.P., Villeneuve, M., and Viseur, S., (2010), 3D structural modelling of small-deformations in poly-phase fault pattern: Application to the Mid-Cretaceous Durance uplift, Provence (SE France), Journal of Geodynamics, 50, p81-93.
[https://doi.org/10.1016/j.jog.2010.03.003]

- Gwak, S.H., and Lee, D.S., (2001), 3-D visualization of reservoir characteristics through GOCAD, Geophysics and Geophysical Exploration, 4, p80-83, (in Korean with English abstract).
-
Jeong, J., and Jang, W.I., (2011), Estimation of distribution of the weak soil layer for using geostatistics, Journal of the Korean Society of Marine Engineering, 35, p1132-1140, (in Korean with English abstract).
[https://doi.org/10.5916/jkosme.2011.35.8.1132]

- Journel, A.G., and Huijbregts, Ch.J., (1978), Mining Geostatistics, Academic Press, London, UK, p600.
-
Kaufmann, O., and Martin, T., (2008), 3D geological modelling from boreholes, cross-sections and geological maps, application over former natural gas storages in coal mines, Computers and Geosciences, 34, p278-290, (reprinted in 2009, 35, 70-82).
[https://doi.org/10.1016/j.cageo.2007.09.005]

- Kim, D.H., Ryu, D.W., Lee, J.H., Choi, I.G., Kim, J.K., and Lee, W.J., (2010), Comparative studies of kriging methods for estimation of geo-layer distribution of Songdo International City in Incheon, Journal of the Korean Geotechnical Society, 26, p57-64, (in Korean with English abstract).
- Kim., N.J., Kang, P.C., and Lee, H.K., (1970), Explanatory text of the geological map of Jungpyeong Dong sheet, Scale 1:50,000, Technical Report Sheet-6923-I, Geological Survey of Korea (GSK), Seoul, Korea, p35, 1 map sheet, (in Korean and English).
- Kim, S., and Park, H.D., (2009), Development of software for mineral resource estimation and 3D modeling using variogram, Journal of the Korean Society of Mineral and Energy Resources Engineers, 46, p151-159, (in Korean with English abstract).
- Koo, C.M., Hong, C.W., and Jeon, S.W., (2006), Estimation of rock mass rating (RMR) and assessment of its uncertainty using conditional simulations. Tunnel and Underground Space, Journal of the Korean Society for Rock Mechanics, 16, p135-145, (in Korean with English abstract).
- Koo, C.M., and Jeon, S.W., (2005), Using conditional simulation to estimate rock mass properties and assess the uncertainty, Proceedings of the Korean Society for Rock Mechanics Spring Conference, Seoul, Korea, March 31, p81-95, (in Korean).
- Korea Institute of Geoscience and Mineral Resources, (2013), Drilling log and core data of Boreholes BH-1, BH-2, and BH-3, Unpublished Data Korea Institute of Geoscience and Mineral Resources (KIGAM), Daejeon, Korea, 153 sheets, 303 photos, (in Korean and English).
-
Mallet, J.L., (1989), Discrete smooth interpolation, Association for Computing Machinery (ACM) Transactions on Graphics (TOG), 8, p121-144.
[https://doi.org/10.1145/62054.62057]

-
Matheron, G., Beucher, H., de Fouquet, C., Galli, A., Guerillot, D., and Ravenne, C., (1987), Conditional simulation of the geometry of fluvio-deltaic reservoirs, Proceedings of the Sixty-Second Society of Petroleum Engineers (SPE) Annual Technical Conference and Exhibition, Dallas, Texas, USA, September 27-30, p591-599.
[https://doi.org/10.2118/16753-MS]

- National Geographic Information Institute, (2013), Digital topographic map of Namseon sheet, Scale 1:25,000, Sheet 368083, National Geographic Information Institute (NGII), Suwon, Korea, p1 sheet, (DXF file).
- Paradigm, (2012), GOCAD user guide. Manual, Paradigm, Houston, Texas, USA, pvarious pages.
- Vilain, D., (2010), 3D modelling and restoration of the Vargfors Basin, Certral Skellefte District, Northern Sweden, using gOcad and MOVE software, M.S. Thesis, Lulea University of Technology, Lulea, Sweden, p19.
-
Wang, G., and Huang, L., (2012), 3D geological modeling for mineral resource assessment of the Tongshan Cu deposit, Heilongjiang Province, China, Geoscience Frontiers, 3, p483-491.
[https://doi.org/10.1016/j.gsf.2011.12.012]

-
Zanchi, A., Francesca, S., Stefano, Z., Simone, S., and Graziano, G., (2009), 3D reconstruction of complex geological bodies: Examples from the Alps, Computers and Geosciences, 35, p49-69.
[https://doi.org/10.1016/j.cageo.2007.09.003]


