심층학습과 템플릿 매칭을 이용한 신속하고 자동화된 지진 분석 체계: 2022년 10월 29일 규모 4.1 괴산 지진 사례 연구

초록
심층학습(deep learning)을 이용한 다양한 지진 분석 기술의 개발에 따라 숙련된 분석자의 개입은 최소화시키면서 기초적인 지진분석 과정들을 심층학습 기술로 대체시키는 사례들이 보고되고 있다. 또한 GPU (Graphic Processing Unit)를 활용한 템플릿 매칭(template matching)으로 기존에 알려진 것보다 더 작은 규모의 지진을 효과적으로 탐지할 수 있게 되었다. 본 연구에서는 2022년 10월 29일 오전 8시 27분 49초경 충북 괴산에서 발생한 규모 4.1 지진과 이 지진의 전진, 여진을 심층학습과 템플릿 매칭 기술을 활용해 자동화된 방식으로 분석하였다. 2022년 10월 21일부터 10월 31일까지 11일 동안 진앙거리 50 km 이내에서 운영된 상시 지진관측소 지진자료를 심층학습 기술을 이용해 초기 지진 목록을 작성하였다. 기상청에서 발표한 25개의 지진을 포함하여 총 50개의 지진이 10월 29일 오전부터 발생한 것을 확인하였다. 이 중에서 규모 4.1의 본진을 포함해 10개 지진의 발진기구를 자동으로 결정하였는데, 모두 주향이동단층의 발진기구로 해석되었다. 탐지된 지진을 견본 지진파형으로 삼아 수행한 템플릿 매칭을 통해, 2022년 10월 29일부터 수일 동안 약 500여 회 이상의 지진이 진원 근처에서 발생한 것으로 파악되었다. 11일 동안의 지진자료를 이용한 초기 지진 목록 작성에 약 70분, 템플릿 매칭은 약 10여분의 짧은 시간에 미소지진 탐지를 마칠 수 있었다. 이 지역의 지진활동을 탐색하기 위해 동일한 견본 파형을 이용해 2020년 3월부터 2022년 10월 20일까지의 자료로 템플릿 매칭을 수행하였는데, 2020년 5월부터 약 4회 이상의 동일한 지진 파형을 가지는 미소지진 활동이 있었음을 알 수 있었다. 따라서 심층학습과 템플릿 매칭을 이용한 자동 지진 분석 체계를 통해 지진 발생 초기에 지진에 관한 중요한 정보를 신속히 전달할 수 있음을 확인할 수 있었다.
Abstract
As various seismological tasks with deep learning have been implemented, it has been reported that fundamental seismic analysis processes were replaced with deep learning techniques while minimizing the intervention of skilled analysts. In addition, the template matching method using the GPU (Graphic Processing Unit) architecture has enabled effective detection of smaller earthquakes than previously known. In this study, we analyzed a magnitude 4.1 earthquake that occurred in Goesan-gun, South Korea, around 8:27:49 on October 29, 2022, and foreshocks and aftershocks of this earthquake in an automated way using deep learning and template matching techniques. Using deep learning techniques, seismograms from permanent seismic stations within 50 km of the epicenter were used to create an initial earthquake catalog for 11 days from October 21 to October 31, 2022. It was found that a total of 50 events, including 25 events published by the Korea Meteorological Administration, occurred from the morning of October 29th. The focal mechanisms of 10 events, including the mainshock of magnitude 4.1, were automatically determined, and all of them were characterized by a strike-slip faulting mechanism. By cross-correlating waveforms of template events, it was identified that more than 500 micro-earthquakes near the hypocenter occurred for few days from October 29, 2022. These tasks took only about 70 minutes to generate an initial earthquake catalog of 11-day seismograms and about 10 minutes for template matching. To investigate seismic activity in this region, template matching with the same templates was carried out with data from March 18, 2020 to October 20, 2022. The result shows that more than four micro-earthquakes have occurred since May 2020. Therefore, this study suggests that the automatic seismic analysis procedure using deep learning and template matching can quickly deliver important information about earthquakes in the early stages.
Keywords:
deep learning, template matching, automatic seismic analysis, magnitude, Goesan earthquake키워드:
심층학습, 템플릿 매칭, 자동 지진 분석, 괴산 지진1. 서 론
지진을 신속하고 정확하게 분석하는 것은 지진활동의 시공간적 특성을 파악하여 지진재해 경감을 위한 가장 기초적인 자료를 제공할 수 있다는 측면에서 중요한 의미를 갖는다. 이러한 필요에 의해, 신속하게 지진 자료를 처리하여 정확한 지진 정보를 제공하기 위한 자동화된 지진 감시 및 분석 시스템에 관한 연구개발은 오랫동안 이루어져 왔다(Olivieri & Clinton, 2012). 하지만 더 많은 지진을 신속하고 정확하게 탐지하고 분석할 수 있는 자동화된 기술의 개발은 여전히 요구되고 있다(Walter et al., 2021; Liao et al., 2022; Zhu et al., 2023).
심층학습은 인공지능 또는 기계학습 기술의 한 종류로 여러 계층의 신경망으로 연결된 심층 신경망을 방대한 양의 자료로 학습시켜 컴퓨터가 스스로 문제를 해결할 수 있도록 하는 기술이다. 심층 신경망은 다수의 매개변수로 구성된 신경망을 학습시키기 위해 빅 데이터라 불리는 방대한 양의 학습 자료가 필요하다. 그런데 한 지진관측소에서 매초 수백 개의 지진동 정보를 생산하며, 관측소의 개수는 꾸준히 증가해 왔기 때문에 지진학은 자료가 풍부한(data-rich) 학문 분야로 분류할 수 있다. 또한 숙련된 분석자들이 자료를 분석하고 그 결과를 축적해 왔기 때문에 인공지능의 학습에 필요한 라벨도 풍부한(label-rich) 분야이다(Mousavi and Beroza, 2022).
인공지능 기술이 주목받으면서 최근 지진학 분야에서도 기존에 확보한 풍부한 자료들을 활용한 다양한 연구개발이 이루어지고 있다. 특히 지진파 위상 발췌 기술 분야에서 많은 심층학습 기술이 개발되어 좋은 성능을 보여주고 있으며(Perol et al., 2018; Ross et al., 2018b; Zhu and Beroza, 2019; Mousavi et al., 2020; Kim et al., 2022), 지진의 식별(Linville et al., 2019; Titos et al., 2020; Seo et al., 2022), 초동 극성 식별(Ross et al., 2018a; Hara et al., 2019; Tian et al., 2020; Uchide, 2020, Byun et al., 2022) 등을 비롯해 지진파 위상 조합(Ross et al., 2019; McBrearly et al., 2019)과 관련된 기본적인 지진 분석 과정을 심층학습 기술로 대체하려는 연구가 활발히 진행되고 있다. 또한 각기 개발된 심층학습 기반의 지진 분석 단계들을 하나의 지진 분석 체계로 병합하여, 일련의 자동화된 지진 감시 및 분석 체계를 통해 기존의 지진 목록을 증강시킬 수 있게 되었다(Walter et al., 2021; Hong et al., 2022; Liao et al., 2022; Zhu et al., 2023).
확인된 지진 파형과의 반복적인 상호상관을 통해 유사한 파형을 탐지하여 지진을 식별하는 템플릿 매칭(template matching)은 조구조적 원인에 의해 발생하는 미소지진을 비롯해 섭입대에서 발생하는 슬로우 슬립 지진(slow slip events)과 관련한 저주파수의 미동(tremor)의 탐지에도 효과적인 것으로 알려져 있다(Gibbons and Ringdal, 2006; Shelly et al., 2007). 이러한 장점으로 인해, 국내에서도 2010년 규모 3.1 시흥 지진의 분석에 적용하기 시작하여 2017년 규모 5.4 포항 지진, 2021년 규모 4.9 마라도 해역 지진의 분석과 같은 중규모 지진과 순천 연속지진의 분석과 같은 미소지진의 분석에서도 활발히 사용되고 있다(Kim and Kim, 2014; Woo et al., 2019; Kim and Sheen, 2022; Kwak et al., 2022).
본 연구에서는 2022년 10월 29일 오전 8시 27분 49초경에 발생한 규모 4.1 충북 괴산지진과 이 지진의 전진, 여진을 심층학습 기술을 활용해 자동화된 방식으로 분석하여, 분석자의 주관적 개입 없이 초기 지진 목록을 완성할 수 있었다. 또한 더 많은 지진을 탐지하기 위해, 2020년 3월부터 2022년 10월까지의 지진 자료에 최댓값 필터 템플릿 매칭(Kim and Sheen, 2022)을 적용하여 다수의 전진, 여진을 발견하였다.
2. 지진 개요 및 지진 자료
기상청에 따르면 한국시간 2022년 10월 29일 오전부터 충북 괴산군 북동쪽 11 km 지역에서 규모 3.5 지진을 시작으로 규모 4.1 지진을 비롯한 규모 2.0 이상의 지진이 수 십 초 ~ 수 분 간격으로 연속하여 발생하였다. 이 지역에서는 10월 28일 23시경(이하 UTC)부터 11월 1일 0시경까지 미소지진을 포함해 총 25개의 지진이 발생한 것으로 보고되었다(NECIS, 2022).
본 연구에서는 자동화된 지진 분석 체계를 활용하여 괴산지진의 지진 발생 특성을 파악하기 위해 진앙 주변 50 km 이내 설치된 15개의 기상청 상시 지진관측소에서 2022년 10월 21일부터 2022년 10월 31일까지 관측한 자료를 수집하였다(그림 1). 또한 괴산 지진의 전진 활동이 오래 전부터 있었는지 확인하기 위해, 진앙에서 가장 가까운 CHJ3 (충주) 관측소의 관측 개시일(2020년 3월 18일)부터 2022년 10월 20일까지 CHJ3, CGAA, DKSA 관측소의 지진자료를 더 수집하였다.

Location of the Goesan epicenter and seismic stations. A start denotes the epicenter of the earthquake. Triangles indicate seismic stations and those with thick lines were used for template matching.
3. 자동 지진 분석
본 연구에서는 자동화된 지진분석 체계를 심층학습 기술을 이용한 초기 지진 목록을 만드는 과정과 GPU를 활용한 템플릿 매칭에 의한 미소지진의 탐색을 통해 지진 목록을 증강시키는 과정으로 구분하였다. 아래에서 설명하는 지진분석은 768 GB의 메모리(RAM)와 AMD 2.30 GHz 24코어 중앙처리장치(CPU) 2개, 40 GB의 메모리를 가진 1개의 NVIDIA A100 GPU 환경에서 수행되었다.
3.1 초기 지진 목록의 생성
지진 자료 처리의 가장 첫 단계는 지진파 위상을 발췌하는 것으로, 짧은 시간창과 긴 시간창 길이의 진폭비(Allen, 1982), 첨도(Saragiotis, et al., 2002; Baillard et al., 2014), 왜도 (Nippress et al., 2010; Ross and Ben-Zion, 2014), 필터링(Lomax et al., 2012) 등 다양한 방식의 규칙에 기반한 기술들이 오랫동안 개발되어왔다. 하지만 이와 같은 전통적인 방식은 신호대 잡음비가 낮은 자료의 위상 발췌가 어렵고, 순간적인 잡음에 취약하며 발췌된 지진파 위상이 P파 또는 S파 위상인지 구분하지 못하는 한계를 가지고 있다(Zhu and Beroza, 2019; Mousavi et al., 2020; Liao et al., 2021).
최근 활발히 연구개발이 이루어지고 있는 심층학습 기반의 다양한 지진파 위상 발췌 기술은 전통적인 위상 발췌 기술의 한계를 극복하고 있으며, 숙련된 분석가보다 위상발췌 오차가 적고 일관된 특징을 보여 정확한 진원 결정과 같은 분야에 효율적으로 활용할 수 있다(Liao et al., 2021). 본 연구에서는 전 세계 지진자료로 구성된 STEAD (Mousavi et al., 2019)와 이탈리아 지역의 국지지진 자료로 구성된 INSTANCE (Michelini et al., 2021)를 이용해 심층 신경망을 학습시킨 뒤, 국내 지진자료를 활용하여 심층 신경망의 미세조정을 통해 성능을 향상시킨 Kim et al. (2022)의 위상 발췌 기술을 사용하였다.
심층학습 기술이 다양한 분야에서 두각을 보여주기도 하지만, 사람이 파악할 수 없는 미세한 변화에 취약할 수도 있는 문제를 보여주기도 한다(Szegedy et al., 2013). 심층학습 기반 위상 발췌 기술도 이와 비슷한 문제를 가지는 것이 확인되었다(Heck et al., 2022). 전통적인 방식의 위상발췌 기술은 지진 파형의 매 샘플마다 정해진 규칙에 따라 연산을 수행하여 지진파 위상의 존재 여부를 결정하기 때문에 재귀적인 연산 과정이 안정되는 데 필요한 시간에 포함된 파형이 아니면 항상 동일한 시점에서 위상을 발췌한다. 심층학습 기술은 일정한 길이로 잘린 지진 파형의 각 샘플에서 P파나 S파의 확률을 예측하여 임계값보다 확률이 높으면 위상을 발췌하는 원리에 기반을 둔다. 그런데 잘린 파형에서 발췌하려는 지진파 위상이 어떤 위치에 나타나는가에 따라 예측 확률이 달라지기도 한다. 이를 개선하기 위해 Heck et al. (2022)은 연속 지진 파형을 위상 예측에 사용하는 시간창의 길이보다 짧은 간격으로 중첩하여 잘라내어, 한 시점의 위상 예측을 여러 번 수행하도록 하였다. 그리고 동일한 위상에 대해 여러 번 예측한 위상 예측 확률 중에서 최대값이 확률의 임계값보다 크면 위상을 발췌하는 방법을 제안하였다. 본 연구에서는 Hong et al. (2022)에서 제안한 방법을 따라, 5초 간격으로 30초 길이의 자료로 위상을 예측하고 예측 확률의 중앙값으로 괴산 지진의 지진파 위상을 발췌하였다.
2022년 10월 21일부터 2022년 10월 31일까지 15개 지진관측소에서 관측한 지진자료에서 P파와 S파의 위상을 발췌하는 데 소요된 시간은 약 59분이었으며, 이 중에서 필터링과 같은 기초적인 자료처리에 39분, 심층학습 기술을 이용한 예측에는 20분 정도 소요되었다.
발췌한 지진파 위상들은 GaMMA (Zhu et al., 2022)를 사용하여 조합(association)하였으며, 최소 4개의 P파가 하나의 지진에 의한 것으로 판단될 때 지진이 발생한 것으로 판단하였다. 2022년 10월 21일부터 2022년 10월 31일까지 발췌된 위상들로부터 위상조합하는 과정에는 약 6초 정도 소요되었고 57개의 지진이 식별되었다. 이 중에서 7개의 지진은 다른 지역에서 발생한 지진이 탐지된 것으로, 2022년 10월 28일부터 31일까지 50개의 지진이 진앙 지역에서 발생한 것을 확인하였다.
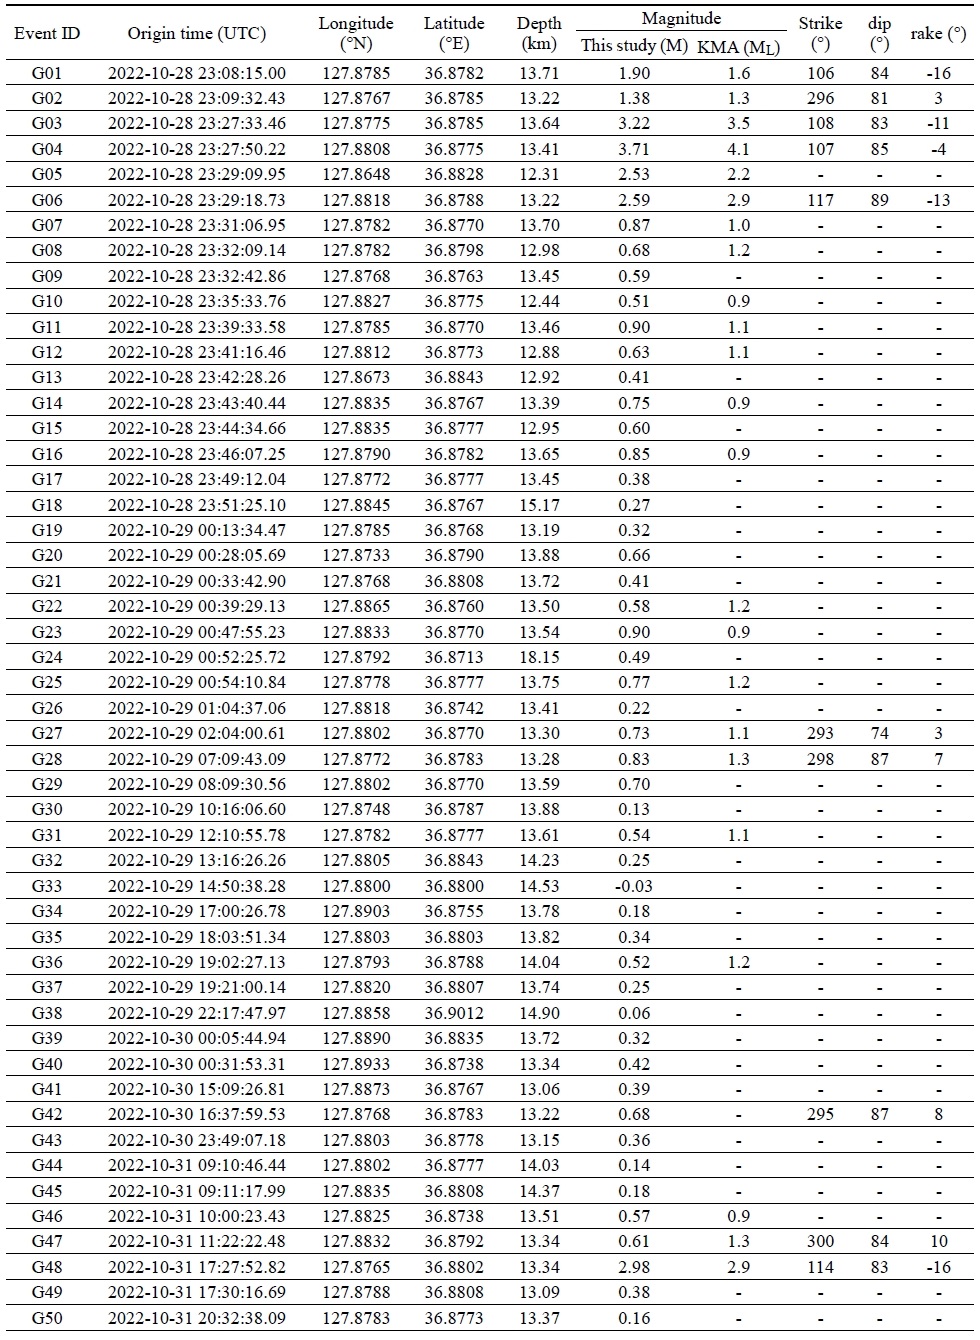
초기 지진 목록에 포함될 지진의 진원 위치 결정에는 HYPOINVERSE (Klein, 2002)를 사용하였으며, Kim et al. (2011)의 평균적인 한반도 1차원 속도모델을 기반으로 진원을 결정하였다(표 1; 그림 2). 그림에서 확인할 수 있는 것처럼 대부분의 지진이 좁은 지역에서 집중적으로 발생한 것을 확인할 수 있다.

Initial earthquake catalogue obtained from this study.

Distribution of epicenters. Pink starts indicate the epicenters from the Korea Meteorological Administration. Gray diamonds and colored circles represent the result of the association and the location, respectively. Crosses in the circle denote the spatial error of the location.
괴산 지진의 진원 근처에서 2022년 10월 21일부터는 지진 활동이 없다가 2022년 10월 28일 23시쯤부터 갑자기 지진 활동이 시작하여 약 50개의 지진이 발생한 것으로 분석되었고, 진앙 근처가 아닌 다른 지역에서 발생한 7개의 지진이 추가로 탐지된 것을 확인할 수 있었다. 위상 발췌 오차 또는 위상 조합의 오류로 인해 지진을 잘못 탐지한 경우는 없었으며, 기상청에서 발표한 지진은 모두 탐지하였다.
본 연구에서는 근거리에서만 관측할 수 있는 미소지진의 규모를 안정적으로 측정할 수 있도록 Hong et al. (2022)에서 제안한 가속도 규모식을 사용하였으며, 파형의 진폭 측정을 위해 지진 자료를 다시 읽어야 하므로 규모 결정에 4분 정도의 시간이 추가로 소요되었다. 그림 3은 기상청 규모와 본 연구에서 측정한 규모의 상관관계를 보여주는 데, 기상청 지진 규모가 작은 규모의 지진을 다소 과대 평가하는 것으로 해석한 Kwak et al. (2022)의 결과와 비슷한 양상을 보여주고 있다.

Comparison of the magnitude of events listed in Table 1. Solid line indicates magnitude identity.
식별된 지진의 발진기구 결정을 자동화하기 위해 심층학습 기반 P파 초동 식별 기술(Byun et al., 2022)를 활용하였다. 이 심층학습 기술은 Southern California Earthquake Data Center (SCEDC)에서 수집한 250만개의 P파 초동 극성 자료를 활용해 기저 심층 신경망을 학습시키고, 약 3만개의 국내 지진자료로 신경망의 미세조정을 통해 초동 극성 식별 성능을 향상시킨 것이다. 진원 결정에 사용된 P파의 초동을 심층학습 기술로 식별하고, P파와 S파의 진폭을 측정하여 S/P 진폭비를 계산하여 HASH (Hardebeck and Shearer, 2002)으로 지진의 발진기구를 결정하였다. 이때 P파 초동 극성의 개수가 8 이상인 지진의 발진기구만 결정하였으며, 규모 4.1 본진을 비롯한 모두 10개 지진의 발진기구를 1분 이내에 결정할 수 있었다. 본진을 비롯해 발진기구가 결정된 모든 지진은 주향이동단층의 특성을 보여주었으며, 본진을 비롯해 모든 전진과 여진이 기상청에서 파형 역산을 통해 얻은 본진의 단층면해와 서로 매우 유사한 것을 확인할 수 있다(그림 4).

Focal mechanisms of the Goesan earthquakes. Beachball diagrams for the mainshock from (a) the Korea Meteorological Administration and (b) this study. (c) Kaverina diagram (Kaverina et al., 1996) for 10 focal solutions obtained from this study (Table 1).
3.2 지진 목록의 증강
템플릿 매칭은 알려진 지진의 파형을 견본으로 삼아, 동일한 기작의 반복되어 발생하는 지진을 탐지하는 방법이다(Gibbons and Ringdal, 2006). 견본 파형과 탐지 대상인 목적 파형과의 상호상관계수를 측정하여 임계값을 넘어선 신호를 새로운 지진으로 판단하는 원리를 가진다. 본 연구에서는 진앙에서 가장 가까운 세 관측소(CHJ3, CGAA, DKSA)에서 관측한 19개의 지진 파형을 견본 파형으로 삼았으며, CHJ3 (충주) 관측소의 관측 개시일(2020 3월 18일)부터 세 관측소의 자료를 수집하였다.
그런데 여러 관측소의 파형으로 지진을 탐지할 때, 탐지하려는 진원의 위치가 조금씩 다르면 각 지진관측소까지의 주시에 변화가 생겨 새로운 지진을 찾는데 어려움이 발생할 수 있다(Zhang and Wen, 2015). 이를 개선하기 위해, 진원 주변을 여러 격자점으로 구분하고 각 격자점을 진원으로 가정했을 때의 주시차이를 고려하여 견본 파형의 시차를 조정하여 상호상관계수를 측정하는 Match-and-Locate (Zhang and Wen, 2015)가 개발되기도 하였다. 본 연구에서는 많은 컴퓨터 자원을 필요로 하는 Match-and-Locate를 대신하여 최댓값 필터 템플릿 매칭(Kim and Sheen, 2022)을 지진 목록을 증강시키는 데 활용하였다. 탐지된 지진의 규모는 견본 지진 파형과의 진폭비를 이용해 상대적인 규모를 결정하였다(Peng and Zhao, 2009; Kim and Sheen, 2022).
2020년 3월 18일부터 2022년 10월 31일까지 상호상관계수가 0.435 이상인 1332개의 신호를 탐지하였는데, 육안 확인을 통해 총 500개의 신호가 견본 파형과 유사한 지진으로 판단되었다. 기상청에서 발표한 최초의 지진인 2022년 10월 28일 23시 8분 경(한국시간 10월 28일 오전 8시 8분) 발생한 지진(표 1)을 기점으로, 총 496개의 지진이 약 24시간 동안 집중적으로 발생했음을 알 수 있었다(그림 5). 또한 주간에 비해 야간에 탐지된 지진의 규모가 더 작은 것을 통해 인간의 활동에 의한 배경잡음이 지진 탐지에 영향을 미친 것을 확인할 수 있었다. 2022년 10월 28일 이전에는 4개의 지진을 탐지했으며, 2020년 5월 3일부터 간헐적으로 발견되었다. 그림 6에서 확인할 수 있듯이, 최근에 발생한 지진과 매우 유사한 파형이 기록된 것을 통해, 이 지역에서 꾸준히 지진활동이 있었던 것으로 판단된다. 2020년 3월 18일부터 2022년 10월 31일까지 약 2년 9개월 동안 세 관측소에 기록된 자료를 이용한 템플릿 매칭에는 약 21시간 정도 소요되었으며, 11일 동안의 자료는 10여분 만에 연산이 종료되었다.

Temporal distribution of the Goesan earthquakes detected by template matching.

Template matching result for a foreshock occurred in May 3, 2020. Red dashed lines are waveforms of a template event occurred in October 29, 2022. Channel name and cross-correlation coefficients of each trace are given on the left- and right-hand sides of each trace, respectively.
4. 토의 및 결론
이 연구에서는 자동화된 지진 분석 기법을 활용하여, 2022년 10월 29일 오전(한국시간)에 발생한 규모 4.1 괴산 지진의 전진과 여진을 분석하였다. 특히 심층학습을 이용한 지진파 위상 발췌를 통해 본진이 발생한 이후 약 70시간 동안 이 지역에서 50여 번의 지진이 서북서-동남동 방향으로 분포하며 발생했던 것을 확인하였다(그림 2). 그림 4에서 확인된 본진의 단층면해와 비교했을 때, 괴산 지진은 서북서-동남동 방향의 좌수향 주향이동 단층에 의해 발생한 것으로 해석된다.
이를 확인하기 위해, 표 1에 제시된 지진 목록 중에서 규모 0.5 이상인 28개 지진을 대상으로 HypoDD (Waldhauser and Ellsworth, 2000)를 사용해 상대적인 진원 위치를 결정하였다. 이때 P파와 S파의 도달시간은 심층학습 기술을 활용해 발췌한 결과를 그대로 사용하였으며, 이를 기반으로 지진 파형을 상호상관하여 특잇값 분해(Singular Value Decomposition, SVD)법을 사용하여 역산하였다. 28개 지진 중에서 1개의 지진은 오차가 커서 역산 과정에서 제외되어, 27개의 지진만 그림 7과 같은 분포를 보이는 것으로 추정되었다. 그림 2에서 확인했던 것처럼, 본진의 단층면해 중에서 서북서-동남동 방향의 주향을 따라 좌수향 주향이동 단층에 의해 지진이 발생한 것으로 해석된다. 주향 방향에 수직인 방향의 단면(B-B’)에서는 지진의 진원이 다소 분산되어 나타는데, 자동화된 지진 분석 과정에서 발생하는 오차인지 여부는 향후 육안 식별에 기반한 정밀 분석을 통해 확인할 필요가 있을 것이다.

Double-difference relocations of 27 earthquakes. Error bars behind circles denote spatial errors in relocation. Black lines were obtained from the principal component analysis of the relocated distribution. Strike and dip of the mainshock focal mechanism were presented by gray lines.
본 연구에서는 심층학습과 템플릿 매칭을 이용한 2022년 10월 29일 괴산 지진의 자동화된 분석을 통해 지진 활동 특성을 신속하고 정확하게 파악할 수 있음을 확인할 수 있었다. 특히 지진 자료의 분석에 소요된 시간보다 자료의 수집에 더 많은 시간이 소요되는 문제점이 해결된다면 향후 다수의 여진을 동반한 중규모 이상의 지진 활동을 파악하는데 크게 기여할 수 있을 것으로 기대한다. 또한 이와 같은 지진 분석 기술은 좁은 지역에 밀집된 지진 관측망의 자료를 처리하는데 매우 효과적일 것으로 판단된다.
Acknowledgments
이 연구는 기상지진 See-At 기술개발연구(KMI2021-01111, KMI2022-01010)의 지원으로 수행되었습니다.
References
-
Allen, R., 1982, Automatic phase pickers: Their present use and future prospects. Bulletin of the Seismological Society of America, 72, S225-S242.
[https://doi.org/10.1785/BSSA07206B0225]

-
Baillard, C., Crawford, W.C., Ballu, V., Hibert, C. and Mangeney, A., 2014, An automatic kurtosis-based P- and S-phase picker designed for local seismic networks. Bulletin of the Seismological Society of America, 104, 394-409.
[https://doi.org/10.1785/0120120347]
- Byun, A.-H., Kim, B. and Sheen, D.-H., 2022, Determination of focal mechanism of local earthquakes in the Korean Peninsula using deep learning based P-wave first-motion polarity determination. 2022 Joint Fall Meeting of Korean Geological Societies (Abstracts), Changwon, October 25-28, 176 p (in Korean).
-
Kaverina, A.N., Lander, A.V. and Prozorov, A.G., 1996, Global creepex distribution and its relation to earthquake-source geometry and tectonic origin. Geophysical Journal International, 125, 249-265.
[https://doi.org/10.1111/j.1365-246X.1996.tb06549.x]
- Kim, B. and Sheen, D.-H., 2022, Analysis of seismicity of the 2020 Haenam earthquake sequence using maximum filter template matching. 2022 Joint Fall Meeting of Korean Geological Societies (Abstracts), Changwon, October 25-28, 169 p (in Korean).
- Kim, S., Hong, Y. and Sheen, D.-H., 2022, Development of deep learning phase picker using local earthquake data in the southern Korean Peninsula, 2022 Joint Fall Meeting of Korean Geological Societies (Abstracts), Changwon, October 25-28, 171 p (in Korean).
-
Kim, W.-Y. and Kim, K.-H., 2014, The 9 February 2010 Siheung, Korea, Earthquake Sequence: Repeating Earthquakes in a Stable Continental Region. Bulletin of the Seismological Society of America, 104, 551-559.
[https://doi.org/10.1785/0120130119]
-
Kim, W.-Y., Park, J.Y., Seo, M.-S., Son, Y.O., Lim, H., Han, S. and Kim, Y.H., 2022, The 14 December 2021 Mw 4.9 Offshore Jeju Island, Korea, Earthquake: Seismological Observation of an Intraplate Earthquake Provides Insight into Regional Seismotectonics. The Seismic Record, 2, 107-117.
[https://doi.org/10.1785/0320220012]
-
Klein, F.W., 2002, Userʼs Guide to HYPOINVERSE-2000, a Fortran Program to Solve for Earthquake Locations and Magnitudes. 4/2002 version, USGS, Open File Report 02-171, 123 p.
[https://doi.org/10.3133/ofr02171]
-
Kwak, D., Kim, S., Sheen, D.-H. and Kim, S., 2022, Seismological characteristics of microearthquake sequence near Suncheon, South Korea, from 2009 to 2020. Geosciences Journal, 26, 609-620.
[https://doi.org/10.1007/s12303-022-0010-5]
-
Gibbons, S.J. and Ringdal, F., 2006, The detection of low magnitude seismic events using array-based waveform correlation. Geophysical Journal International, 165, 149-166.
[https://doi.org/10.1111/j.1365-246X.2006.02865.x]
-
Hara, S., Fukahata, Y. and Iio, Y., 2019, P-wave first-motion polarity determination of waveform data in western Japan using deep learning. Earth, Planets and Space, 71, 1-11.
[https://doi.org/10.1186/s40623-019-1111-x]
-
Hardebeck, J.L. and Shearer, P.M., 2002, A new method for determining first-motion focal mechanisms. Bulletin of the Seismological Society of America, 92, 2264-2276.
[https://doi.org/10.1785/0120010200]
-
Heck, S.L., Young, C.J. and Brogan, R., 2022, Comparing traditional and deep learning signal features for event detection in the Utah region. Bulletin of the Seismological Society of America, 112, 2344-2363.
[https://doi.org/10.1785/0120210275]
- Hong, Y., Kim, S. and Sheen, D.-H, 2022, Optimizing deep learning based earthquake analysis procedures using the 2020 Haenam, Korea, earthquake sequence. 2022 Joint Fall Meeting of Korean Geological Societies (Abstracts), Changwon, October 25-28, 172 p (in Korean).
-
Liao, W.-Y., Lee, E.-J., Mu, D. and Chen, P., 2022, Toward fully autonomous seismic networks: backprojecting deep learning-based phase time functions for earthquake monitoring on continuous recordings. Seismological Research Letters, 93, 1880-1894.
[https://doi.org/10.1785/0220210274]
-
Liao, W.-Y., Lee, E.-J., Mu, D., Chen, P. and Rau, R.-J., 2021, ARRU phase picker: Attention Recurrent-Residual U-Net for picking seismic P- and S-phase arrivals. Seismological Research Letters, 92, 2410-2428.
[https://doi.org/10.1785/0220200382]
-
Linville, L., Pankow, K. and Draelos, T., 2019, Deep learning models augment analyst decisions for event discrimination. Geophysical Research Letters, 46, 3643-3651.
[https://doi.org/10.1029/2018GL081119]
-
Lomax, A., Satriano, C. and Vassallo, M., 2012, Automatic picker developments and optimization: FilterPicker—A robust, broadband picker for real-time seismic monitoring and earthquake early warning. Seismological Research Letter, 83, 531-540.
[https://doi.org/10.1785/gssrl.83.3.531]
-
McBrearty, I.W., Gomberg, J., Delorey, A.A. and Johnson, P.A., 2019, Earthquake arrival association with backprojection and graph theory. Bulletin of the Seismological Society of America, 109, 2510-2531.
[https://doi.org/10.1785/0120190081]
-
Michelini, A., Cianetti, S., Gaviano, S., Giunchi, C., Jozinovi, D. and Lauciani, V., 2021, INSTANCE - the Italian seismic dataset for machine learning. Earth System Science Data, 13, 5509-5544.
[https://doi.org/10.5194/essd-13-5509-2021]
-
Mousavi, S.M. and Beroza, G.C., 2022, Deep-learning seismology. Science, 377, eabm4470.
[https://doi.org/10.1126/science.abm4470]
-
Mousavi, S.M., Ellsworth, W.L., Zhu, W., Chuang, L.Y. and Beroza, G.C., 2020, Earthquake transformer-an attentive deep-learning model for simultaneous earthquake detection and phase picking. Nature Communications, 11, 1-12.
[https://doi.org/10.1038/s41467-020-17591-w]
-
Mousavi, S.M., Sheng, Y., Zhu, W. and Beroza, G.C., 2019, STanford EArthquake Dataset (STEAD): A global data set of seismic signals for AI. IEEE Access, 7, 179464-179476.
[https://doi.org/10.1109/ACCESS.2019.2947848]
- NECIS, 2022, https://necis.kma.go.kr/necis-dbf/user/earthquake/selectEarthquakeList.do, (November 30, 2022) (in Korean).
-
Nippress, S.E.J., Rietbrock, A. and Heath, A.E, 2010, Optimized automatic pickers: Application to the ANCORP data set. Geophysical Journal International, 181, 911-925.
[https://doi.org/10.1111/j.1365-246X.2010.04531.x]
-
Olivieri, M. and Clinton, J., 2012, An Almost Fair Comparison Between Earthworm and SeisComp3. Seismological Research Letters, 83, 720-727.
[https://doi.org/10.1785/0220110111]
-
Peng, Z. and Zhao, P., 2009, Migration of early aftershocks following the 2004 Parkfield earthquake. Nature Geoscience, 2, 877-881.
[https://doi.org/10.1038/ngeo697]
-
Perol, T., Gharbi, M. and Denolle, M., 2018, Convolutional neural network for earthquake detection and location. Science Advances, 4, e1700578.
[https://doi.org/10.1126/sciadv.1700578]
-
Ross, Z.E. and Ben-Zion, Y., 2014, Automatic picking of direct P, S seismic phases and fault zone head waves. Geophysical Journal International, 199, 368-381.
[https://doi.org/10.1093/gji/ggu267]
-
Ross, Z.E., Meier, M.-A. and Hauksson, E., 2018a, P wave arrival picking and first-motion polarity determination with deep learning. Journal of Geophysical Research, 123, 5120-5129.
[https://doi.org/10.1029/2017JB015251]
-
Ross, Z.E., Meier, M.-A., Hauksson, E. and Heaton, T.H., 2018b, Generalized seismic phase detection with deep learning. Bulletin of the Seismological Society of America, 108, 2894-2901.
[https://doi.org/10.1785/0120180080]
-
Ross, Z.E., Yue, Y., Meier, M.-A., Hauksson, E. and Heaton, T.H., 2019, Phaselink: a deep learning approach to seismic phase association. Journal of Geophysical Research: Solid Earth, 124, 856-869.
[https://doi.org/10.1029/2018JB016674]
-
Saragiotis, C.D., Hadjileontiadis, L.J. and Panas, S.M., 2002, PAI-S/K: a robust automatic seismic P phase arrival identification scheme. IEEE Transactions on Geoscience and Remote Sensing, 40, 1395-1404.
[https://doi.org/10.1109/TGRS.2002.800438]
- Seo, K.J., Hong, Y. and Sheen, D.-H., 2022, Discrimination of natural and anthropogenic earthquakes in local distances with deep learning approach. 2022 Joint Fall Meeting of Korean Geological Societies (Abstracts), Changwon, October 25-28, 175 p (in Korean).
-
Shelly, D.R., Beroza, G.C. and Ide, S., 2007, Non-volcanic tremor and low-frequency earthquake swarms. Nature, 446, 305-307.
[https://doi.org/10.1038/nature05666]
- Szegedy, C., Zaremba, W., Sutskever, I., Bruna, J., Erhan, D., Goodfellow, I. and Fergus, R., 2013, Intriguing properties of neural networks. https://doi.org/10.48550/arXiv.1312.6199.
-
Tian, X., Zhang, W., Zhang, X., Zhang, J., Zhang, Q., Wang, X. and Guo, Q., 2020, Comparison of single-trace and multiple-trace polarity determination for surface microseismic data using deep learning. Seismological Research Letters, 91, 1794-1803.
[https://doi.org/10.1785/0220190353]
-
Titos, M., Bueno, A., Garcia, L., Benitez, C. and Segura, J.C., 2020, Classification of Isolated Volcano-Seismic Events Based on Inductive Transfer Learning. IEEE Geoscience and Remote Sensing Letters, 17, 869-873.
[https://doi.org/10.1109/LGRS.2019.2931063]
-
Uchide, T., 2020, Focal mechanisms of small earthquakes beneath the Japanese islands based on first-motion polarities picked using deep learning. Geophysical Journal International, 223, 1658-1671.
[https://doi.org/10.1093/gji/ggaa401]
-
Waldhauser, F. and Ellsworth, W.L., 2000, A double-difference earthquake location algorithm: method and application to the northern Hayward fault, California. Bulletin of the Seismological Society of America, 90, 1353-1368.
[https://doi.org/10.1785/0120000006]
-
Walter, J.I., Ogwari, P., Thiel, A., Ferrer, F. and Woelfel, I., 2021, easyQuake: Putting Machine Learning to Work for Your Regional Seismic Network or Local Earthquake Study. Seismological Research Letters, 92, 555-563.
[https://doi.org/10.1785/0220200226]
-
Woo, J.-U., Kim, M., Sheen, D.-H., Kang, T.-S., Rhie, J., Grogoli, F., Ellsworth, W.L. and Giardini, D., 2019. An in-depth seismological analysis revealing a causal link between the 2017 Mw 5.5 Pohang Earthquake and EGS project. Journal of Geophysical Research: Solid Earth, 124, 13060-13078.
[https://doi.org/10.1029/2019JB018368]
-
Zhang, M. and Wen, L., 2015, An effective method for small event detection: match and locate (M&L). Geophysical Journal International, 200, 1523-1537.
[https://doi.org/10.1093/gji/ggu466]
-
Zhu, W. and Beroza, G.C., 2019, PhaseNet: A deep-neural-network-based seismic arrival-time picking method. Geophysical Journal International, 216, 261-273.
[https://doi.org/10.1093/gji/ggy423]
-
Zhu, W., Hou, A.B., Yang, R., Datta, A., Mousavi, S.M., Ellsworth, W.L. and Beroza, G.C., 2023, QuakeFlow: a scalable machine-learning-based earthquake monitoring workflow with cloud computing. Geophysical Journal International, 232, 684-693.
[https://doi.org/10.1093/gji/ggac355]
-
Zhu, W., McBrearty, I.W., Mousavi, S.M., Ellsworth, W.L. and Beroza, G.C., 2022, Earthquake phase association using a Bayesian Gaussian Mixture Model. Journal of Geophysical Research, 127, e2021JB023249.
[https://doi.org/10.1029/2021JB023249]