한반도 내륙 및 해역 발생 지진의 파형 유사성 기반 연구기법 적용과 제한점: 신호 탐지, 진원 재결정, 파형 분류

초록
지진 연구를 위한 가장 기본적 정보 중 하나는 지진의 진원이며, 근접한 진원에서 유사한 발생기작을 가지는 두 지진은 공통의 관측소들에서 유사한 파형으로 기록된다. 파형상호상관계수는 파형의 유사성을 표현할 수 있는 지표 중 하나이며, 때문에 파형상호상관은 전진-본진-여진, 반복지진, 군발지진, 화산성/비화산성 진동, 발파와 핵실험 등의 탐지와 진원 결정 과정에서 활용되고 있다. 국내에서는 2010년 오대산지진과 시흥지진, 2013년 백령도 해역 지진과 보령 해역 지진, 2016년 경주지진을 거치며 파형상호상관을 이용한 기법들이 지진 탐지와 진원 결정에 적용되어 왔다. 탬플릿매칭법은 파형상호상관계수를 기준치로 이용하여 유사한 파형을 탐지하고, 이중차법은 파형상호상관으로 획득한 지연시간을 관측주시차로 이용하여 지진의 상대적 진앙 혹은 진원 위치를 정밀히 결정한다. 몇 가지 이중차법 간 차이는 편미분치, 목적함수, 목적함수 최소화 기법의 차이로 설명하였다. 계층적 군집 분석은 파형 상호상관계수행렬을 이용하여 지진 파형의 계통을 분류하며, 군집 분석 결과는 국내 발생 지진의 진앙 혹은 진원 재결정 결과를 지지하는 보조적 수단으로 사용되고 있다. 그러나 파형상호상관계수는 파형의 길이와 필터링 대역에 따라 가변적이며, 파형상호상관 기반 기법들은 지진간 규모 혹은 거리 차이 증가에 따라 효용이 감소할 수 있음을 유의하여야 한다.
Abstract
Earthquakes with a similar rupture process and close proximity produce comparable waveforms at the same seismic station. Based on waveform similarity, we determined the location of the earthquakes, which is one of the fundamental pieces of information in seismological research. The waveform cross-correlation technique that evaluates waveform similarity has been applied to the analyses for foreshock-mainshock-aftershock sequences, repeating earthquakes, earthquake swarms, volcanic/non-volcanic tremors, blasting, and nuclear test events. We reviewed the various methods based on waveform cross-correlation and discussed their limitations, presenting studies on seismic events in and around the Korean Peninsula. The template matching method detects similar waveforms, employing a cross-correlation coefficient as a threshold. The double-difference earthquake relocation method uses travel-time differences measured by waveform cross-correlation, to determine precisely the relative locations of seismic events. The hierarchical cluster analysis with a dendrogram classifies waveforms according to the maximum cross-correlation coefficient matrix, and the classification outcomes can support the relocation results. Additionally, we described variations in the double-difference relocation methods, as the differences in the partial derivatives, objective functions, and their minimization methods. Lastly, we addressed the limitations of the methods based on waveform cross-correlation, which results from changes in the cross-correlation coefficients between the event pairs.
Keywords:
earthquake, waveform cross-correlation, double-difference method, template matching method, hierarchical clustering analysis키워드:
지진, 파형상호상관, 이중차법, 템플릿매칭법, 계층적 군집 분석1. 서 론
지진 연구를 위한 가장 기본적 정보 중 하나는 지진의 진원이며, 근접한 진원에서 유사한 발생기작을 가지는 두 지진은 공통의 관측소들에서 유사한 파형으로 기록된다 (Geller and Mueller, 1980; Poupinet et al., 1984; Ito, 1985; Dodge et al., 1995). 파형의 유사성은 상호상관계수(cross-correlation coefficient; CC)로 표현될 수 있으므로, 파형 상호상관(waveform cross-correlation)은 전진-본진-여진, 반복지진(repeating earthquake), 군발지진(earthquake swarm), 화산성/비화산성 진동(volcanic/non-volcanic tremor), 발파와 핵실험 등의 탐지와 진앙 혹은 진원의 정밀 재결정, 그리고 이들 지진의 파형 분류에 활용되고 있다(Harris, 1991; Shearer, 1997; Waldhauser and Ellsworth, 2000; DeShon et al., 2003; Hauksson and Shearer, 2005; Shelly et al., 2007; Schaff, 2008; Shelly and Hill, 2011; Gibbons and Ringdal, 2012; Huang and Beroza, 2015; Kim, W.-Y. et al., 2017; Rubinstein et al., 2018; Yoon et al., 2019; Zhang et al., 2022).
한반도 내륙 및 근해에서 발생한 지진의 진앙 분포는 그림 1에서 볼 수 있다. 한국지질자원연구원(Korea Institute of Geoscience and Mineral Resources; KIGAM)에서 1998년 9월 30일부터 2022년 7월 31일까지 발생 확인한 지진이며, 광산 혹은 채석장 등지에서 수행한 발파에 의하여 생성된 것으로 추정되는 지진이 상당히 포함되어 있다. 우리는 이 논평에서 파형 상호상관계수를 이용한 한반도 내륙 및 근해 발생 지진 분석 사례(그림 1의 A부터 M)와 적용 기술의 제한점을 논한다. 먼저, 파형 상호상관계수를 기준치로 하여 템플릿(template; 틀, 견본) 파형과 유사한 파형의 신호를 탐지하는 템플릿매칭법(template matching method)을 설명하고, 군집지진의 파형상호상관(waveform cross-correlation)으로 획득할 수 있는 지연시간(time-lag)을 주시차로 활용하여 지진들의 진앙 혹은 진원을 재결정하는 이중차법(double-difference method)을 설명한다. 그리고 지진 파형 사이의 비유사성 혹은 덴드로그램(dendrogram; 계통수)의 가지(branch) 길이를 파형 상호상관계수에 대한 1의 보수로부터 설정하는 파형의 계층적 군집분석(hierarchical cluster analysis)을 설명하면서, 파형 상호상관 기법의 제약점을 논한다.

Map with contour lines that indicate the number of seismic events in and around the Korean Peninsula, cataloged by the Korea Institute of Geoscience and Mineral Resources, from September 30, 1998, to July 31, 2022. A contour interval is 20. The grid counting the number of events is 0.1°. The geological fault traces are from the study conducted by Kee et al. (2020).
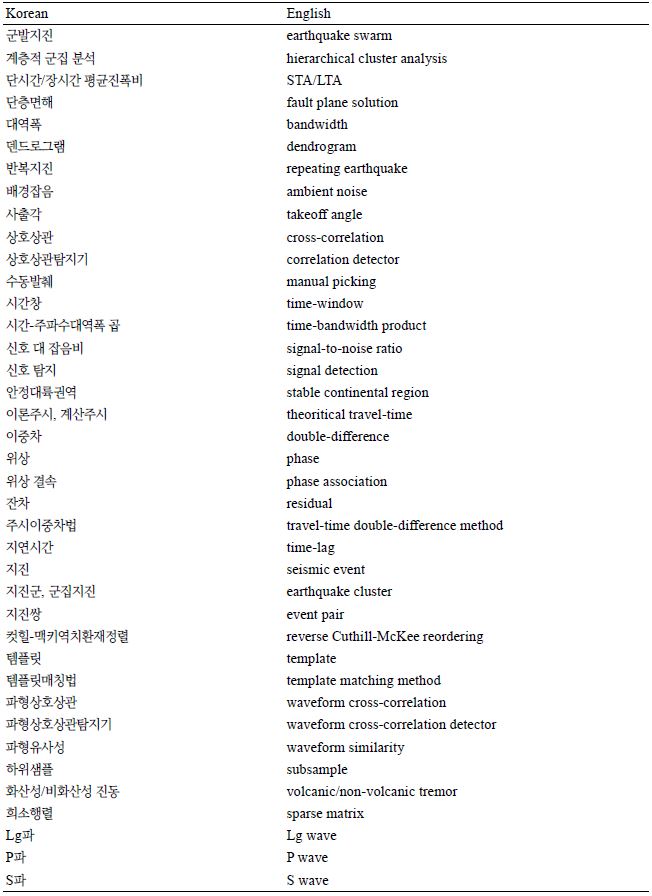
본 논평에서 “지진”은 혼돈이 일어나지 않는 한 포괄적으로 지진, 폭발, 산사태 등 지진동을 일으키거나, 지진파를 발생하는 것들 모두를 지칭한다. 사용한 외국어 용어들은 뒤의 부록에 일람하였다.
2. 신호 탐지와 템플릿매칭법
지진파형자료에서 신호 탐지(signal detection) 또는 지진탐지에는 단시간/장시간 평균진폭비(Short-Time Average/Long-Time Average; STA/LTA)를 이용하여 지진을 탐지하는 방법이 널리 사용되고 있다. 단시간 평균진폭은 순간적인 신호(지진파)의 진폭을 측정하고, 장시간 평균진폭은 그때의 배경잡음(ambient noise)의 평균진폭을 측정한다. 이 두 값의 비가 신호 탐지에 활용 된다. 이 방법은 실시간으로 지진파를 기록하는 경우에 지진 관측소나 관측망에서 지진탐지에 광범위하게 사용되고 있고, 여진탐지목적의 임시 관측망을 구축 운용하는 경우에도 유용하게 쓰인다. 임시 관측망에서 여진 탐지에는 흔히 단시간 평균진폭 창을 0.5초, 장시간 평균진폭 창을 30초, 그리고 그 비율을 3.5 정도로 잡아 탐지 기준으로 삼는다(자료가 초당 100 샘플인 경우). 물론 각 관측소의 배경잡음 정도, 초당 샘플링 비율 등을 감안하여 위의 값들을 조정하여 사용한다. 연구 목적으로도 많은 양의 자료에서 지진을 탐지하는데 쓰며, 뒤에 논의하는 정합필터 방법을 적용할 때 초기에 필요한 템플릿 지진의 신호를 찾을 때에도 유용하다.
파형상호상관탐지기(waveform cross-correlation detector), 상호상관탐지기(correlation detector), 혹은 정합필터알고리즘(matched filtering algorithm)라고도 불리는 템플릿매칭법은, 그림 2a와 같이 템플릿으로 삼은 파형을 연속파형과 상호상관하여(그림 2b), 분석자가 설정한 상호상관계수 기준치 이상의 파형을 탐지(그림 2c)하는 기법이다. 0.8과 같이 비교적 큰 상호상관계수를 기준으로 설정할 경우 그림 2d와 같이 매우 유사한 파형의 지진군이 탐지될 수 있다. 지진기록의 3성분을 동시에 탐지에 사용하는 경우에는 거짓탐지의 양을 줄일 수 있다. 이 방법은 단시간/장시간 평균진폭비를 이용하여 신호 탐지를 수행할 때보다 규모가 약 1.0 더 적은 지진들을 탐지할 수 있으며, 따라서 배경잡음이 높은 경우에도 규모가 작은 지진들을 탐지하는데 탁월한 성능을 보일 수 있다(Schaff, 2008).

Seismic event detection using waveform cross-correlation, in Hyodong-ri, Gyeongju, the east of the Ulsan Fault: (a) cross-correlation between a template and continuous data; (b) cross-correlation results with three peaks corresponding to a high (>0.8) cross-correlation coefficient; (c) three detected events in continuous data; (d) waveforms of the 66 newly detected events and 14 cataloged; (e) occurrence histogram for the newly detected and cataloged.
Kim and Kim (2014)는 템플릿매칭법을 이용하여 경기도 시흥 지역에서 약 5년 반 동안 유사한 파형의 지진 16 건을 탐지하였고, 이 지진활동을 안정대륙권역(stable continental region)에서 보고되는 반복지진(Schaff and Richards, 2004a)이라 해석하였다. Son et al. (2015)은 2013년 백령도 해역 지진의 전진-본진-여진 목록 전체를 템플릿으로 사용하여 전진과 여진 29건을 탐지하였다. Park et al. (2016)은 2013년 거창지진의 여진 54건을 한 관측소 3성분에 대한 템플릿매칭을 수행하여 탐지하였다. Han et al. (2017)은 경주 동편에서 2010년부터 2014년부터 발생한 미소지진을 템플릿매칭법으로 탐지하고, 그 진원 분포가 지표 단층과 유관하다고 제시하였다. 이후, 한반도 내륙과 근해 수십 km 범위 내 영역의 수 년에 걸친 지진활동 검색이 템플릿매칭법을 통하여 이루어졌다(Han et al., 2019; Hong et al., 2020; Son et al., 2021; Kim, W.-Y. et al., 2022; Kwak et al., 2022). 또한, 템플릿매칭법은 2010년 5월 북한 핵실험장에서 발생한 이벤트 탐지(Kim, W.-Y. et al., 2017)에도 활용되었다.
상호상관계수는 상호상관에 사용되는 시간창(time-window)의 위치와 길이, 또는 필터링 대역의 설정에 따라 달라질 수 있기에(Harris, 1991; Schaff and Waldhauser, 2005; Schaff, 2008; 그림 3), Harris (1991)는 시간창 길이와 주파수 필터링 대역폭(bandwidth)이 상호상관계수에 영향을 주는 점에 착안하여, 단일관측소 단일성분에 적용되는 템플릿매칭법에 대한 적절한 시간창 길이와 주파수대역폭의 곱(Time-Bandwidth Product; TBP; 시간-주파수대역폭 곱) 값을 100이라 제안하였다. 예를 들어, 시간창 길이 5초의 템플릿을 사용할 경우 20 Hz의 대역폭으로 필터링 된 자료가 적절 하다는 것이다. 시간창 길이와 주파수대역폭 곱이 작을 경우, 시간창의 길이가 짧거나 대역폭이 좁아지는데, 큰 시간-주파수대역폭 곱의 상호상관탐지기를 사용하는 경우보다 적은 정보를 사용하게 되므로 큰 시간-주파수대역폭 곱의 상호상관탐지기 보다 헐거운 상호상관탐지기가 된다. 따라서 작은 시간-주파수대역폭 곱의 상호상관탐지기는 큰 시간-주파수대역폭 곱의 상호상관탐지기 보다 높은 상호상관계수를 식별 기준치로 삼아야한다(see Figure 12 in Harris, 1991).

Changes in the maximum cross-correlation coefficient matrix according to the time-bandwidth product of (a) 5, (b) 10, (c) 25, and (d) 100. A frequency bandwidth varies from 1 to 20 Hz, with a time-window length of 5 s.
템플릿매칭법의 성능은 다수의 성분 혹은 다수의 관측소 기록파형에 대하여 템플릿매칭을 반복적으로 수행하여 개선될 수 있다(Gibbons and Ringdal, 2006; Shelly et al., 2007; Schaff, 2008; Peng and Zhao, 2009; Gibbons and Ringdal, 2012; Skoumal et al., 2014; Hong et al., 2020; Kwak et al., 2022). 다수의 관측소를 활용하여 다수의 신호를 탐지할 경우 지진 파형간 지연시간(혹은 주시차)이 그 과정에서 획득되므로, 템플릿매칭법은 위상 결속(pahse association) 단계를 거쳐, 지진 탐지와 진원 결정을 동시에 수행하는 기법들, Match-and-Locate (Zhang and Wen, 2015), Loc-Flow (Zhang et al., 2022) 등으로 발전되었다. Match-and-Locate (Zhang and Wen, 2015)는 전진과 여진, 반복지진, 유발지진, 그리고 실험실 규모의 미소지진 분석에 이용되고 있으며(Yao et al., 2017; Dodge, 2018; Sugan et al., 2019; Lei et al., 2022), GPU (Graphics Processing Unit)를 이용하여 대규모 상호상관 계산의 효율성을 높인 GPU-M&L (GPU-based Match and Locate; Liu et al., 2020), 기계학습에 기반하여 지진의 탐지와 위치결정을 수행하는 Loc-Flow (Zhang et al., 2022) 등에 적용되고 있다.
3. 이중차법을 이용한 군집지진의 정밀 위치 재결정
이 절(section)에서는 개개 지진의 절대적인 위치를 결정하는 것보다는 최근에 개발된 파형자료를 써서 군집지진의 상세한 상대위치를 결정하는 방법에 대하여 논의한다. 군집지진의 상세한 위치는 선형 지구조를 알아 내거나, 단층의 주향과 경사를 찾는데 결정적인 역할을 한다.
지진의 위치결정에는 일반적으로 두가지의 오류가 있다. 첫번째는 모델 오류이다. 측정된 위상 도착 시간을 해석하는 데 사용되는 주시모델의 오류이다. 지각이나 맨틀의 지진파속도 모델이 실제와 다르기 때문이다. 두번째는 지진파 위상의 도착 시간을 정확하게 측정하는 데 어려움이 있고 오차가 있기 때문이다. 특히 신호 대 잡음비(signal-to-noise ratio)가 낮은 경우 지진파의 도달 시간을 측정하는데 오차가 클 수밖에 없다. 더욱이 위상 오인(예: Pg와 Pn파)은 데이터 오류를 더 복잡하게 만든다.
1960년대 말부터, 한 지역에서 난 군집지진들을 JHD (joint hypocenter determination; Douglas, 1967; Pujol, 1988)방법 등을 이용하여 더 자세한 위치들을 재결정하였다. 2000년대에 와서는 이중차법을 (Waldhauser and Ellsworth, 2000) 많이 사용한다. 이중차법은 아래에 설명하는 식 1에서와 같이 아주 가까운 거리에 있는 두 지진의 진원들과 공통의 관측소사이의 전파경로가 동일하므로 그 경로들에서 측정한 P파 혹은 S파의 주시 차이만을 이용하여 두 지진의 상대적인 위치를 정확히 결정할 수 있다. 따라서 앞에 언급한 첫번째 모델오류를 줄일 수 있게 되며 이것이 이중차법의 가장 중요한 요소이다.
이중차란 관측 주시 tobs와 모델링 주시 tcal의 잔차(residual; r)들 간의 차이를 가리키며, 지진 i와 j의 관측소 k에서 이중차 는 식 1과 같이 표기된다(Waldhauser and Ellsworth, 2000).
| (1) |
식 1의 최후변은 선형 연립방정식의 상수벡터(constant vector)이며, 관측소 k에서 기록된 지진 i와 지진 j의 관측 주시차 와 계산된 주시차 로 이루어져 있다. 관측 주시차 는 분석자가 발췌한 주시 자료가 있다면 단순 뺄셈으로 구할 수 있다. Kim, W.-Y. et al. (2006) 등은 일차로, 지진위치결정에 사용한 자료들의 수동발췌(manual picking)된 관측주시의 차를 이용하여 이 지진들의 상대적위치를 재결정했다. 그러나 초기 수동발췌된 관측주시는 지진들의 크기(진폭), 전파한 거리, 잡음 및 분석자의 위상 식별 능력 등에 의해 주시차가 큰 오차를 가지게 되며, 상대적 위치결정 결과 또한 높은 정밀성을 얻는데 한계가 있다.
지진군(earthquake cluster)은 각 지진이 가장 가까운 이웃과 연결되는 지진연결망을 구축하여 연속적으로 지진들 간의 상대적인 위치를 연립방정식을 풀어서 결정하게 된다. 공통의 관측소에서 지진들을 한 쌍으로 연결할 수 있는 최적의 거리는 지진들의 수, 관측소와 지진들 사이의 거리, 분석하는 위상 등에 좌우되나, 분석하는 지진파의 파장(위상의 속도/주파수) 정도의 거리나, 파장의 ¼정도로 할 수 있다. 여기서 연결거리는 매우 중요하고, 정답이 없으므로 여러 경우들(예를 들어, 파장의 두배 정도부터 ¼정도까지 등)을 수행하여 최적의 거리를 찾는 것이 방법이다.
이중차법을 적용한 컴퓨터 코드 HypoDD는 Waldhauser가 2001년 일반에 공유하여 널리 쓰이는 코드이다. 이 코드는 2개로 구성되어 있고, 첫 번째 프로그램, PH2DT는 앞에 언급된 군집지진들을 지진쌍(event pair)들로 만들고 지진들을 연결할 수 있는 최적의 거리를 이용하여 지진들을 연속적으로 사슬로 연결하여 위치 재결정할 수 있도록 준비해주는 프로그램이다. 여기서 만들어진 지진들 간의 주시차를 이용하여 HypoDD 프로그램을 수행한다.
일찍이(1980년대 초; Poupinet et al., 1984, 등) 파형을 상호상관하여 주시차의 오차를 아주 적게 할 수 있음이 알려졌으나, 당시에는 지진기록이 대부분 아날로그 기록이기에 널리 활용되지 못하였으며, 1990년대 후반 관측자료들이 디지털 기록으로 진화한후에 광범위하게 쓰인다(Menke and Shearer, 2004; Hauksson and Shearer, 2005; Schaff and Waldhauser, 2005; Waldhauser and Schaff, 2008; Kim, W.-Y. et al., 2010; Shelly and Hill, 2011; Ma and Audet, 2014; Kim, K.-H. et al., 2018; Li et al., 2020). 우리는 파형 상호상관 방법을 적용하여 한 쌍의 지진에서 전파된 P파 와 S파의 주시 차이를 아주 정밀하게 측정할 수 있다. 2007년 1월 20일 오대산 지진의 한 쌍의 전진의 주시차이를 파형자료로 측정하는 예시를 그림 4에서 보여준다. 이렇게 앞에서 언급한 두번째 오류, 즉 데이터 오류를 최소화할 수 있으므로. 이중차법을 적용하여 아주 정밀한 상대적인 위치를 산정할 수 있다. 특히, 진원의 군집성이 높을 것으로 생각되는 지진들의 진원을 재결정할 때에는 약 1/1000초 정도의 정밀도가 요구될 수 있다. 초당 100 샘플 기록일 경우 하위샘플(subsample)에 해당하는 정밀도는 포물선을 상호상관 함수의 정점 주변 5개 지점에 맞춰 최대 상호상관계수를 얻을 때 달성될 수 있다(Dodge et al., 1995; Kim, W.-Y. et al., 2022).

Waveform cross-correlation of P- and S-wave from event pairs of Odaesan earthquake of January 20, 2007. (a) P arrivals from events 6 and 8 at CHC (Δ=67 km) are correlated to obtain a precise differential time of dt=0.080 s, with cross-correlation coefficient (CC)=0.97, (b) S arrivals at CHJ (Δ=102 km) from events 6 and 8 are correlated for precise differential travel time, dt=0.080 s with CC=0.79.
Schaff and Richards (2004b)는 일반적으로 안정된 대륙지각에서 진폭이 가장 큰 Lg파에 주목하여, Lg파 위상을 포함하는 시간창을 사용하여 상호상관하고, 이 때 획득한 Lg파의 주시차를 이용하여 수 백 km 이상 떨어져 발생한 지진의 상대적인 진앙을 정밀히 결정하였다. 이때 사용한 Lg파는 주파수 영역 0.5-5 Hz에서 가장 효과적이었고, 거리는 600 - 1,500 km, 시간창은 60 - 400초이었고, P파를 포함하기도 하며 Lg파 도달이후 약 40초 정도를 포함하는 넓은 범위를 사용하였다. 이 경우 앞선 신호 탐지 절에서 언급한 시간-주파수대역폭 곱이 매우 커서, 거의 반복지진만 탐지되는 까닭에 그런 지진들을 이용한 상대위치 재결정은 아주 정밀 할 수 있다. 한가지 유념할 것은 Lg파는 대륙지각과 같이 안정된 지역에서만 효과적으로 전파하며, 지각 두께가 35 km라고 가정하면, 진앙거리가 최소 약 150 km 정도 되어야 한다. 그리고 Lg파의 전파는 전세계적으로 평균 3.4 - 3.5 km/s의 속도로 전파한다(Kim, W.-Y., 1987). 그보다 거리가 짧은 영역에서 관찰되는 지진파는 속도가 3.5 km/s 정도라도 S파라고 부를 수 있다. Lg파는 진원에서 넓은 범위의 사출각(takeoff angle)을 가지는 S파가 지표면과 모호(Moho) 사이에서 여러 번의 전반사를 통해 전파하여 관측소에 도착하므로 복잡하다. 그러므로 Lg파를 이용하여 지진원의 깊이를 추출해 내기가 어렵다. 따라서 진원의 깊이 z를 Lg파로는 구할 수 없기에 이중차법에서 깊이를 제외하였다.
Lg파의 주시차를 지각에 갇혀 수평으로 전파한 위상의 주시차라고 가정하면, 이중차 식 1은 진원의 깊이 z에 대한 편미분치는 0이 되어 식 2와 같이, x, y, 와 진원시(τ)로만 표현된다.
| (2) |
그리고, 이 때 각 편미분치는 Lg파 속도 (V)를 상수로 가정하면, 식 3과 같이 매우 간단하게 표현된다(Schaff and Richards, 2004b).
| (3) |
여기서 D는 진앙거리(관측소와 지진 사이의 거리)이고, xs, ys는 관측소 위치이다. Son et al. (2015)는 공개된 HypoDD 코드(Waldhauser, 2001)의 편미분치를 식 3과 같이 수정한 후 이를 EpiDD라고 부르기로 하고, 2013년 백령도 해역과 보령 해역 연속지진에 적용하여 단층면해(fault plane solution)와 부합하는 진앙 위치를 얻을 수 있었다. 다만, EpiDD를 써서 구한 지진들의 재결정된 상대적인 진앙은 해석하는데 주의를 요한다. 지진쌍들을 형성할 때에 가능한 지진 사이의 거리는 너무 멀지 않은 대략 1 km 정도가 적합하다고 보고 되었다(Schaff and Richards, 2004b).
HypoDD는 국내 발생 지진에 대해서 2004년과 2006년 울진 해역 지진 분석에 처음으로 적용되었는데, 2004년 울진 해역 지진의 경우, 발생 지진의 개수가 적고 관측소 분포가 양호하지 않아 만족할 만한 결과를 얻을 수 없었고(Kim, W.-Y. et al., 2006), 2006년 지진의 경우는 상호상관으로 주시차를 구하지 않고, 분석자의 발췌 주시를 사용하였다(Kang and Shin, 2006). 이후 Kim, W.-Y. et al. (2010)과 Kim and Park (2010)은 2007년 오대산지진(Mw 4.6)의 전진-본진-여진을 이루는 20건 내외의 지진에 대하여 파형상호상관으로 획득한 주시차를 기반으로 진원을 HypoDD로 재결정하여 단층 기하를 성공적으로 추정할 수 있었다.
이후, Hong et al. (2015)는 2013년 백령도 해역과 보령 해역에서 발생한 지진의 진원 위치 재결정에 HypoDD를 이용하였고, Han et al. (2017)은 경주 동편에서 발생한 미소-소규모지진의 진원을 상호상관 주시차와 HypoDD로 재결정하여, 지표단층과 연결되는 선형의 진원 분포를 획득하였다. Son et al. (2018)은 2016년 경주지진(ML 5.8)의 전진-본진-여진을 상호상관 주시차와 HypoDD를 이용하여 재결정하여, 전진들과 여진들의 시간에 따른 발생영역 변화를 명확히 제시하였고(see Figure 7 in Son et al., 2018), 이 결과는 Uchide and Song (2018)이 제시한 단층파열모델의 근거가 되었다. 또한, Kim, K.-H. et al. (2018)과 Woo et al. (2019)은 상호상관 주시차와 HypoDD를 이용하여 지열발전 중 발생한 지진과 2017년 포항지진(Mw 5.5)의 진원을 재결정할 수 있었다.
그러나 HypoDD와 EpiDD가 파형 상호상관으로 획득한 지연시간을 관측 주시차로 이용하여 정밀성을 확보한다고 하더라도, 상호상관을 수행한 관측소, 그리고 상호상관 시간창 길이와 위치, 필터링 대역의 변화에 따라 진앙 혹은 진원 재결정 결과는 다소 달라질 수 있다(Schaff and Waldhauser, 2005). 또한, HypoDD와 EpiDD는 최소제곱오차(L2-norm; least square error)를 목적함수로 사용하므로 아웃라이어(outlier; 이상점)의 영향을 크게 받는다(Nelson and Vidale, 1990; Shearer, 1997; Deshon et al., 2003; Shearer, 2010; Chaves et al., 2017; Zhang et al., 2022). 따라서 공간적으로 분리된 다수의 지진군의 진앙 혹은 진원을 결정할 경우에 지진군을 미리 구분하지 않거나, 초기값, 즉 지진목록 상 진앙 혹은 진원의 신뢰도가 관측소 분포 등에 의한 이유로 높지 않을 경우에 불안정한 결과를 얻을 수 있다.
4. 파형 분류와 계층적 군집 분석
국내 발생 지진의 파형상호상관계수에 기반하여 파형유사성을 정량적으로 분류한 연구는 Kim, W.-Y. et al. (2010)의 2007년 오대산지진 연구가 있다. Kim, W.-Y. et al. (2010)은 일정 기준치 이하의 상호상관계수를 0으로 수정하여 상호상관계수행렬을 희소행렬(sparse matrix)로 만든 후 행렬의 모든 요소를 대각행렬과 가장 가까운 위치로 이동시키는 컷힐-맥키역치환재정렬(Reverse Cuthill-McKee Reordering)을 수행하였다. 이 과정을 통해 행렬의 대각성분 대역폭이 감소한 파형상호상관행렬에서는 대각성분 주변부에 위치하는 대역에서 지진 간 파형유사성과 지진군 간 파형유사성을 동시에 관찰할 수 있었고, 여기서 파악되는 지진군은 공간적으로 군집한 진원 분포를 보여주었다.
우리는 상호상관계수행렬의 대각성분 대역폭 형태로 짐작할 수 있는 유사파형지진군의 존재에 주목하였다. Lance and Williams (1967)는 그림 5a와 같은 상호상관계수행렬(cross-correlation coefficient matrix)로부터 시계열 신호의 비유사성 혹은‘거리’를 상호상관계수에 대한 1의 보수로 나타내어 신호 파형 간의 계층적 관계를 보여주는 다이어그램을 제안하였다. 그림 5a와 같은 상호상관계수행렬은 하나의 파형과 파형의 관계로부터 파형군과 파형군의 관계를 나타내도록 그림 5b와 같이 덴드로그램으로 나타날 수 있다. 이 때 파형군의 상호상관계수로는 상호상관계수의 평균 혹은 중앙값 등을 사용하며, 신호군의 상호상관계수 비교를 통해 파형 하나를 나타내는 가지를 하나의 다발로 묶어갈 수 있다. 이후 그림 5b의 0.8과 같이 가지를 자르는 기준치로 인하여 파형은 몇 개의 군으로 나뉘어지고, 분류된 군에 따라 상호상관계수행렬을 재배열하면 그림 5c와 같으며, 하나의 군 안에서 서로 높은 상호상관계수를 나타내는 지진군을 확인할 수 있다.

Example of hierarchical clustering of waveforms: (a) the maximum cross-correlation coefficient matrix; (b) dendrogram (hierarchical cluster tree) showing four clusters with the branch cut of 0.8; (c) the maximum cross-correlation coefficient matrix, computed from waveforms aligned after the clustering.
덴드로그램을 이용한 지진 파형의 계층적 군집 분석은 주로 화산과 지열저류층 주변 미소진동 분석에 적용되어 왔다(Aminzadeh and Chatterjee, 1984; Rowe et al., 2004; West, 2013; Thompson and Reyes, 2018; Park, I. et al., 2020). 국내 발생 지진에 대해서는 2013년 백령도와 보령 해역 연속지진 분석에 처음으로 적용되어(Son et al., 2015), 유사한 파형의 지진군이 공간적으로도 군집한 진앙을 가지는 것이 확인되었고, 이 결과는 진앙 재결정 결과를 방증하였다. 이후 덴드로그램을 이용한 계층적 군집 분석은 경주 지역 지진활동(Han et al., 2017), 2016년 경주 지진(Son et al., 2018)과 2017년 포항 지진(Woo et al., 2019; Son et al., 2020), 2020년 해남지진(Sheen, 2021), 2021년 제주도 지진(Kim, W.-Y. et al., 2022), 순천 지진활동 분석(Kwak et al., 2022) 등에 이중차법, 템플릿매칭법과 함께 활발히 적용되고 있으며, 유사파형지진의 시공간적 분포 형태는 결정된 진앙 혹은 진원을 지지하는 보조적 수단으로 활용되고 있다.
그러나 상호상관계수에 대한 1의 보수를 거리로 정의하여 작성하는 덴드로그램은, 상호상관계수가 상호상관을 수행하는 시간창의 길이와 위치, 그리고 필터의 대역에 따라 변할 수 있으므로, 상호상관계수의 변화에 따라 덴드로그램의 형태가 변화할 수 있다. 또한, 가지의 절단 길이 선택에 따라 묶인 다발의 개수, 즉 유사한 파형의 지진군 개수가 달라질 수 있는 것에 유의해야한다. Trugman and Shearer (2017)는 계층적 군집 분석 과정에서, 모든 지진쌍에 대하여 다수의 관측소에 대한 파형상호상관계수를 합한 값을 파형유사성으로 정의하여, 단일 관측소 파형상호상관계수 변화에 따른 군집 결과의 민감도를 감소시켰다. 하지만 상호상관계수 변화에 따른 덴드로그램의 근본적 한계점은 여전히 유효하다.
5. 토 의
2010년 후반, 계층적 군집 분석 결과로 지진군 쌍을 정의하여 이중차법을 수행하는 GrowClust (Trugman and Shearer, 2017)가 제안되었는데, GrowClust는 HypoDD 혹은 EpiDD와 같이 관측주시차를 입력값으로 받기에 기존 이중차법이 사용되던 대부분의 분야에 활발히 적용되고 있다(Chaves et al., 2017; Yue et al., 2017; Hatch et al., 2018; Rubinstein et al., 2018; Ross et al., 2020; Zhang et al., 2022). 국내 발생 지진에 대해서는 2020년 해남 연속지진 분석에 처음으로 적용되었다(Son et al., 2021). GrowClust의 특징을 살펴보면, 이중차법 간 차이를 편미분치, 목적함수, 목적함수 최소화 기법의 차이로 정리할 수 있다. GrowClust는 HypoDD 혹은 EpiDD와 달리, 두 지진 혹은 지진군에 대한 모든 관측소에서의 상호상관계수(혹은 사용자가 의도한 중요도)의 합을 지진 혹은 지진군 간 거리 요소로 사용하여 계층적 군집 분석을 수행한 후 두 지진 혹은 두 지진군 간의 주시이중차에 대한 L1-norm (최소절대편차)를 목적함수로 사용한다. L1-norm은 L2-norm 보다 아웃라이어의 영향을 덜 받으며(Nelson and Vidale, 1990; Shearer, 1997), GrowClust는 두 지진 혹은 두 지진군의 이중차 최소화에 격자검색을 수행하기 때문에 불안정할 수 있는 역행렬 계산을 수행하지 않는다. 이로 인하여 GrowClust는 넓은 영역에서 발생한 다수의 지진군 진원 재결정에서 기존 이중차법보다 유리할 수 있는 한편, 기존 이중차법 보다 초기 진원 정보에 의존적이라고 할 수 있다. 또한, GrowClust는 상호상관 결과를 일반적으로 신뢰할 수 있다고 여겨지는 반사파와 모호면 굴절파의 임계거리 이내 위치한 관측소의 주시차를 사용하는 것이 추천된다(Trugman, 2018). 임계거리를 벗어난 관측소를 사용해야할 경우에는, Lg파 상호상관 지연시간을 주시차로 이용하여 백에서 수 백 km 이상의 관측소 자료로 진앙위치를 재결정하는 이중차법(EpiDD)을 고려해볼 수 있다(Schaff and Richards, 2004a, 2004b; Son et al., 2015).
Li et al. (2020)은 현재까지 알려진 파형 기반(waveform-based) 진원 결정 방법에는 1) 이론주시(theoritical travel-time) 혹은 합성파형(synthetic wave-form) 등을 생성하기 위하여 사용하는 속도모델에 대한 의존; 2) 아직까지 초기 단계라 생각되는 불확실성 평가 기법; 3) 지진 발생기작의 복잡성 문제(challenges)가 존재한다고 하였다. Waldhauser and Ellsworth (2000)와 Trugman et al. (2017)은 HypoDD와 Growclust에서 잔차들 간의 차이를 최소화하는 목적함수를 사용하여 이론주시의 속도모델에 대한 의존성을 되도록 회피하고 있다. 중복을 허용한 리샘플링(bootstrap; 부트스트랩)은 이중차법의 오차범위 추정에 종종 이용되며(i.e., Waldhauser and Ellsworth, 2000; Waldhauser and Schaff, 2007), GrowClust는 공개된 코드에서 부트스트랩을 통한 오차범위 추정 절차를 제공하고 있다(Trugman, 2018). 부트스트랩은 주어진 관측주시차를 이용한 이중차법의 강건성(robustness)과 오차범위를 제시할 수 있다. 그러나 사용 관측소가 달라져 주어진 관측주시차가 달라지는 경우에는 오차범위가 크게 변화하는 경우가 있는데, 이는 관측주시차 혹은 사용 관측소가 모집단을 대표할 수 없다는 의미로, 여기서 모집단은 지표와 깊이를 포함한 모든 공간 좌표가 되며, 따라서 관측소의 확충은 지진 연구에서 근본적으로 요구되는 사항이다. 또한, 관측주시차는 상호상관에 사용되는 파형의 위상과 길이에 따라 달라질 수 있으며(see Figure 10b in Schaff and Waldhauser, 2005), Waldhauser and Schaff (2008)가 지적한 바와 같이, 지진의 규모가 증가할수록 지진 발생기작이 복잡성을 띠기 때문에 상호상관을 수행하는 두 지진의 규모나 거리의 차이가 클 경우 상호상관 기반 파형 분석의 효율성이 급격히 감소한다(see Figure 9 in Son et al., 2015). 따라서 우리는 거리에 따른 파형을 직접 제시하거나(see Figure 8 in Son et al., 2015), 획득한 단층면해와 재결정된 지진의 진앙 혹은 진원위치의 공간적 분포를 비교하고 있으며, 덴드로그램과 계층적 군집 분석으로 정의된 유사한 파형의 지진군이 공간적으로 군집함을 함께 제시하여 재결정 결과를 방증하고 있다(Son et al., 2015, 2018, 2020, 2021). 따라서 지표에서 관측된 다른 정보가 부족할 경우, 상술의 방법이나 Kim, W.-Y. et al. (2010)의 행렬 대각화 등이 재결정 결과를 지지할 보조적 수단으로 쓰일 수 있다.
6. 결 론
파형상호상관으로 획득한 지연시간을 주시차로 이용하는 이중차 기법의 국내 발생 지진 적용은 2004년 울진 해역 지진 분석이 첫 사례이며, 2010년 오대산 지진에 성공적으로 적용되어 지하 단층 기하를 암시하는 본진-여진의 진원 분포가 획득되었다. 2010년 오대산 지진의 분석에는 파형상호상관을 이용한 템플릿매칭법 또한 성공적으로 적용되어 보고되지 않았던 여진이 탐지되었다. 또한, 템플릿매칭은 2010년 시흥 지진 발생 이전 약 5년 간 발생한 지진을 탐지하였고, 국내 발생 지진을 안정대륙권역의 반복지진으로 해석할 단초를 제공하였다. 이후 이중차기법과 템플릿매칭법은 2013년 백령도 해역 지진에 동시에 적용되어 미확인 되었던 전진과 여진이 추가 탐지되었으며, 진원 분포가 획득되었다. 또한, 2013년 백령도 해역과 보령 해역 지진 분석에는 파형 상호상관계수를 이용한 덴드로그램과 계층적 군집 분석이 국내 발생 지진에 대하여 처음으로 적용되어, 유사한 파형의 지진군 군집성은 재결정된 진앙의 시공간적 분포를 지지하였다. 이후 덴드로그램과 계층적 군집 분석은 2016년 경주지진, 2017년 포항지진, 2020년 해남지진, 2021년 제주지진, 그리고 순천 지진활동 분석에 이중차법으로 결정된 진원 분포를 지지하는 수단으로 이용되고 있다.
대표적 이중차법인 HypoDD는 시간과 3차원 공간 정보에 대한 P와 S파 위상 주시의 편미분치를 사용하며, 최소제곱오차를 목적함수로 한다. EpiDD는 HypoDD와 같이 최소제곱오차를 목적함수로 하나, 시간과 2차원 공간 정보에 대한 Lg파 주시의 편미분치를 사용한다. GrowClust는 시간과 3차원 공간 정보에 대한 P와 S파 위상 주시의 최소절대편차를 목적함수로 하며, 격자검색을 이용한다. 목적함수의 차이로 인하여 GrowClust는 HypoDD 혹은 EpiDD에 비하여 아웃라이어의 영향을 덜 받고, 격자검색으로 인하여 역행렬 계산을 피해가는 등 계산 안정성을 확보할 수 있으나, 그렇기 때문에 초기 진원 정보에 더욱 의존적일 수 있다. 또한, 재결정 결과 해석 시 오차 범위는 입력자료로 수행된 결과의 강건성임을 유의하여야 한다. 마지막으로, 템플릿매칭법, 이중차법, 계층적 군집 분석과 같은 파형 상호상관 기반 결과는 계산에 이용되는 파형의 위상과 길이에 따라 달라질 수 있으며, 비교하는 두 지진의 규모나 거리의 차이가 클 경우 기법의 효용성은 급격히 감소함을 주지할 필요가 있다. 이 논평에서 토의한대로 한반도와 그 연안에서 발생하는 지진들의 관측 자료의 상세한 분석에 최근 발전된 파형 유사성에 근거한 방법들을 적용하여 보다 정량적인 연구를 수행할 수 있다고 사료되며, 그 사용을 적극 권장한다.
Acknowledgments
건설적인 조언을 주신 익명의 심사자께 마음 깊이 감사의 말씀을 전합니다. 이 연구는 한국지질자원연구원 기본사업 ‘지진활동 추적 및 관측자료 통합관리기술 개발’과 자체연구사업 ‘백령도와 보령 해역 지진의 진원 상대 위치 결정 및 지진활동 특성 분석’의 지원을 받아 수행되었습니다. 원고의 그림은 Generic Mapping Tools (Wessel et al., 2013), SAC (Helffrich et al., 2013), Matplotlib (Hunter, 2007), MATLAB (https://www.mathworks.com/products/matlab.html), 그리고 Inkscape (https://inkscape.org/)를 이용하여 작성하였습니다.
References
-
Aminzadeh, F. and Chatterjee, S., 1984, Applications of clustering in exploration seismology. Geoexploration, 23, 147 -159.
[https://doi.org/10.1016/0016-7142(84)90028-0]

-
Chaves, E.J., Duboeuf, L., Schwartz, S.Y., Lay, T. and Kintner, J., 2017, Aftershocks of the 2012 Mw 7.6 Nicoya, Costa Rica, earthquake and mechanics of the plate interface. Bulletin of the Seismological Society of America, 107, 1227-1239.
[https://doi.org/10.1785/0120160283]
-
DeShon, H.R., Schwartz, S.Y., Bilek, S.L., Dorman, L.M., Gonzalez, V., Protti, M., Flueh, E.R. and Dixon, T.H., 2003, Seismogenic zone structure of the southern Middle America Trench, Costa Rica. Journal of Geophysical Research: Solid Earth, 108, 2491.
[https://doi.org/10.1029/2002JB002294]
-
Dodge, D.A., 2018, Searching for induced seismicity at Punggye-ri nuclear test site using subspace detectors. Seismological Research Letters, 89, 2094-2112.
[https://doi.org/10.1785/0220180127]
-
Dodge, A.D., Beroza, G. and Ellsworth, W.L., 1995, Foreshock sequence of the 1992 Landers, California, earthquake and its implications for earthquake nucleation. Journal of Geophysical Research, 100, 9865-9880.
[https://doi.org/10.1029/95JB00871]
-
Douglas, A., 1967, Joint epicentre determination. Nature, 215, 47-48.
[https://doi.org/10.1038/215047a0]
-
Geller, R.J. and Mueller, C.S., 1980, Four similar earthquakes in central California. Geophysical Research Letters, 7, 821-824.
[https://doi.org/10.1029/GL007i010p00821]
-
Gibbons, S.J. and Ringdal, F., 2006, The detection of low magnitude seismic events using array-based waveform correlation. Geophysical Journal International, 165, 149-166.
[https://doi.org/10.1111/j.1365-246X.2006.02865.x]
-
Gibbons, S.J. and Ringdal, F., 2012, Seismic monitoring of the North Korea nuclear test site using a multichannel correlation detector. IEEE Transactions on Geoscience and Remote Sensing, 50, 1897-1909.
[https://doi.org/10.1109/TGRS.2011.2170429]
-
Han, M., Kim, H.-J., Kang, S.-Y., Kim, K.-H., Yoon, S.-H. and Kyung, J.B., 2019, Detection of microearthquakes and identification of their causative structures in the eastern offshore region of South Korea. Tectonophysics, 750, 36-44.
[https://doi.org/10.1016/j.tecto.2018.11.003]
-
Han, M., Kim, K.-H., Son, M. and Kang, S.-Y., 2017, Current microseismicity and generating faults in the Gyeongju area, southeastern Korea. Tectonophysics, 694, 414-423.
[https://doi.org/10.1016/j.tecto.2016.11.026]
-
Harris, D., 1991, A waveform correlation method for identifying quarry explosions. Bulletin of the Seismological Society of America, 81, 2395-2418.
[https://doi.org/10.1785/BSSA0810062395]
-
Hatch, R.L., Abercrombie, R.E., Ruhl, C.J. and Smith, K.D., 2018, Earthquake interaction, fault structure, and source properties of a small sequence in 2017 near Truckee, California. Bulletin of the Seismological Society of America, 108, 2580-2593.
[https://doi.org/10.1785/0120180089]
-
Hauksson, E. and Shearer, P., 2005, Southern California hypocenter relocation with waveform cross-correlation, Part 1: Results using the double-difference method. Bulletin of the Seismological Society of America, 95, 896-903.
[https://doi.org/10.1785/0120040167]
-
Helffrich, G., Wookey, J. and Bastow, I., 2013, The seismic analysis code: a primer and user’s guide (1st ed.). United Kingdom: Cambridge University Press.
[https://doi.org/10.1017/CBO9781139547260]
-
Hong, T.-K., Chung, D., Lee, J., Park, S., Kim, B. and Kim, W., 2021, Earthquake-spawning faults in the Seoul metropolitan area and their seismic implications. Earth and Space Science, 8, e2021EA001662.
[https://doi.org/10.1029/2021EA001662]
-
Hong, T.-K., Lee, J. and Houng, S.E., 2015, Long-term evolution of intraplate seismicity in stress shadows after a megathrust. Physics of the Earth and Planetary Interiors, 245, 59-70.
[https://doi.org/10.1016/j.pepi.2015.05.009]
-
Hong, T.-K., Park, S., Lee, J., Chung, D. and Kim, W., 2020, One-off deep crustal earthquake swarm in a stable intracontinental region of the southwestern Korean Peninsula. Physics of the Earth and Planetary Interiors, 308, 106582.
[https://doi.org/10.1016/j.pepi.2020.106582]
-
Huang, Y. and Beroza, G., 2015, Temporal variation in the magnitude-frequency distribution during the Guy-Greenbrier earthquake sequence. Geophyscial Research Letters, 42, 6639-6646.
[https://doi.org/10.1002/2015GL065170]
-
Hunter, J.D., 2007, Matpllotlib: a 2D graphics environment. Computing in Science and Engineering, 9, 90-95.
[https://doi.org/10.1109/MCSE.2007.55]
-
Ito, A., 1985, High resolution relative hypocenters of similar earthquakes by cross-spectral analysis method. Journal of Physics of the Earth, 33, 279-294.
[https://doi.org/10.4294/jpe1952.33.279]
-
Kang, T.-S. and Shin, J.S., 2006, The offshore Uljin, Korea, earthquake sequence of April 2006: seismogenesis in the western margin of the Ulleung Basin. Geosciences Journal, 10, 159-164.
[https://doi.org/10.1007/BF02910360]
- Kee, W.S., Kim, S.W., Hong, P.S., Lee, B.C., Cho, D.R., Byun, U.H., Ko, K., Kwon, C.W., Kim, H.C., Jang, Y., Song, K.Y., Koh, H.J. and Lee, H.J., 2020, 1:1,000,000 Geological map of Korea. Korea Institute of Geoscience and Mineral Resources, Daejeon. p. 1.
-
Kim, K.-H. and Park, Y., 2010, The 20 January 2007 ML 4.8 Odaesan earthquake and its implications for regional tectonics in Korea. Bullet of the Seismological Society of America, 100, 1395-1405.
[https://doi.org/10.1785/0120090234]
-
Kim, K.-H., Ree, J.-H., Kim, Y., Kim, S., Kang, S.Y. and Seo, W., 2018, Assessing whether the 2017 Mw 5.4 Pohang earthquake in South Korea was an induced event. Science, 360, 1007-1009.
[https://doi.org/10.1126/science.aat6081]
-
Kim, W.Y., 1987, Modeling short-period crustal phases at regional distances for the seismic source parameter inversion. Physics of the Earth and Planetary Interiors, 47, 159-178.
[https://doi.org/10.1016/0031-9201(87)90075-6]
-
Kim, W.-Y., Choi, H. and Noh, M., 2010, The 20 January 2007 Odaesan, Korea, earthquake sequence: reactivation of a buried strike-slip fault?. Bulletin of the Seismological Society of America, 100, 1120-1137.
[https://doi.org/10.1785/0120090069]
-
Kim, W.-Y. and Kim, K.-H., 2014, The 9 February 2010 Siheung, Korea, earthquake sequence: Repeating earthquakes in a stable continental Region. Bulletin of the Seismological Society of America, 104, 551-559.
[https://doi.org/10.1785/0120130119]
- Kim, W.-Y., Noh, M.-H. and Choi, H.-S., 2006, The 29 May 2004 offshore southeast coast of Korea earthquake sequence: shallow earthquakes in the Ulleung back-ar basin, East Sea (Sea of Japan). Journal of the Korean Geophysical Society, 9, 249-262.
-
Kim, W.-Y., Park, J.Y., Seo, M.-S., Son, Y.O., Lim, H., Han, S. and Kim, Y.H., 2022, The 14 December 2021 Mw 4.9 Offshore Jeju Island, Korea, Earthquake: Seismological Observation of an Intraplate Earthquake Provides Insight into Regional Seismotectonics. The Seismic Record, 2, 107-117.
[https://doi.org/10.1785/0320220012]
-
Kim, W.-Y., Richards, P.G., Scahff, D.P. and Koch, K., 2017, Evaluation of a Seismic Event, 12 May 2010, in North Korea. Bulletin of the Seismological Society of America, 107, 1-21.
[https://doi.org/10.1785/0120160111]
-
Kwak, D., Kim, S., Sheen, D.-H. and Kim, S., 2022, Seismological characteristics of microearthquake sequence near Suncheon, South Korea, from 2009 to 2020. Geosciences Journal, 26, 609-620.
[https://doi.org/10.1007/s12303-022-0010-5]
-
Lance, G.N. and Williams, W.T., 1967, A general theory of classificatory sorting strategies: 1. Hierarchical systems. The Computer Journal, 9, 373-380.
[https://doi.org/10.1093/comjnl/9.4.373]
-
Lei, X., Ohuchi, T., Kitamura, M., Li, X. and Li, Q., 2022. An effective method for laboratory acoustic emission detection and location using template matching. Journal of Rock Mechanics and Geotechnical Engineering, 14, 1642-1651.
[https://doi.org/10.1016/j.jrmge.2022.03.010]
-
Li, L., Tan, J., Schwarz, B., Stanek, F., Poiata, N., Shi, P., Diekmann, L., Eisner, L. and Gajewki, D., 2020, Recent advances and challenges of waveform-based seismic location methods at multiple scales. Reviews of Geophysics, 58, e2019RG000667.
[https://doi.org/10.1029/2019RG000667]
-
Liu, M., Li, H., Zhang, M. and Wang, T., 2020, Graphics Processing Unit-based Match and Locate (GPU-M&L): an improved match and locate method and its application. Seismological Research Letters, 91, 1019-1029.
[https://doi.org/10.1785/0220190241]
-
Ma, S. and Audet, P., 2014, The 5.2 magnitude earthquake near Ladysmith, Quebec, 17 May 2013: implications for the seismotectonics of the Ottawa-Bonnechere Graben. Canadian Journal of Earth Science, 51, 439-451.
[https://doi.org/10.1139/cjes-2013-0215]
-
Menke, W. and Schaff, D., 2004, Absolute earthquake locations with differential data. Bulletin of the Seismological Society of America, 94, 2254-2264.
[https://doi.org/10.1785/0120040033]
-
Nelson, G.D. and Vidale, J.E., 1990, Earthquake locations by 3-D finite-difference travel times. Bulletin of the Seismological Society of America, 80, 395-410.
[https://doi.org/10.1785/BSSA0800020395]
-
Park, I., Jolly, A., Lokmer, I. and Kennedy, B., 2020, Classification of long-term very long period (VLP) volcanic earthquakes at Whakaari/White Island volcano, New Zealand. Earth, Planets and Space, 72.
[https://doi.org/10.1186/s40623-020-01224-z]
-
Park, J., Sheen, D.H. and Rhee, H.M., 2016, Analysis of M 3.5 Geochang earthquake on February 5, 2013 and its aftershocks. Journal of the Geological Society of Korea, 52, 421-432 (in Korean with English abstract).
[https://doi.org/10.14770/jgsk.2016.52.4.421]
-
Peng, Z. and Zhao, P., 2009, Migration of early aftershocks following the 2004 Parkfield earthquake. Nature Geoscience, 2, 877-881.
[https://doi.org/10.1038/ngeo697]
-
Poupinet, G., Ellsworth, W.L. and Frechet, J., 1984, Monitoring velocity variations in the crust using earthquake doublets: an application to the Calaveras fault, California. Journal of Geophysical Research, 89, 5719-5731.
[https://doi.org/10.1029/JB089iB07p05719]
-
Pujol, J., 1988, Comments on the joint determination of hypocenters and station corrections. Bulletin of the Seismological Society of America, 78, 3, 1179-1189.
[https://doi.org/10.1785/BSSA0780031179]
-
Ross, Z.E., Cochran, E.S., Trugman, D.T. and Smith, J., 2020, 3D fault architecture controls the dynamism of earthquake swarms. Science, 368, 1357-1361.
[https://doi.org/10.1126/science.abb0779]
-
Rowe, C.A., Thurber, C.H. and White, R.A., 2004, Dome growth behavior at Soufriere Hills Volcano, Montserrat, revealed by relocation of volcanic event swarms, 1995-1996. Journal of Volcanology and Geothermal Research, 134, 199-221.
[https://doi.org/10.1016/j.jvolgeores.2004.01.008]
-
Rubinstein, J.L., Ellsworth, W.L. and Dougherty, S.L., 2018, The 2013-2016 induced earthquakes in Harper and Summer Counties, Southern Kansas. Bulletin of the Seismological Society of America, 108, 674-689.
[https://doi.org/10.1785/0120170209]
-
Schaff, D.P., 2008, Semiempirical statistics of correlation-detector performance. Bulletin of the Seismological Society of America, 98, 1495-1507.
[https://doi.org/10.1785/0120060263]
-
Schaff, D.P. and Richards, P.G., 2004a, Repeating seismic events in China. Science, 303, 1176-1178.
[https://doi.org/10.1126/science.1093422]
-
Schaff, D.P. and Richards, P.G., 2004b, Lg-wave cross correlation and double-difference location: Application to the 1999 Xiuyan, China, sequence. Bulletin of the Seismological Society of America, 94, 867-879.
[https://doi.org/10.1785/0120030136]
-
Schaff, D.P. and Waldhauser, F., 2005, Waveform cross-correlation-based differential travel-time measurements at the Northern California Seismic Network. Bulletin of the Seismological Society of America, 95, 2446-2461.
[https://doi.org/10.1785/0120040221]
-
Shearer, P.M., 1997, Improving local earthquake locations using the L1 norm and waveform cross correlation: Application to the Whittier Narrows, California, aftershock sequence. Journal of Geophysical Research: Solid Earth, 102, 8269-8283.
[https://doi.org/10.1029/96JB03228]
- Shearer, P.M., 2010, Aspect of observational seismology. Notes for Caltech class, University of California, San Diego, p. 41, https://igppweb.ucsd.edu/~shearer/CIT/Main.pdf, .
-
Sheen, D.-H., 2021, Analysis of the 2020 Haenam, Korea, earthquake sequence. Geosciences Journal, 25, 33-42.
[https://doi.org/10.1007/s12303-020-0038-3]
-
Shelly, D.R., Beroza, G.C. and Ide, S., 2007, Non-volcanic tremor and low-frequency earthquake swarms. Nature, 446, 305-307.
[https://doi.org/10.1038/nature05666]
-
Shelly, D.R. and Hill, D.P., 2011, Migrating swarms of brittle-failure earthquakes in the lower crust beneath Mammoth Mountain, California. Geophysical Research Letters, 38, L20307.
[https://doi.org/10.1029/2011GL049336]
-
Skoumal, R.J., Brudzinski, M.R., Currie, B.S. and Levy, J., 2014, Optimizing multi-station earthquake template matching through re-examination of the Youngstown, Ohio, sequence. Earth and Planetary Science Letters, 405, 274-280.
[https://doi.org/10.1016/j.epsl.2014.08.033]
-
Son, M., Cho, C.S., Choi, J.-H., Jeon, J.-S. and Park, Y.K., 2021, Spatiotemporal patterns of the 2020 Haenam earthquake sequence, South Korea: lineament and migration implying fluid-driven earthquake swarm. Geosciences Journal, 25, 19-31.
[https://doi.org/10.1007/s12303-020-0043-6]
-
Son, M., Cho, C.S., Lee, H.K., Han, M., Shin, J.S., Kim, K. and Kim, S., 2020, Partitioned fault movement and aftershock triggering: evidence for fault interactions during the 2017 Mw 5.4 Pohang earthquake, South Korea. Journal of Geophysical Research: Solid Earth, 125, e2020JB020005.
[https://doi.org/10.1029/2020JB020005]
-
Son, M., Cho, C.S., Shin, J.S., Rhee, H.-M. and Sheen, D.-H., 2018, Spatiotemporal distribution of events during the first three months of the 2016 Gyeongju, Korea, earthquake sequence. Bulletin of the Seismological Society of America, 108, 210-217.
[https://doi.org/10.1785/0120170107]
-
Son, M., Shin, J.S., Kim, G. and Cho, C.S., 2015, Epicenter relocation of two 2013 earthquake sequences in the Yellow Sea, Korea, using travel-time double-differences and Lg-wave cross-correlation. Geosciences Journal, 19, 295-303.
[https://doi.org/10.1007/s12303-014-0038-2]
-
Sugan, M., Vuan, A., Kato, A., Massa, M. and Amati, G., 2019, Seismic evidence of an early afterslip during the 2012 sequence in Emilia (Italy). Geophysical Research Letters, 46, 625-635.
[https://doi.org/10.1029/2018GL079617]
-
Thompson, G. and Reyes, C., 2018, GISMO - a seismic data analysis toolbox for MATLAB (Version 1.20b) [software package]. Available at: http://geoscience-community-codes.github.io/GISMO/, . Accessed: September 30, 2022.
[https://doi.org/10.5281/zenodo.1404723]
- Trugman, D., 2018, GrowClust: A computer program for the relative relocation of earthquake hypocenters. User Guide, Version 1.2, p. 13, https://github.com/dttrugman/GrowClust/blob/master/GrowClust_UserGuide.pdf, . (November 22, 2022).
-
Trugman, D.P. and Shearer, P.M., 2017, GrowClust: A hierarchical clustering algorithm for relative earthquake relocation, with application to the Spanish Springs and Sheldon, Nevada, Earthquake sequence. Seismological Research Letters, 88, 379-391.
[https://doi.org/10.1785/0220160188]
-
Uchide, T. and Song, S.G., 2018, Fault rupture model of the 2016 Gyeongju, South Korea, earthquake and its application for the underground fault system. Geophysical Research Letters, 45, 2257-2264.
[https://doi.org/10.1002/2017GL076960]
-
Waldhauser, F., 2001, HypoDD: A program to compute double-difference hypocenter locations. U.S. Geological Survey, Open File Report 01-113.
[https://doi.org/10.3133/ofr01113]
-
Waldhauser, F. and Ellsworth, W.L., 2000, A double-difference earthquake location algorithm: Method and application to the Northern Hayward fault, California. Bulletin of the Seismological Society of America, 90, 1353-1368.
[https://doi.org/10.1785/0120000006]
-
Waldhauser, F. and Schaff, D.P., 2008, Large-scale relocation of two decades of Northern California seismicity using cross-correlation and double-difference methods. Journal of Geophysical Research: Solid Earth, 113, B08311.
[https://doi.org/10.1029/2007JB005479]
-
Wessel, P., Smith, W.H.F., Scharroo, R., Luis, J. and Wobbe, F., 2013, Generic mapping tools: Improvement version released. Eos, 94, 409-410.
[https://doi.org/10.1002/2013EO450001]
-
West, M.E., 2013, Recent eruptions at Bezymianny volcano-A seismological comparison. Journal of Volcanology and Geothermal Research, 263, 42-57.
[https://doi.org/10.1016/j.jvolgeores.2012.12.015]
-
Woo, J.-U., Kim, M., Sheen, D.-H., Kang, T.-S., Rhie, J., Grogoli, F., Ellsworth, W.L. and Giardini, D., 2019, An in-depth seismological analysis revealing a causal link between the 2017 Mw 5.5 Pohang Earthquake and EGS project. Journal of Geophysical Research: Solid Earth, 124, 13060-13078.
[https://doi.org/10.1029/2019JB018368]
-
Yao, D., Walter, J., Meng, X., Hobbs, T.E., Peng, Z., Newman, A., Schwartz, S. and Protti, M., 2017, Detailed spatiotemporal evolution of microseismicity and repeating earthquakes following the 2012 Mw 7.6 Nicoya earthquake. Journal of Geophysical Research: Solid Earth, 122, 524-542.
[https://doi.org/10.1002/2016JB013632]
-
Yoon, C.E., Yoshimitsu, N., Ellsworth, W.L. and Beroza G.C., 2019, Foreshocks and mainshocks nucleartion of the 1999 Mw 7.1 Hector Mine, California earthquake. Journal of Geophysical Research: Solid Earth, 124, 1569-1582.
[https://doi.org/10.1029/2018JB016383]
-
Yue, H., Ross, Z.E., Liang, C., Michel, S., Fattahi, H., Fielding E., Moore, A., Liu, Z. and Jia, Bo, 2017, The 2016 Kumamoto Mw=7.0 earthquake: a significant event in an fault-volcano system. Journal of Geophysical Research: Solid Earth, 122, 9166-9183.
[https://doi.org/10.1002/2017JB014525]
-
Zhang, M., Liu, M., Feng, T., Wang, R. and Zu, W., 2022, LOC-FLOW: An end-to-end machine learning-based high-precision earthquake location workflow. Seismological Research Letters, 93, 2426-2438.
[https://doi.org/10.1785/0220220019]
-
Zhang, M. and Wen, L., 2015, An effective method for small event detection: match and locate (M&L). Geophysical Journal International, 200, 1523-1537.
[https://doi.org/10.1093/gji/ggu466]