강원도 인제군 일대에 발달한 금왕단층대의 구조적 특성과 제4기 시간ㆍ공간적 활동패턴
초록
강원도 인제군 일대에 흑운모편마암, 화강편마암 및 흑운모화강암을 관통하는 금왕단층대가 발달되어 있다. 단층핵 3 지점에 대해 조사를 실시하였으며, 약 11 ~ 23 m 폭을 보이는 단층핵은 단층각력암 우세대와 단층비지 우세대로 이루어져 있다. 단층핵의 활동이력을 면밀히 파악하기 위해, 단층핵을 구성하는 단층암의 특징을 이용하여 선후관계를 규명하였으며 단층비지의 ESR 연대측정을 통해 제4기 활동형태를 해석하였다. 단층핵에서 관찰되는 지질구조 특성을 근거로 한 단층핵의 진화과정은 크게 6단계로 구분된다. 1) 좌수향 주향이동 운동이 우세했던 제4기 이전에 다양한 방향의 전단면 및 단열면들이 발달하였다. 2) 분산 분쇄 각력암화와 마찰 각력암화에 의해 암편들의 원마도가 비교적 양호해졌으며, 암편 사이는 단층비지가 채워져 있는 단층각력암대가 형성되었다. 3) 단층각력암으로 이루어진 단층핵이 재활동을 겪으면서 단층비지의 양이 증가하였고 단층각력암 암편이 단층비지 내에 잔유물의 형태로 분포한다. 4) 단층비지 내 암편들의 크기가 작아지고 원마도가 좋아지면서 기질의 함량이 증가하여 괴상의 단층비지대로 진화하였다. 5) 색이 다른 수 mm ~ cm 두께의 단층비지띠들이 Y-전단 방향으로 우세하게 발달한 단층비지대가 형성되었다. 6) 단층비지띠들이 우세하게 발달한 단층비지대에서 전단변형이 지속됨에 따라 칼집습곡이 발달되었다. 단층비지의 ESR 연대측정 결과를 이용하여 커널밀도추정 곡선을 작성한 결과, 연구지역에 발달한 금왕단층대는 약 52만 년 전, 약 41만 년 전, 약 32만 년 전 및 약 22만 년 전에 주로 재활동했던 것으로 판단된다. 단층핵과 모암 사이에 발달한 경계 단층비지띠와 단층핵 내부에 있는 단층비지띠가 같은 활동시기에 반복적으로 재활동하였으며, 금왕단층의 주향방향으로 약 10.2 km 길이를 가지는 단층핵의 경계 단층비지띠가 같은 활동시기에 재활동하였다.
Abstract
The Keumwang fault zone is developed in biotite gneiss, granitic gneiss and biotite granite at the Inje-gun area, Ganwong-do, Korean peninsula. We investigated three locations of fault core, which are composed of fault breccia-dominated zones and fault gouge-dominated zones. The width of the fault core is approximately about 11 ~ 23 m thick in the study area. In order to closely understand the activity history of the fault core, we interpreted the sequence of formation of each fault rock zone, and the Quaternary fault activity was analyzed using ESR data for fault gouge bands. The evolution process of a fault core is divided into six stages based on the structural characteristics observed in the fault core. 1) Sinistral strike-slip movements produced shear surfaces and fractures in various directions within the fault zone before the Quaternary period. 2) Rock fragments were displaced, and the gouge materials filled the space between them by distributed crush brecciation and attrition brecciation. 3) Amount of fault gouge was increased by reactivated frictional sliding of rock fragments. Relics of older fault breccia remain within the fault gouge. 4) As the size of rock fragments in the fault gouge became smaller and the roundness of grains gradually increased, the volume of the gouge increases. Accordingly, massive fault gouges were formed. 5) Several mm ~ cm thick fault gouge bands with different colors predominantly developed in the Y-shear direction. 6) Sheath folds are developed by continued shear deformation within the fault gouge with various colorful bands. The Kernel Density Estimation (KDE) curve drawn using ESR data shows that the Keumwang fault zone in the study area was reactivated repeatedly at about 520, 410, 320, and 220 ka. The fault gouge bands developed along the boundary fault plane and within the fault core are reactivated at the same active periods. In addition, the fault gouge bands developed along the fault core about 10.2 km long appear to be activated at the same active periods.
Keywords:
Keumwang fault zone, fault core, evolution of fault core, ESR dating of fault gouge, pattern of Quaternary fault activity키워드:
금왕단층대, 단층핵, 단층핵의 진화, 단층비지의 ESR 연대측정, 제4기 활동형태1. 서 론
지각 10 ~ 15 km 이내의 깊이에서 취성변형작용에 의해 형성되는 단층대(fault zone)는 전단변형작용이 가장 집중되어 있는 단층핵(fault core)과 단층핵 주변을 감싸고 있으며 많은 취성변형구조들이 발달된 단층손상대(fault damage zone)로 이루어져 있다(Chester and Logan, 1986, 1987; Schulz and Evans, 2000; Fossen, 2010). 단층핵의 폭은 수 mm에서부터 수십 m 까지 다양하게 발달하며 수직응력, 변위량, 마모계수 등에 비례하고, 경도에 반비례하여 형성되는 깊이가 깊어짐에 따라 넓게 발달한다(Scholz, 1988). 단층핵을 구성하고 있는 단층암(fault rock)들은 암상, 온도조건, 압력조건, 운동특성 등에 따라 다양한 종류로 생성된다(Sibson, 1977). 취성지각 상부(지하 1 ~ 4 km 보다 얕은 곳)에서 형성되는 단층암에는 응집력이 없는 단층각력암(fault breccia)과 단층비지(fault gouge)가 있다. 단층각력암과 단층비지는 암편의 함량에 따라 구분하는데, 암편의 함량이 30% 이상이면 단층각력암, 30% 미만이면 단층비지로 분류된다(Sibson, 1977).
주향이동 운동에 의해 형성된 단층암 내에는 Y-, R-, P-, 및 R’-전단 방향의 다양한 전단면들이 발달한다(Rutter et al., 1986; Passchier and Trouw, 1996). 전단면의 발달 과정 중 가장 먼저 발달하는 R-전단면은 주 전단방향으로 발달하는 Y-전단면과 저각을 이루며 형성되며, 주 전단운동과 같은 운동감각을 가진다. 그 이후에 응력변형타원체의 장축방향으로 형성되는 P-전단면은 R-전단면과는 반대 방향으로 Y-전단면과 저각을 이루며 형성되며, 역시 주 전단운동과 같은 운동감각을 가진다. 단층비지가 전단변형을 계속해서 받으면 단층비지를 구성하는 점토광물들이 선택배향하면서 P-전단면과 같은 방향으로 엽리(P-엽리 or S-엽리)를 형성한다(Berthe et al., 1979; Logan, 1979). 이러한 P-엽리의 방향은 단층운동의 운동감각을 파악하는데 이용할 수 있으며, 전단응력변형이 증가함에 따라 P-엽리는 Y-전단면과 평행한 방향으로 회전하게 된다(Ramsay and Huber, 1983). R’-전단면은 R-전단면과 공액관계를 이루고 있으며 주 전단운동과 반대의 운동감각을 가진다.
단층핵을 구성하는 수 mm ~ 수 cm 두께의 단층비지띠들은 서로 다른 단층운동 역사를 가지고 있다. 각각의 단층비지띠에서 채취한 단층비지의 ESR 연대를 종합하여 주어진 단층핵의 제4기 시간∙공간적인 활동형태를 규명할 수 있다(e.g., Ikeya et al., 1982; Grün, 1989, 1992; Lee, 1999; Lee and Schwarcz, 2001; Lee and Yang, 2003; Yang, 2006). 단층면에 작용하는 수직응력이 약 3 MPa 이상이고 약 0.3 m 이상의 변위량이 있다면 단층비지가 가지고 있는 ESR 신호의 세기는 완전히 0이 된다(Ariyama, 1985; Grün, 1989; Tanaka, 1990; Lee and Schwarcz, 1993). 단층면에 작용하는 수직응력은 지하로 감에 따라 증가하여 지표의 노두에서 채취한 단층비지의 ESR 연대의 하한은 단층비지가 재활동했을 때의 깊이와 융기율에 의해 결정된다(Ito and Swada, 1985; Grün, 1989). ESR 신호 신호의 세기가 0이 될 수 있는 깊이는 약 20 ~ 30 m이며 한반도 남동부의 융기율(약 0.08 ~ 0.25 mm/year)을 이용하여 계산하였을 때, 단층비지의 ESR 연대의 하한은 약 15만 내지 20만 년으로 계산된다(Kim et al., 2006; Synn et al., 2013; Kim and Lee, 2020). ESR 연대의 상한은 ESR 신호가 포화되는 데까지 걸리는 등가선량(equivalent dose)과 단위시간당 조사율(dose rate)을 이용하여 결정할 수 있으며, 일반적으로 약 200만 년으로 알려져 있다(Lee, 1999; Lee and Schwarcz, 2001). 단층비지의 ESR 연대측정법의 상세한 설명은 Lee (1995, 1999), Lee and Schwarcz (2000), Schwarcz and Lee (2000), Kim and Lee (2020) 등의 논문에 제시되어 있다.
이 논문의 연구대상인 금왕단층대(Keumwang fault zone)는 경기육괴를 북동-남서방향으로 가로지르는 공주단층계의 북동부에 해당하며(그림 1a), 충청북도 음성군 일대에 발달한 백악기 음성분지의 북서쪽 경계에서부터 강원도 인제군 설악산 일대에 발달한 서북서-동남동 방향의 한계령단층 이남까지 약 180 km의 연장성을 보이는 주향이동단층이다. 많은 연구들을 통해 금왕단층의 주향방향을 따라 압쇄암 계열(mylonite series), 파쇄암 계열(cataclasite series), 단층비지, 단층각력암 등의 단층암이 산재되어 분포하고 있음이 보고되어 금왕단층이 형성 이후에 다른 변형환경들에서 진화해왔음을 알 수 있다(Lee and Kim, 2005, 2011; Lee, 2010; Choi et al., 2012; Hong and Lee; 2012; Jang and Lee, 2012; Park and Lee, 2012; Hong, 2013; Bae and Lee, 2014; Kim and Lee, 2016, 2017; Kim, 2018; Weon and Lee, 2018; Choi and Lee, 2020; Min, 2020). 각기 다른 변형환경에서 형성된 금왕단층대의 발달사는 다음과 같다(Kim and Lee, 2016). 쥐라기 후기 및 백악기 초기에 흑운모화강암의 관입 이후 지하 10 ~ 15 km 깊이의 취성-연성 전이대에서 압쇄암 계열로 이루어진 금왕연성전단대(Keumwang ductile shear zone)가 형성되었다. 심부에 발달되어 있던 연성전단대는 융기 및 침식작용으로 인해 지하 1 ~ 4 km 보다 깊고 지하 10 ~ 15 km 보다 얕은 깊이에서 취성변형환경에서 형성된 파쇄암 계열의 취성단층대로 전이되면서 압쇄암 계열에 파쇄암 계열이 중첩되었다. 파쇄암 계열의 취성단층대가 융기 및 침식작용으로 인해 지표면(지하 1 ~ 4 km의 깊이)으로 접근한 이후 전단운동에 의해 단층비지 및 단층각력암을 형성시켰으며, 백악기 초기 오트리브세에 작용한 남-북 압축응력에 의해 금왕단층대가 좌수향 주향이동 운동을 겪으면서 당겨열림분지(pull-apart basin)인 음성분지와 풍암분지가 형성되면서 분지 내에 육성 퇴적층이 퇴적되었다(Choi and Choi, 2007). 이후 좌수향 주향이동 운동에 의해 전단변형을 받은 퇴적암과 단층비지가 금왕단층대에 발달되었다. 약 84 ~ 70 Ma에 풍암분지 내에 안산암이 관입한 이후(Cheong and Kim, 1999), 금왕단층대 내에는 우수향 주향이동 증거를 보이는 지질구조들이 발달되었다(Hong, 2013). 마지막으로 제4기에는 우수향 주향이동 운동으로 인해 단층비지 및 단층각력암이 형성되거나 이전에 발달했던 단층암이 재활동하였다. 제4기에 활동한 시기는 ESR 연대측정법에 근거하여 보고된 바가 있다(Lee, 2010; Choi et al., 2012; Hong and Lee; 2012; Hong, 2013; Bae and Lee, 2014; Kim and Lee, 2017; Kim, 2018; Weon and Lee, 2018; Choi and Lee, 2020; Min, 2020; Kim and Lee, submitted).
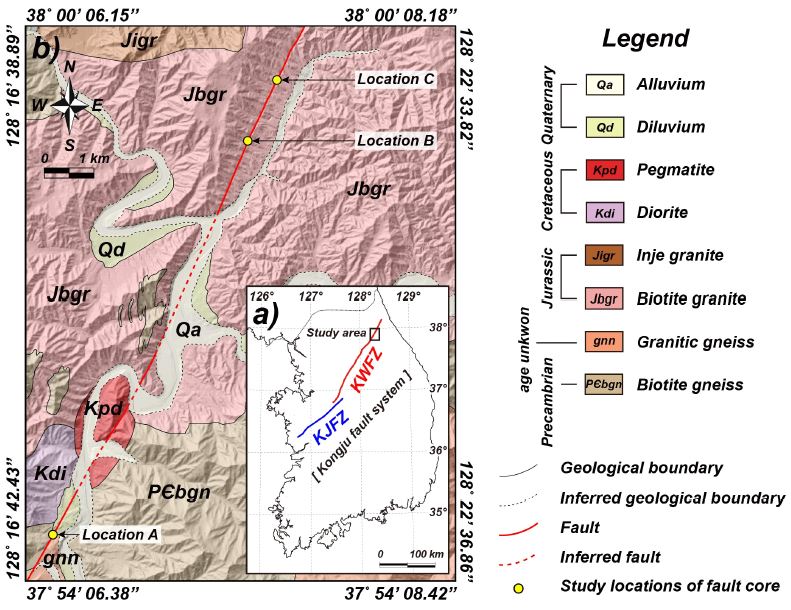
(a) Kongju fault system in the Korean peninsula (modified from KIGAM, 2019). The blue line represents the Kongju fault zone (KJFZ), and the red line symbolizes the Keumwang fault zone (KWFZ). The black rectangle shows the location of the study area. (b) Geological map of the study area (modified from Kim et al., 1975).
이번 연구의 목적은 강원도 인제군 일대에서 발견한 총 3 지점의 금왕단층의 단층핵에 대한 연구결과를 종합하여 해석하는데 있다. 단층핵에 발달한 단층암의 특성, 전단면의 방향성, 운동감각 등의 특성을 파악하여 단층핵의 진화과정을 규명하고 ESR 연대측정 결과와 종합하여 제4기 시간·공간적 활동형태를 파악하고자 한다.
2. 연구지역의 지질
연구지역의 기저에는 선캠브리아 누대 흑운모편마암(biotite gneiss)이 분포하고 있으며, 이를 시대미상의 화강편마암(granitic gneiss), 중생대 쥐라기 흑운모화강암(biotite granite), 인제화강암(inje granite), 백악기 섬록암(diorite), 페그마타이트(pegmatite)가 관입하고 제4기 홍적층(dilluvium) 및 충적층(alluvium)이 기존의 암석들을 부정합으로 피복하며 분포하고 있다(그림 1b; Kim et al., 1975).
선캠브리아 누대 흑운모편마암은 주로 연구지역의 남부에 분포하며, 연구지역의 일부 지점에서도 포획암의 형태로도 확인된다. 흑운모편마암에는 석영과 장석이 우세하게 분포하는 우백대와 흑운모가 우세하게 분포하고 있는 우흑대가 반복되어 나타나는 편마구조가 매우 잘 발달되어 있다. 연구지역의 남서부에서 관찰되는 시대미상의 화강편마암은 흑운모편마암과 관입 및 단층접촉관계를 이루고 있다. 화강편마암은 사장석, 석영 및 흑운모 등의 광물들로 이루어져 있으며, 길게 늘어진 석영, 자형의 사장석 반상변정과 불규칙하게 모여 있는 흑운모에 의해 재결정화된 편마구조가 발달되어 있다(Kim et al., 1975). 이러한 산출형태나 흑운모편마암과의 접촉관계를 보았을 때, 화강암질 기원인 정편마암(orthogneiss)으로 추정된다고 보고된 바가 있다(Kim et al., 1975). 연구지역의 지질을 대부분 차지하고 있는 흑운모화강암은 흑운모편마암을 관입하고 있다. 흑운모화강암은 연구지역의 북부로 연장되어 분포하고 있는데, 설악산 일대에서 실시한 SHRIMP 저어콘 U-Pb 연대는 171.2 ± 2.8 Ma로 보고되었다(Kee et al., 2010). 흑운모화강암의 관입할 당시의 영향으로 인해 일부 분포지에서 미그마타이트질(migmatitic) 편마암이 관찰되기도 한다. 단층 주변에서는 풍화작용과 열수에 의한 변질작용으로 인해 장석류로부터 치환된 견운모(sericite)와 흑운모로부터 치환된 녹니석(chlorite)이 관찰되기도 한다. 연구지역의 북부에 분포하는 인제화강암은 흑운모화강암과 관입경계를 이루고 있으며 흑운모화강암과는 달리 백운모도 함유하고 있는 복운모화강암의 형태로 관찰된다. 연구지역의 중앙부에 분포하고 있는 섬록암은 흑운모편마암 및 흑운모화강암과 관입경계를 이루고 있다. 연구지역에서 관찰되는 섬록암은 일반적인 섬록암보다 대체적으로 석영 함량이 높은 것이 특징이며, 마그마가 굳어져서 결정화될 때 흑운모와 같은 유색광물이 한 곳에 밀집되어 형성된 포유암(enclave)이 관찰되기도 한다. 연구지역의 남서부 지역에서 관찰되는 페그마타이트는 금왕단층대의 주향방향인 북동-남서 방향으로 분포하고 있다. 페그마타이트는 그 관입 이전의 암석들이 비해 풍화작용 및 변질작용에 덜 노출되어 암석이 대체적으로 신선한 편이다. 제4기 플라이스토세(Pleistocene)에 퇴적된 홍적층은 오늘날 흐르고 있는 하천보다 약 20∼30 m 고도 위에 분포하고 있으며, 고화가 완전히 진행되지 않은 역질 및 사질 퇴적물이 호층을 이루면서 나타나고 있다. 현생의 하천 주변에는 물이 흐르면서 퇴적된 역질 및 사질 퇴적물이 충적층을 형성하고 있다.
3. 연구방법
선형구조(Lineament)는 항공사진 및 위성사진에서 관찰할 수 있는 선형의 지형요소로(Beanland and Clark, 1994), 단층이나 암석 간의 경계와 같은 지구조적 특성과 하천에서의 침식 및 퇴적작용으로 인하여 지표상에 발달한다(Kim et al., 1996; Won et al., 1998; Lee and Kim, 2002; Oh and Kim, 2019). 지구조적운동에 의해 형성된 선형구조는 지형의 변위 및 변형을 반영할 수 있기 때문에 최근에 활동한 활성단층의 존재를 파악하는데 매우 중요한 역할을 하고 있다(Kim et al., 2017).
선형구조는 항공사진 및 위성사진을 관찰하거나 DEM(Digital Elevation Model, 수치 표고 모델)을 제작함으로써 분석할 수 있다(Won et al., 1998; Lee and Kim, 2002). 연구지역에 발달한 선형구조를 추출하기 위해 국토지리정보원에서 제공하는 1:5,000 수치지형도를 Esri사에서 제작한 ArcGIS 프로그램을 이용하여 5 m 간격의 수치 표고 모델로 제작하였다. 이후 선형구조를 시각적으로 분석하기 위해 태양의 위치(azimuth)와 고도(altitude)를 조절하여 음영기복도(hill-shade relief)를 제작하였다. 항공사진과 음영기복도를 이용하여 분석한 결과, 지금까지 알려진 금왕단층대의 주향방향과 유사한 방향인 북동-남서 방향 선형구조가 관찰되며, 특히 연구지역 북쪽의 산지에서 매우 뚜렷한 연장성을 보이고 있다(그림 1b). 연구지역의 북쪽 산지에서는 유사한 방향의 선형구조가 2개 관찰되는 특징을 보이나 하천이 어긋난 것(offset)과 같은 지형요소는 발견하지 못하였다. 이 선형구조는 단층비지 및 단층각력암으로 이루어진 금왕단층대의 단층핵이 침식작용을 받아 형성된 침식 계곡(incised valley)으로써 오래된 단층의 자취(older fault trace)이다.
연구지역 내에 발달한 선형구조를 따라 약 10.2 km 내에서 3 지점의 단층핵 지점(그림 1b; Locations A, B, and C)을 발견하였다. 이 논문에서 보고할 3 지점의 단층핵의 폭은 각각 약 23 m, 11 m 및 17 m이며, 모두 단층각력암 우세대와 단층비지 우세대가 교호하고 일부 모암의 잔유물을 포함하고 있는 특징을 보이고 있다. 각 단층핵에서 관찰되는 단층암의 특성, 전단면의 방향 및 운동감각 등의 지질구조 특성을 조사하였고 단층핵과 단층핵 주변에 발달한 일부 부차단층에서 채취한 단층비지띠들의 ESR 연대 결과를 종합하여 분석하였다.
4. 금왕단층 단층핵의 지질구조 특성
4.1 A 지점
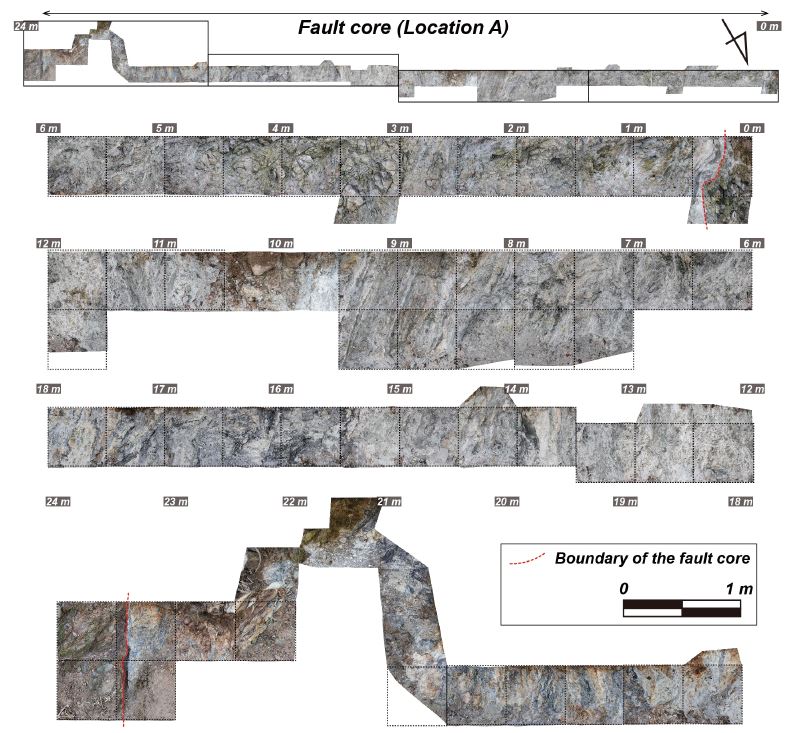
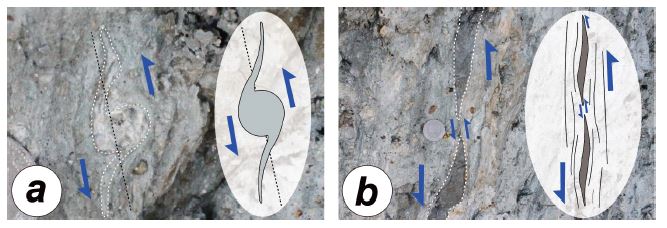
A 지점은 강원도 인제군 상남면 일대(그림 1b; 37° 54' 37.05'' N, 128° 17' 3.43'' E)로, 폭이 약 23 m인 단층핵은 흑운모편마암과 화강편마암의 경계부에 발달하며, 단층핵의 양쪽 경계가 뚜렷하게 관찰된다(그림 2, 3a, 3b, 3c). 단층핵의 북서쪽 경계부는 모암과 5 ~ 7 cm 두께의 흰색 단층비지띠가 N32°E/81°SE 자세의 단층경계를(그림 3b), 남동쪽 경계부는 모암과 약 5 cm 두께의 검은색 단층비지띠가 N15°E/87°SE 자세의 단층경계를 이루고 있다(그림 3c). 단층핵은 단층각력암대와 단층비지대가 교호하며 형성되어 있다. 단층각력암의 함량이 높은 2개의 단층각력암 우세대(그림 3a, 3d; FB1, 2)와 단층비지의 함량이 높은 2개의 단층비지 우세대(그림 3a, 3e; FG1, 2)를 각각의 구조구로 분류하여 각 구조구에 발달한 전단면(엽리면도 포함)을 측정하여 그 방향성 및 운동감각을 분석하였다(그림 3a). 단층각력암 우세대는 크기가 수 cm에서 수십 cm 까지 다양하고 원마도가 아원형에서 원형인 암편이 주를 이루고 있으며, 암편 사이의 틈은 단층비지가 기질로써 채워져 있다(그림 3d). 단층비지 우세대는 색이 다른 단층비지띠들이 우세하게 발달한 부분과 괴상의 것이 혼재되어 있다(그림 3e). 단층비지 우세대 내에는 좌수향 운동감각을 지시하는 구조가 다수 관찰된다(그림 4). 석영이나 장석 등의 반상쇄정이 좌수향 주향이동 운동에 의한 회전의 영향을 받아 δ형의 얇은 꼬리가 관찰되며(그림 4a), 담회색 단층비지띠가 좌수향 주향이동 운동에 의해 P-전단면 방향으로 인장되어 끊긴 부딘구조도 관찰된다(그림 4b). 4개의 구조구 중 구조구 FG 1에 전단면이 가장 많이 발달되어 있으며, 특히 Y-전단면과 P-전단면이 우세하게 발달되어 있다(그림 3a). 단층비지 내에 발달한 P-엽리면의 주향은 N30°E 이상인 것이 우세하게 발달되어 있는데, 이는 금왕단층이 좌수향 주향이동 운동을 했을 때 형성된 것임을 지시한다. 또한 전단 응력변형이 증가함에 따라 P-엽리면의 방향이 전단면에 대해 반시계 방향으로 회전하면서 Y-전단면에 점차 평행해지기도 한다. 단층핵의 북서쪽 경계부에서 남동쪽 경계부로 가면서 각 구조구에서 관찰 가능한 전단면의 수는 급격히 감소하나 대체적으로 P-전단면 및 Y-전단면이 우세하게 발달한다(그림 3a). 강체회전(rigid body rotation)을 겪지 않았을 단층손상대에서 측정한 전단면의 방향들과 단층핵 내의 각 구조구에서 측정한 전단면의 방향이 서로 유사한 것으로 보아, 단층핵 내부의 암체들도 강체회전이 미약했을 것으로 판단된다(그림 3a).
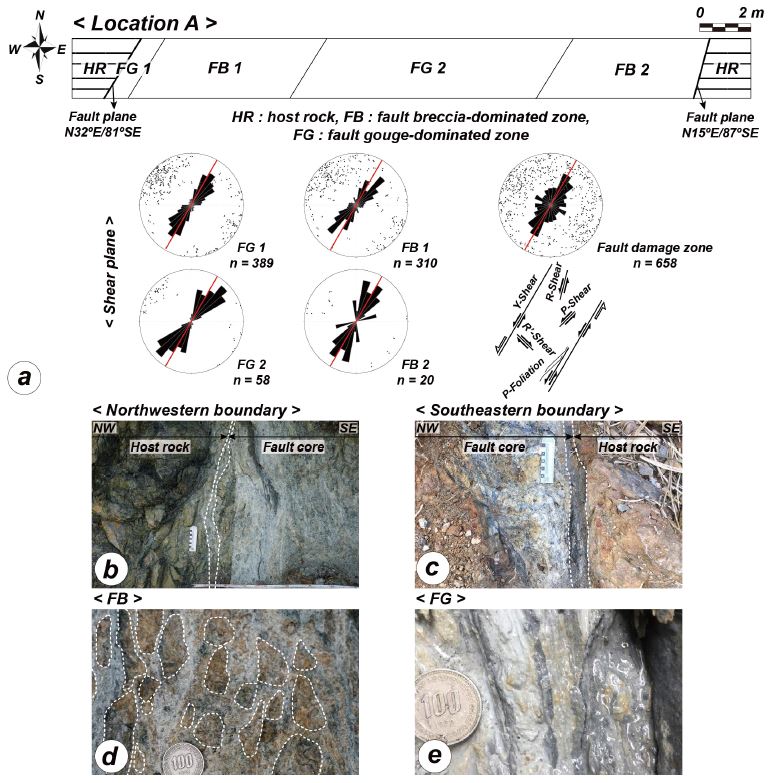
(a) Schematic diagram of map view across location A showing the interior features of the fault core. The rose diagrams show the orientations of shear surfaces developed in each domain of the fault core and fault damage zone. Red lines in stereonets show the orientation of the main fault core of the Keumwnag fault zone. The directional terminology and geometrical relationships for shear surfaces in sinistral strike-slip fault (Y, R, R’, P-shear and P-foliation) follow Rutter et al. (1986) and Passchier and Trouw (1996). (b) A fault gouge band developed along the northwestern boundary of the fault core. (c) A fault gouge band developed along the southeastern boundary of the fault core. (d) A close-up photograph of a fault breccia-dominated zone (FB). (e) A close-up photograph of a fault gouge-dominated zone (FG).
4.2 B 지점
A 지점으로부터 북동쪽으로 약 8.8 km 떨어져 있는 B 지점은 강원도 인제군 기린면 북리 일대(그림 1b; 37° 58' 54.04'' N, 128° 19' 42.95'' E)로, 산지에 형성되어 있는 금왕단층의 선형구조 위에 위치해 있다. 모암인 흑운모화강암 내에 발달한 약 11 m 폭의 단층핵은 양쪽 경계가 모두 확인되었으며(그림 5a, 5b, 5c), 단층각력암이 우세한 단층각력암 우세대(그림 5a, 5d; FB)와 회색 및 암회색 단층비지띠 등으로 구성된 단층비지 우세대(그림 5a, 5e; FG)로 구분된다. 단층핵의 북서쪽 경계부에는 모암과 약 3 ~ 7 cm 두께의 회색 단층비지띠가 단층경계(N30°E/78°SE)를 이루고 있다(그림 5b). 단층핵의 남동쪽 경계부에는 약 3 cm의 회색 단층비지띠와 흑운모화강암에서 유래된 엽리가 발달한 파쇄암이 N32°E/84°SE 자세의 단층경계를 형성하고 있다(그림 5c). 단층각력암 우세대는 크기가 수 cm이며 원마도가 아원형에서 원형인 암편들이 주를 이루고 있으며, 암편 사이의 틈은 단층비지가 기질로써 채워져 있다(그림 5d). 단층비지 우세대는 괴상의 단층비지로 이루어진 부분과 수 cm 폭의 단층비지띠가 우세한 부분으로 이루어져 있다(그림 5e). B 지점은 노두 노출에 제한이 있어 단층핵 내부의 구조를 보다 상세히 분석하기는 어려웠다.
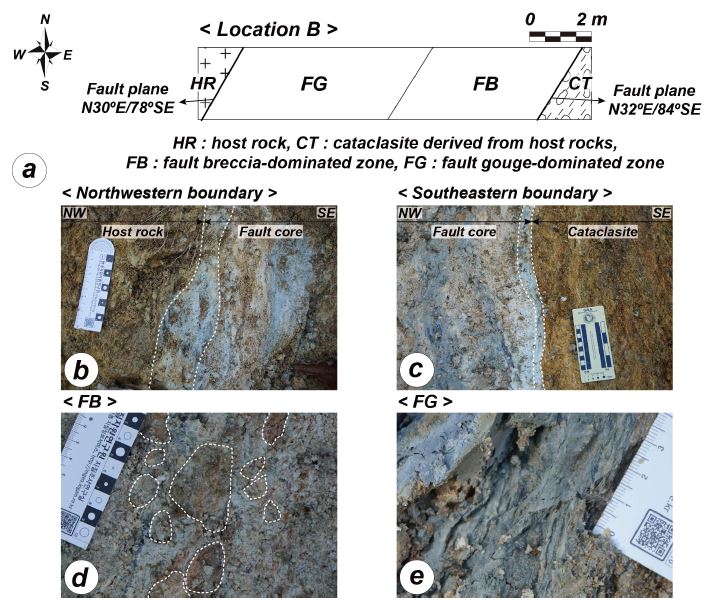
(a) Schematic diagram of map view across location B showing the interior features of fault core. The width of the fault core is about 11 m. (b) A fault gouge band developed along the northwestern boundary of the fault core. (c) A fault gouge band developed along the southeastern boundary of the fault core. (d) A close-up photograph of a fault breccia-dominated zone (FB). (e) A close-up photograph of a fault gouge-dominated zone (FG).
4.3 C 지점
B 지점으로부터 북동쪽으로 약 1.4 km 떨어져 있는 C 지점은 강원도 인제군 기린면 북리 일대(그림 1b; 37° 59' 34.40'' N, 128° 20' 6.53'' E)로, B 지점을 지나가는 금왕단층의 선형구조와 같은 선상에 위치해 있다. 모암인 흑운모화강암 내에 발달한 약 17 m 폭의 단층핵(그림 6a)은 양쪽 경계가 모두 확인되었으며(그림 6b, 6c), 단층각력암이 우세한 단층각력암 우세대(그림 6a, 6d; FB)와 회색 및 검은색의 단층비지띠 등으로 이루어진 단층비지 우세대(그림 6a, 6e; FG1, 2)가 단층각력암 양 옆에 분포하는 형태를 보인다. 단층핵의 북서쪽 경계부에는 약 4 ~ 8 cm 두께의 검은색 단층비지띠가 모암과 N53°E/65°NW 자세의 단층 경계를 이루고 있으며(그림 6b), 단층핵의 남동쪽 경계부에는 약 15 cm 두께의 회색 단층비지띠와 모암이 N20°E/86°NW 자세의 단층경계를 이루고 있다(그림 6c). 단층각력암 우세대는 크기가 수 cm에서 수십 cm 까지 다양하고 다른 지점들과는 다르게 넓은 폭의 원마도를 보이는 (각형에서 원형) 암편들이 주를 이룬다(그림 6d). 암편들은 서로 맞물려 있거나 틈이 있는 경우에는 단층비지가 기질로써 틈을 채우고 있다. 단층비지 우세대는 괴상의 단층비지로 이루어진 부분과 수 cm 폭의 단층비지띠가 우세한 부분으로 이루어져 있다(그림 6e). 북서쪽 경계부 주변의 단층비지대 우세대에는 괴상의 검은색 단층비지대가 우세하게 발달되어 있으며, 남동쪽 경계부 주변의 단층비지대 우세대에는 다양한 색의 단층비지띠들이 교호하는 형태로 발달되어 있다. 사유지에 위치한 C 지점은 노두를 정리하는데 제한이 있어 단층핵 내부의 구조를 보다 상세히 분석하기는 어려웠다.
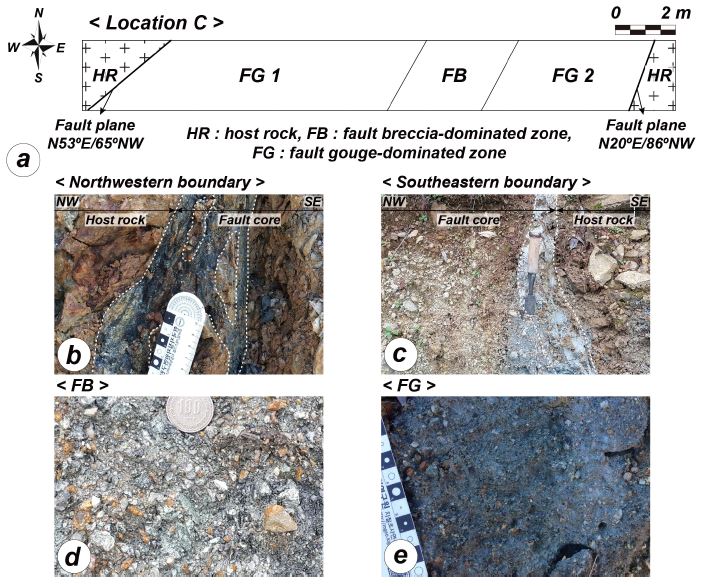
(a) Schematic diagram of map view across location C showing the interior features of fault core. The width of the fault core is about 17 m. (b) A fault gouge band developed along the northwestern boundary of the fault core. (c) A fault gouge band developed along the southeastern boundary of the fault core. (d) A close-up photograph of a fault breccia-dominated zone (FB). (e) A close-up photograph of a fault gouge-dominated zone (FG).
5. ESR 연대측정 결과
단층핵 내부를 비교적 자세히 관찰할 수 있는 단층핵 A 지점의 경우, 단층비지띠들이 단층핵 내부에 균일한 간격으로 발달하지 않아 약 23 m 폭을 가지는 단층핵으로부터 단층핵을 가로지르는(across) 방향으로 불규칙한 간격을 가지며 42개의 시료(등간격일 경우에는 약 0.55 m마다 1개의 시료를 채취)를 채취하였다(그림 7a). 단층핵에 발달한 모든 단층비지띠에서 시료를 채취하지 못해 ESR 연대측정 결과를 이용하여 단층핵 A지점의 제4기 시간·공간적 활동형태에 대해 완벽하게 해석할 수는 없었다. 채취한 시료에 대해 분석을 실시하여 얻은 ESR 연대측정 결과를 통계적 기법을 통해 시간·공간적 활동형태에 대한 특성을 분석하였다. 우리는 단층활동 시기(ESR 연대 자료) 분포를 시각화하기 위해 Density Plotter 소프트웨어를 이용하여 확률 밀도 추정에 사용되는 커널밀도추정(Kernel density estimation, KDE) 곡선을 작성하였다(그림 7b; Vermeesch, 2012). KDE 곡선은 가변 대역폭을 갖는 Epanechnikov 곡선을 적층하여 생성되며 KDE 곡선의 피크의 대역폭은 주로 ESR 연대의 밀도에 의해 결정된다(Vermeesch, 2012).
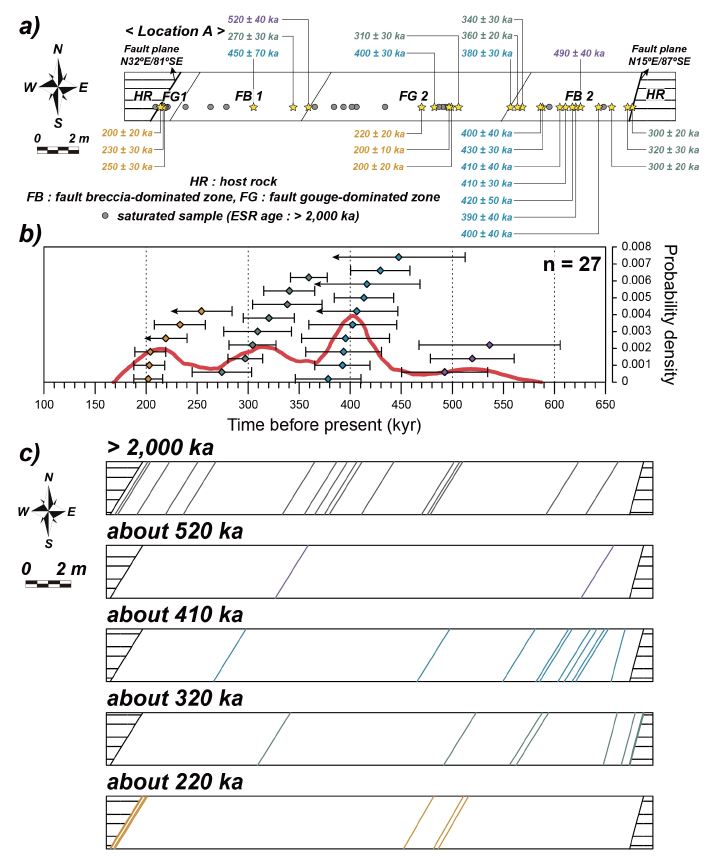
The ESR dates of fault gouge samples collected from location A. (a) Schematic diagram of map view across location A. The yellow/gray symbols represent sampling locations. (b) The red line expresses constructed relative probability distribution (KDE curves; Vermeesch, 2012) for the ESR ages distribution from location A. The ESR ages are plotted as rhombuses with error bars. Each color of the symbol represents the times of fault activity. The staggered vertical positions are for readability and have no bearing on the probability distributions. (c) The space-time pattern of Quaternary fault activity of location A.
A 지점의 단층핵에서는 총 42개의 단층비지 시료와 주변에 발달한 부차단층으로부터 4개의 단층비지 시료를 채취하였다(그림 7a). 이에 대한 ESR 연대측정 결과 19개(41.3%)는 ESR 신호가 포화되어 ESR 연대를 결정할 수 없었다(그림 7a; ESR age : > 2,000 ka). 나머지 27개의 단층비지 시료에 대해 ESR 연대측정법을 통해 결정한 ESR 연대는 제4기에 금왕단층의 일부가 재활동한 것으로, 재활동한 영역은 단층핵의 전체 폭에 비해 극히 일부(수십 cm)에 해당된다. 이 ESR 연대들을 이용하여 KDE 곡선을 작성한 결과, 520, 405, 315, 그리고 218 ka (약 52만 년 전, 약 41만 년 전, 약 32만 년 전 및 약 22만 년 전)에서 곡선의 피크를 보였으며, 이는 이 네 번의 활동시기에 ESR 연대가 집중되어 있음을 의미한다(그림 7b, 7c).
B 지점과 C 지점의 단층핵에서는 총 29개의 단층비지 시료와 주변에 발달한 부차단층으로부터 1개의 단층비지 시료를 채취하였다(그림 8a). 이에 대한 ESR 연대측정 결과 13개(44.8%)는 ESR 신호가 포화되어 ESR 연대를 결정할 수 없었다(ESR age : > 2,000 ka). 나머지 16개의 단층비지 시료에 대해 ESR 연대측정법을 통해 결정한 ESR 연대는 제4기에 금왕단층의 일부가 재활동한 것으로, A 지점과 마찬가지로 재활동한 영역은 매우 좁은 것으로 판단된다. ESR 연대 결과들을 이용하여 KDE 곡선을 작성한 결과, 218 ka에서 피크를 보인다. 노두 상태가 양호한 단층핵 양쪽 경계부 및 내부에서 시료 채취가 주로 이루어져 ESR 연대 자료가 충분하지 않아 A 지점의 단층핵처럼 비교적 양호한 시간·공간적 활동형태를 파악하기는 어려웠다(그림 8b).
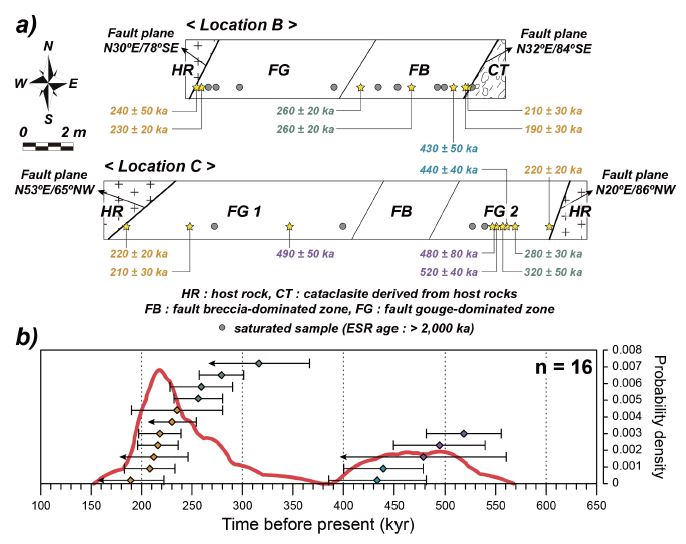
The ESR dates of fault gouge samples collected from locations B and C. (a) Schematic diagram of map view across locations B and C. The yellow/gray symbols represent sampling locations. (b) The red line expresses constructed relative probability distribution (KDE curves; Vermeesch, 2012) for the ESR ages distribution from locations B and C. The ESR ages are plotted as rhombuses with error bars. Each color of the symbol represents the times of fault activity. The staggered vertical positions are for readability and have no bearing on the probability distributions.
6. 토 의
6.1 단층핵의 진화과정
금왕단층대는 압쇄암 계열로 이루어진 금왕연성전단대가 융기 및 침식작용을 거치면서 전단운동에 의해 지하 10 ~ 15 km에서 파쇄암 계열이 중첩되고 1 ~ 4 km에서는 단층비지와 단층각력암으로 이루어진 단층핵이 중첩된 과정을 겪었다(Kim and Lee, 2016). 이번 연구에서 관찰한 세 지점의 단층핵을 구성하고 있는 단층각력암 우세대, 단층비지 우세대와 일부 모암의 잔유물에 발달되어 있는 지질구조들을 관찰하고 이를 근거로 최후기에 형성된 단층핵의 진화과정을 해석하였다. 첫 번째는 좌수향 주향이동 운동이 우세했던 시기(제4기 이전)에 단층비지와 단층각력암으로 이루어진 단층핵이 형성되기 시작하는 단계이다(그림 9a). 융기 및 침식작용을 거쳐 비교적 천부(1 ~ 4 km)에 올라온 단층대 내에 Y-, R-, R’- 및 P-전단 방향의 전단면들 및 인장단열면들이 발달되었다(그림 3a, 9a; Kim and Lee, 2016). 두 번째 단계에서는 여러 방향의 전단단열과 인장단열들이 재활동하거나 새로 형성되면서 단층각력암이 형성되기 시작하였다(그림 9b). 단층각력암은 마찰 각력암화(attrition brecciation) 및 분산 분쇄 각력암화(distributed crush brecciation)에 의해 형성되는데(Sibson, 1986), 노두에서 관찰되는 단층각력암우세대에는 암편들의 원마도가 불량한 부분과 암편들의 원마도가 비교적 양호한 부분이 혼재되어 있다. 단층운동 초기에는 암편들의 원마도가 불량한 단층각력암대가 형성되었으며 후기에 재활동함으로써 암편들의 원마도가 양호해진 것으로 해석된다. 따라서 초기에는 분산 분쇄 각력암화가 우세하였으며 이후에 마찰 각력암화에 의해서 단층핵이 재활동하면서 암편들의 원마도가 양호해진 것으로 해석된다(그림 3d, 5d, 9b, 9c; Sibson, 1986). 이 단계에서는 단층암대 진화양식 Ⅱ의 형태로 기존의 단층대 내부에서 단층핵이 형성된 것으로 해석된다(Means, 1984; Hull, 1988; Mitra, 1992; Lee and Schwarcz, 1996). 단층암대의 진화양식 Ⅱ는 기존에 발달한 단층암대의 내부에서 응력변형연화에 의한 일부 단층암이 띠의 형태로 재활동하는 것을 말하며, 단층암대의 진화양식 Ⅰ은 응력변형경화에 의한 단층암의 형성 또는 재활동이 단층대의 내부가 아닌 경계부에서 일어나서 단층핵의 폭이 증가하는 경향을 보인다(Means, 1984; Hull, 1988; Mitra, 1992; Lee and Schwarcz, 1996). 세 번째 단계에서는 기존에 형성되었던 단층각력암대가 재활동을 겪으면서 단층비지(기질부분)의 양이 증가하여 단층비지 안에 모암의 암편이나 단층각력암 잔유물이 단층비지 내에 떠있는 형태로 분포하고 있다(그림 3d, 5d, 9c). 네 번째 단계에서는 단층이 재활동 함에 따라 암편들의 크기가 작아지고 원마도가 양호해지고 기질의 함량이 점차 증가하여 괴상의 단층비지대로 진화하였다(그림 6d, 6e, 9d; Lee and Kim, 2005). 다섯 번째 단계에서는 다양한 색을 가진 수 mm ~ cm 폭의 단층비지띠들이 Y-전단 방향으로 우세하게 발달하였다(그림 3e, 5e, 9e; Sibson 1986; Scholz, 1988; Choi and Lee, 2020). 전단작용이 진행됨에 따라 각 단층비지띠 내에는 점토광물들의 선택배향에 의한 엽리가 발달되었다. 이러한 엽리는 P-전단면과 평행하게 발달되며 P-엽리면의 방향을 통해 단층비지띠의 운동감각을 파악할 수 있다(Rutter et al., 1986; Passchier and Trouw, 1996). 연구지역에 발달한 P-엽리면들은 반복적인 재활동으로 인해 전단변형이 강해져 Y-전단면과 저각을 갖거나 거의 평행해져 있는데(Ramsay and Huber, 1983), 연구지역에 발달된 단층비지띠들이 좌수향 주향이동 운동에 의해 형성되었음을 지시한다. 마지막 단계인 여섯 번째 단계는 일부 단층비지대에서 단층비지띠로 구성된 엽리들이 불균질한 비동축변형으로 인해 비관통상 습곡인 칼집습곡(sheath fold)으로 변형되는 단계이다(그림 9f; Choi and Lee, 2020). 두 번째 단계에서부터 여섯 번째 단계까지 단층암대 진화양식 Ⅰ의 형태로 재활동하여 경계 단층비지띠가 만들어지면서 단층핵의 폭이 점점 넓어진 것으로 추정된다(Means, 1984; Hull, 1988; Mitra, 1992; Lee and Schwarcz, 1996). 또한 각각의 단계에서 단층핵이 재활동할 때, 단층암대 진화양식 Ⅱ의 형태로 기존의 단층핵 내부에서 단층비지띠들이 Y-, R- 및 P-전단방향으로 형성되거나 재활동한 것으로 추정된다(Means, 1984; Hull, 1988; Mitra, 1992; Lee and Schwarcz, 1996).
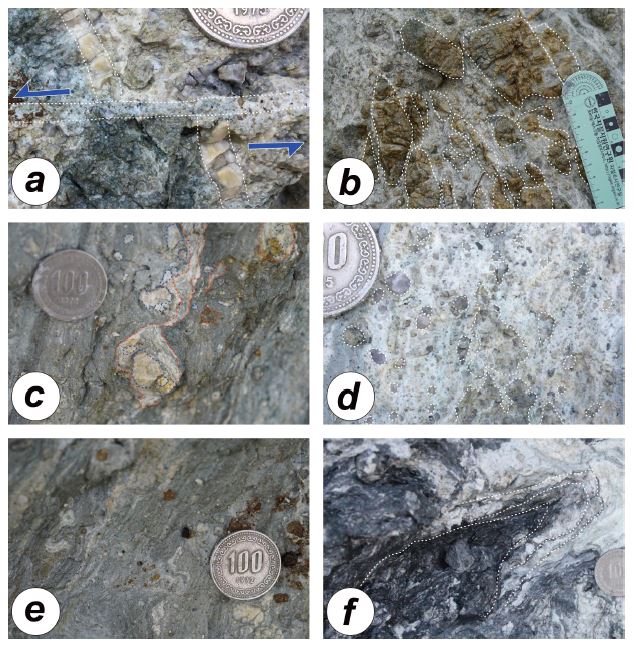
The close-up photographs showing the evolution process of the Keumwang fault core. (a) Quartz vein cut by sinistral fault movement of shear plane. (b) Fault breccia-dominated zone. (c) Relics of older fault breccia (blue line) and older fault gouge (red line) remain within the fault gouge. (d) Massive fault gouge. (e) Foliated fault gouge bands with different colors. (f) Sheath folds are developed by continued shear deformation.
6.2 제4기 단층운동 특성
단층비지의 ESR 연대는 단층비지 시료 채취 지점의 모든 활동이력이 아닌 마지막 활동시기만을 지시하기 때문에 주어진 단층대의 제4기 활동형태를 완전하게 파악하기 어렵다는 문제점이 있다(Lee and Schwarcz, 1996). 또한 약 15만 년 전 이후에 재활동한 단층비지의 ESR 연대는 재활동할 때 단층면에 작용하는 수직응력(약 3 MPa)이 충분하지 않아 ESR 신호를 완전히 0으로 만들지 못해 ESR 연대를 과대평가하게 된다(Kim and Lee, 2020). 금왕단층의 단층핵을 구성하는 단층비지띠들은 다양한 전단 방향으로 발달되어 있으나 그 중 Y-전단방향의 단층비지띠가 가장 우세하며, 각각의 단층비지띠들은 서로 다른 활동시기를 지시할 수 있다. 따라서 단층핵의 활동이력을 면밀히 파악하기 위해, 단층핵을 구성하고 있는 각각의 단층비지띠의 선후관계를 규명하고 각 활동시기를 제한하였다.
연구지역에 발달한 3 지점의 단층핵 및 부차단층으로부터 단층비지 시료 75개(단층핵 71개, 부차단층 4개)를 채취하여 ESR 연대측정을 실시한 결과, 32개의 단층비지 시료는 ESR 신호가 포화되어 연대를 결정할 수 없었다(그림 10a; 전체 시료의 42.7%). 이 단층비지 시료들의 마지막 활동시기는 단층비지의 ESR 연대측정법의 한계를 넘는 약 200만 년 전 이전으로 추정된다. 약 200만 년 전 이전의 ESR 연대를 보이는 시료들은 단층대 폭 전체에 골고루 분포하는 경향이 있어 200만 년 전 이전의 단층핵 폭이 현재의 단층핵의 폭과 비슷할 것으로 해석된다(그림 7c, 10a). 나머지 43개의 단층비지 시료는 ESR 연대측정을 통해 각각의 활동시기를 규명할 수 있었다(그림 10b, 10c, 10d, 10e; 전체 시료의 57.3%).
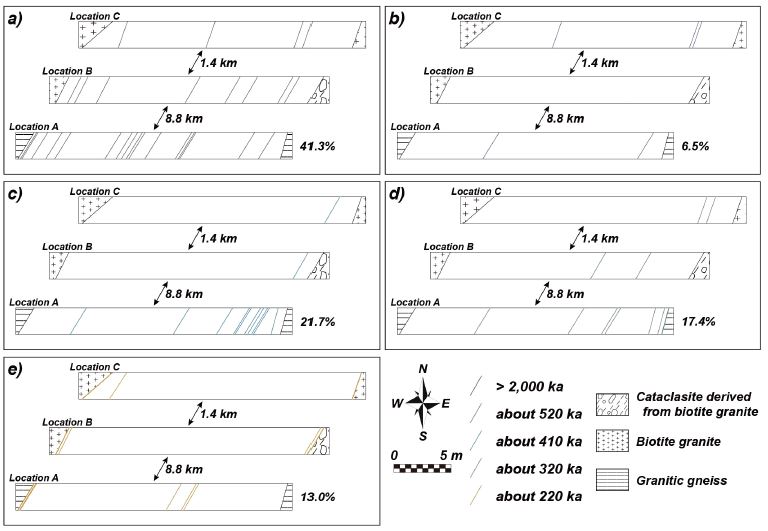
The space-time pattern of Quaternary fault activity of the Keumwang fault zone in the study area during the Quaternary period. (a) Active period : > 2,000 ka. (b) Active period: about 520 ka. (c) Active period: about 410 ka. (d) Active period: about 320 ka. (e) Active period: about 220 ka.
단층핵 A 지점의 경우, 폭이 약 23 m인 단층핵 내에 뚜렷하게 발달한 각각의 단층비지띠로부터 42개의 시료와 단층핵 주변에 발달한 4개의 부차단층으로부터 시료를 채취하였다. 괴상의 단층비지 및 단층각력암에는 좌수향 또는 우수향 전단운동에 의해 형성된 Y-, R-, P-, 및 R’-전단 방향의 단층비지띠들이 중첩되어 있기 때문에 괴상의 단층비지는 이후에 형성된 단층비지띠보다 오래 전에 형성되었을 것으로 판단하여 채취하지 않았다. 또한 단층비지띠 내에 운동감각을 지시하는 지질구조가 거의 관찰되지 않아 시료 채취 지점의 운동감각을 고려하기는 어려웠다. 단층핵 내에 발달한 모든 단층비지띠들을 분석할 수는 없었으나 약 23 m 폭의 단층핵에서 42개의 시료를 분석하였기 때문에 A 지점의 제4기 시간·공간적 활동형태를 해석할 수 있었다(그림 7a). 각 단층비지띠들의 ESR 연대측정 결과들을 종합하여 KDE 곡선을 작성한 결과, 약 52만 년 전, 약 41만 년 전, 약 32만 년 전, 그리고 약 22만 년 전에 KDE피크를 보여 단층핵 A 지점의 제4기 활동형태는 약 10만 년의 주기를 가지며 단층운동이 집중된 것으로 판단된다(그림 7b).
단층비지의 ESR 연대가 단층비지 시료 채취 지점의 마지막 활동시기만을 지시하는 특성 때문에 단층활동 이력이 지워질 가능성이 제일 적은 약 22만 년 전의 KDE피크에서부터 약 32만 년 전, 약 41만 년 전, 약 52만 년 전 순으로 단층핵(약 23 m의 폭)의 공간적 활동형태를 해석하였다. 약 22만 년 전에는 북서쪽 경계 단층비지띠와 북서쪽 경계면을 기준으로 약 13 ~ 14 m 지점에 발달된 단층비지띠에서 재활동한 것으로 해석된다(그림 7c, 10e; 단층핵 A지점에서 채취한 시료의 13.0%). 약 32만 년 전에는 단층핵의 북서쪽 경계면을 기준으로 6.5 m, 14.5 m 및 17.5 m 지점과 남동쪽 경계 단층비지띠에서 재활동했던 것으로 해석된다(그림 7c, 10d; 단층핵 A지점에서 채취한 시료의 17.4%). 단층핵의 남동쪽 경계 단층비지띠는 약 22만 년 전에는 재활동이 없었기 때문에 약 32만 년의 ESR 연대를 보이고 있다. 반면에 단층핵의 북서쪽 경계 단층비지띠는 약 22만 년 전의 단층운동으로 인해 그 이전의 기록이 지워졌기 때문에 같은 위치에서 약 32만 년 전의 단층운동에 대한 기록은 알아낼 수가 없다. 약 41만 년 전에는 단층핵의 내부에서만 단층활동 기록이 남아 있으며, 단층핵의 북서쪽 경계면을 기준으로 4.5 m, 13.5 m, 17 m 및 19 ~ 21 m 지점에서 재활동한 것으로 해석된다(그림 7c, 10c; 단층핵 A지점에서 채취한 시료의 21.7%). 특히 19 ~ 21 m 지점에 많은 시료가 모여 있어 이 부분에서 단층운동이 집중적으로 있었던 것으로 판단된다. 그러나 단층핵 양쪽 경계 단층비지띠들이 각각 약 22만 년 전과 32만 년 전의 기록을 가지고 있기 때문에 약 41만 년 전의 활동 기록은 지워졌을 가능성이 있다. 이후의 단층운동으로 인해 대부분의 기록이 지워졌을 가능성이 높은 약 52만 년 전에는 단층핵의 북서쪽 경계면을 기준으로 7 m 및 20.5 m 지점에서 재활동이 있었던 것으로 해석된다(그림 7c, 10b; 단층핵 A지점에서 채취한 시료의 6.5%). 각각의 활동시기에 경계 단층비지띠와 단층핵 내부의 단층비지띠들이 동시기에 활동했으며, 특히 남동부 경계부에 가까운 내부에서 더 우세하게 활동했음을 위의 분석 자료로부터 파악할 수 있다.
단층핵 B 지점과 C 지점은 단층핵 A 지점과는 달리 단층핵이 완전하게 드러나지 않아 단층핵 내부의 공간적 활동 형태를 파악하기 위한 충분한 수의 단층비지 시료를 채취할 수 없었으며 금왕단층대의 주향방향으로의 공간적 활동형태를 파악하는데 이용하였다. B 지점의 단층핵 폭은 약 11 m, C 지점의 단층핵 폭은 약 17 m이나 A 지점의 단층핵과 가시적으로 대비하기 위해 약 23 m 폭으로 표준화 한 후 공간적 활동형태를 분석하였다(그림 10). 약 22만 년 전에 단층핵 A 지점의 북서쪽 경계 단층비지띠와 내부의 단층비지띠들, 단층핵 B 지점의 양쪽 경계 단층비지띠, 단층핵 C 지점의 양쪽 경계 단층비지띠와 북서쪽 경계면을 기준으로 2.5 m 지점의 단층비지띠가 재활동한 것으로 판단된다(그림 10e). 약 22만 년 전에는 연구지역에 분포하는 단층핵의 북서쪽 경계 단층비지띠가 모두 재활동하였으며, 단층대의 주향방향으로 연구지역보다 북동쪽 및 남서쪽으로 더 연장되어 있는 단층핵에서도 활동했을 가능성이 있다. 단층핵 남동쪽 경계 단층비지띠는 B 및 C 지점과 금왕단층의 주향방향으로의 북쪽연장에서 재활동 했을 가능성이 높다. 약 22만 년 전 이전의 ESR 기록은 단층핵 B 및 C지점의 내부에 부분적으로 남아있다 (그림 10).
연구지역에서 획득한 ESR 자료를 바탕으로 시간-공간적 활동형태를 분석한 결과, 제4기 이전에 형성된 금왕단층의 단층핵이 제4기에도 지속적으로 재활동하고 있다는 것으로 해석된다. 금왕단층대는 제4기 이후에 우수향 주향이동 단층운동이 우세한 것으로 보고된 바 있다(Kim and Lee, 2016; Weon and Lee, 2018; Choi and Lee, 2020). 단층암대 진화양식 Ⅰ의 형태로 단층핵의 양쪽 경계부에서 단층비지띠들이 발달하여 재활동하면서 단층핵의 폭이 수 cm 내지 수십 cm 정도 넓어졌을 가능성이 있다(그림 10d, 10e; Means, 1984; Hull, 1988; Mitra, 1992; Lee and Schwarcz, 1996). 또한 각각의 활동시기에 단층핵 내부의 일부 단층비지띠에서 진화양식 Ⅱ의 형태로 그 이전의 ESR 기록들을 지우면서 재활동이 일어났을 것으로 해석된다(그림 10; Means, 1984; Hull,1988; Mitra, 1992; Lee and Schwarcz, 1996).
7. 결 론
강원도 인제군 일대에 발달한 금왕단층의 단층핵에 대한 연구결과는 다음과 같다.
첫째, 연구지역에 발달한 금왕단층대의 단층핵은 단층비지의 함량이 높은 단층비지 우세대와 단층각력암의 함량이 높은 단층각력암 우세대가 교호하며 분포하고 있다. 전단변형작용은 단층각력암대보다는 단층비지대에 집중적으로 발생한 것으로 판단되며, 점토광물의 선택배향에 의해 형성된 P-엽리가 발달된 Y-전단 방향의 단층비지띠가 우세하게 발달되어 있다.
둘째, 단층핵의 진화과정은 다음과 같다. 1) 제4기 이전에 좌수향 주향이동 운동이 우세했던 시기에 융기 및 침식작용으로 인해 1 ~ 4 km까지 올라온 단층대 내에 다양한 방향의 전단면 및 단열면들이 발달하였다. 2) 초기의 분산 분쇄 각력암화 이후에 마찰 각력암화가 우세해지면서 암편들의 원마도가 비교적 양호해지고 암편 사이에 단층비지들이 채우고 있는 단층각력암대가 형성되었다. 3) 단층각력암대가 재활동하면서 단층비지의 양이 증가하고 단층비지 내에 암편과 단층각력암 잔유물들이 떠있는 형태로 진화하였다. 4) 단층비지 내 암편들의 크기가 작아지고 원마도가 양호해지면서 기질의 함량이 증가하여 괴상의 단층비지대가 발달하였다. 5) Y-전단 방향을 가지는 수 mm ~ cm 두께의 단층비지띠들이 괴상의 단층비지에 중첩되었다. 6) 계속된 전단작용으로 단층핵 내에 칼집습곡이 발달하였다.
셋째, 단층핵 3지점에 대한 단층비지의 ESR 연대측정 분석 결과, 연구지역에 발달한 금왕단층대의 제4기 활동형태는 약 52만 년 전, 약 41만 년 전, 약 32만 년 전 및 약 22만 년 전에 약 10만 년의 주기를 가지며 집중적으로 단층운동이 있었던 것으로 판단된다.
넷째, 각각의 활동시기에 단층핵의 경계 단층비지띠와 수십 m 폭을 가지는 단층핵 내부에 발달된 단층비지띠들이 동시기에 재활동하였다(단층핵 내부에서의 공간적 활동 형태).
다섯째, 약 22만 년 전에는 최소 10.2 km 연장을 가지는 단층핵의 북서쪽 경계 단층비지띠들이 동시기에 재활동하였으며, B 및 C지점의 남동쪽 경계 단층비지띠는 재활동하였으나 A 지점의 경계 단층비지띠는 재활동하지 않았다(주향방향 연장에서의 공간적 활동 형태).
Acknowledgments
이 연구는 행정안정부 행정안전부 지진위험분석 및 관리기술 개발사업의 지원을 받아 수행된 연구임(2022-MOIS62-001). 이 논문은 기상청 기상·지진 See-At기술개발연구(KMI2018-02010)의 지원을 받아 수행된 연구입니다. 심사과정에서 건설적인 조언으로 세심한 검토로 이 논문의 질을 향상시켜주신 익명의 두 심사위원님께 감사드립니다.
References
- Ariyama, T., 1985, Conditions of resetting the ESR clock during faulting. ESR dating and Dosimetry (edited by Ikeya, M. and MiKi, T.), Ionics, Tokyo, p. 249-256.
-
Bae, H.K. and Lee, H.K., 2014, Space-time patterns of fault activity of the Keumwang Fault developed in the Jincheon-Eumseong-gun, Chungcheongbuk-do. Journal of the Geological Society of Korea, 50, 735-752 (in Korean with English abstract).
[https://doi.org/10.14770/jgsk.2014.50.6.735]

- Beanland, S. and Clark, M.M., 1994, The Owens Valley fault zone, eastern California, and surface faulting associated with the 1872 earthquake. U.S. Geological Survey Bulletin, p. 29.
-
Berthe, D., Choukroune, P. and Jegouzo, P., 1979, Orthogneiss, mylonite and non coaxial deformation of granites: the example of the South Armorican Shear Zone. Journal of Structural Geology, 1, 31-42.
[https://doi.org/10.1016/0191-8141(79)90019-1]

- Cheong, D.K. and Kim, K.H., 1999, Basin evolution and provenance of sediments of the Cretaceous Poongam sedimentary Basin. Journal of the Petrological Society of Korea, 7, 28-34 (in Korean with English abstract).
-
Chester, F.M. and Logan, J.M., 1986, Implication for mechanical properties of brittle faults from observations of the Punchbowl fault zone, California. Pure and Applied Geophysics, 124, 79-106.
[https://doi.org/10.1007/BF00875720]

-
Chester, F.M. and Logan, J.M., 1987, Composite planar fabric of gouge from the Punchbowl Fault, California. Journal of Structural Geology, 9, 621-634.
[https://doi.org/10.1016/0191-8141(87)90147-7]

-
Choi, J.M. and Lee, H.K., 2020, Evolution and space-time activity patterns of the Keumwang fault at Girin-myeon, Inje-gun, Gangwon-do. Journal of the Geological Society of Korea, 56, 425-452 (in Korean with English abstract).
[https://doi.org/10.14770/jgsk.2020.56.4.425]

- Choi, P.Y. and Choi, Y.S., 2007, Stress model of the opening of the Cretaceous Eumseong basin. Korea Institute of Geoscience and Mineral Resources Bulletin, 11, 3-16.
- Choi, S.J., Jeon, J.S., Song, K.Y., Kim, H.C., Kim, Y.H., Choi, P.Y., Choi, W.C., Han, J.G., Ryoo, C.R., Sun, C.G., Jun, M.S., Kim, G.Y., Kim, Y.B., Lee, H.J., Shin, J.S., Lee, Y.S., Gi, W.S., Lee, H.K., Song, Y.G., Kim, Y.S., Kang, T.S., Hong, D.G. and Kim, S.K., 2012, Active Fault Map and Seismic Harzard Map. Natural Hazards Mitigation Research Group, National Emergency Management Agency.
-
Fossen, H., 2010, Structural Geology. Cambridge University Press, p. 157, 276, 302.
[https://doi.org/10.1017/CBO9780511777806]

-
Grün, R., 1989, Electron Spin Resonance (ESR) dating. Quaternary International, 1, 65-109.
[https://doi.org/10.1016/1040-6182(89)90010-4]

-
Grün, R., 1992, Remarks on ESR dating of fault movements. Journal of the Geological Society, 149, 261-264.
[https://doi.org/10.1144/gsjgs.149.2.0261]

- Hong, N.R., 2013, Structural features and movement history of the Keumwang Fault at Hongcheon-gun, Kangwon-do, Korea. M.S. thesis, Kangwon National University, Chuncheon (in Korean with English abstract).
- Hong, N.R. and Lee, H.K., 2012, Structural features and ESR dating of the Keumwang fault at Eumseong-gun, Chungcheongbuk-do. Journal of the Geological Society of Korea, 48, 473-489 (in Korean with English abstract).
-
Hull, J., 1988, Thickness-displacement relationships for deformation zones. Journal of Structural Geology, 10, 431-435.
[https://doi.org/10.1016/0191-8141(88)90020-X]

-
Ikeya, M., Miki, T. and Tanaka, K., 1982, Dating of a fault by Electron Spin Resonance on intrafault materials. Science, 215, 1392-1393.
[https://doi.org/10.1126/science.215.4538.1392]

- Ito, T. and Swada, S., 1985, Reliable, Criteria for selection of sampling points for ESR Fault dating. ESR dating and Dosimetry (edited by Ikeya, M. and MiKi, T.), Ionics, Tokyo.
- Jang, B.G. and Lee, H.K., 2012, Structural features of fault rocks developed in the Keumwang Fault at Hakgok-ri, Hoengseong-gun, Ganwon-do. Journal of the Geological Society of Korea, 48, 11-26 (in Korean with English abstract).
- Kee, W.S., Kim, H.C., Kim, B.C., Choi, S.J., Park, S.I. and Hwang, S.K., 2010, Geological report of the Seoraksan sheet (1:50,000). Korea Institute of Energy and Resources, p. 58 (in Korean with English abstract).
- Kim, B.K., Chi, J.M., Lee, D.Y. and So, C.S., 1975, Geological report of the Hyeon Ri sheet (1:50,000). Korea Institute of Energy and Resources, p. 21-27 (in Korean with English abstract).
- Kim, J.Y., Yang, D.Y., Choi, W.H. and Kim, J.C., 2006, Estimation of uplift rate based on Morphostratigraphy and Chronology of Coastal terraces in the SE part of Korean peninsula. The Korean journal of Quaternary research, 20, 51-57.
- Kim, M.J., 2018, Activity features of the Keumwang Fault in the Inje-gun area, Gangwon-do. M.S. thesis, Kangwon National University, Chuncheon (in Korean with English abstract).
-
Kim, M.J. and Lee, H.K., 2016, Internal structure and movement history of the Keumwang Fault. The Journal of the Petrological Society of Korea, 25, 211-230 (in Korean with English abstract).
[https://doi.org/10.7854/JPSK.2016.25.3.211]

-
Kim, M.J. and Lee, H.K., 2017, Quaternary activity patterns of the Keumwang Fault in the Wonju-si area, Gangwon-do. Journal of the Geological Society of Korea, 53, 79-94 (in Korean with English abstract).
[https://doi.org/10.14770/jgsk.2017.53.1.79]

-
Kim, M.J. and Lee, H.K., 2020, ESR dating of fault gouge-review. Journal of the Geological Society of Korea, 56, 211-234 (in Korean with English abstract).
[https://doi.org/10.14770/jgsk.2020.56.2.211]

-
Kim, M.J. and Lee, H.K., 2022, Long-term pattern of earthquakes caused by climate change across the Korean peninsula. Tectonophycis, submitted.
[https://doi.org/10.2139/ssrn.4272500]

- Kim, W.K., Won, J.S. and Kim, S.W., 1996, A Technique Assessing Geological Lineaments Using Remotely Sensed Data and DEM : Euiseong Area, Kyungsang Basin. Journal of the Korean society of Remote Sensing, 12, 139-154 (in Korean with English abstract).
-
Kim, Y.S., Kim, T.H., Kyung, J.B., Cho, C.S., Choi, J.H. and Choi, C.U., 2017, Preliminary study on rupture mechanism of the 9.12 Gyeongju Earthquake. Journal of the Geological Society of Korea, 53, 407-422 (in Korean with English abstract).
[https://doi.org/10.14770/jgsk.2017.53.3.407]

- Korea Institute of Geoscience and Mineral Resources (KIGAM), 2019, Tectonic map of Korea (1:1,000,000 scale). Korea Institute of Geoscience and Mineral Resources.
- Lee, H.K., 1995, ESR Plateau Dating of Fault Rocks. Ph.D. thesis, McMaster University, Hamilton, Ontario.
- Lee, H.K., 1999, ESR dating and structural analysis of the Dangok fault zone in the Mungok region, Jeongsongun, Kangwon-do. Journal of the Geologial Society of Korea, 35, 85-98 (in Korean with English abstract).
- Lee, H.K., 2010, Structural features of the Keumwang fault zone at Sangnam-myon, Inje-gun, Gangwon-do. Journal of the Geological Society of Korea, 46, 561-576 (in Korean with English abstract).
-
Lee, H.K. and Kim, H.S., 2005, Comparison of structural features of the fault zone developed at different protoliths: crystalline rocks and mudrocks. Journal of Structural Geology, 27, 2099-2112.
[https://doi.org/10.1016/j.jsg.2005.06.012]

- Lee, H.K. and Kim, J.Y., 2011, Microstructural features within the fault rocks in the Keumwang fault zone at Sangsam-myon, Inje-gun, Gangwon-do. Journal of the Geological Society of Korea, 47, 395-409 (in Korean with English abstract).
-
Lee, H.K. and Schwarcz, H.P., 1993, An experimental study of shear-induced zeroing of ESR signals in quartz. Applied Radiation and Isotopes, 44, 191-195.
[https://doi.org/10.1016/0969-8043(93)90218-Y]

- Lee, H.K. and Schwarcz, H.P., 1996, Electron spin resonance plateau dating of periodicity of activity on the San Gabriel fault zone, Southern California. Journal of Geological Society of America Bulletin, 108, 735-746.
-
Lee, H.K. and Schwarcz, H.P., 2000, ESR Dating of Times of Movement on the San Gabriel Fault in the Little Tujunga Region, Los Angeles, California. AGU Reference Shelf 4; Quaternary Geochronology : Methods and Applications, Washington, DC, 553-556.
[https://doi.org/10.1029/RF004p0553]

-
Lee, H.K. and Schwarcz, H.P., 2001, ESR dating of the subsidiary faults in the Yangsan fault system, Korea. Journal of Quaternary Science Review, 20, 999-1003.
[https://doi.org/10.1016/S0277-3791(00)00055-X]

-
Lee, H.K. and Yang, J.S., 2003, ESR dating of the Wangsan fault, South Korea. Quaternary Science Reviews, 22, 1339-1343.
[https://doi.org/10.1016/S0277-3791(03)00018-0]

- Lee, M.B. and Kim, N.S., 2002, Analysis of tectonic lineament using Hough transformation and hillshading relief in Chugaryeong rift valley, central Korea. Journal of the Geological Society of Korea, 38, 457-469 (in Korean with English abstract).
- Logan, J.M., 1979, Experimental studies of simulated gouge and their application to studies of natural fault zones. In Proceedings of conference Ⅷ-analysis of actual fault zones in bedrock, 305-343.
- Means, W.D., 1984, Shear zones of type Ⅰ and Ⅱ and their significance for reconstruction of rock history. Geological Society of America Abstracts with Programs, 16, 50.
- Min, G.H., 2020, Structural features and activity patterns of the Keumwang Fatul developed in the Saenggeuk-myeon and Gamgok-myeon, Eumseong-gun, Chungcheongbuk-do. M.S. thesis, Kangwon National University, Chuncheon (in Korean with English abstract).
- Mitra, G., 1992, Deformation of granitic basement rocks along fault zones at shallow to intermediate crustal levels. In: Mitra, S., and Fisher G.W. (eds.), Structural Geology of Fold and Thrust Belts, The Johns Hopkins university Press.
- Park, J.R. and Lee, H.K., 2012, Internal structure and microstructural features of Keumwang fault zone at Jwaun-ri, Hongcheon-gun, Gangwon-do. Journal of the Geological Society of Korea, 48, 27-47 (in Korean with English abstract).
- Oh, J.S. and Kim, D.E., 2019, Lineament Extraction and Its Comparison Using DEMs based on LiDAR, Digital Topographic Map, and Aerial Photo in the Central Segment of Yangsan Fault. The Korean Geographical Society, 54, 507-525 (in Korean with English abstract).
- Passchier, C.W. and Trouw, R.A.J., 1996, Micro-tectonics. Springer, Germany, p. 289.
- Ramsay, J.G. and Huber, M.I., 1983, The Techniques of Modern Structural Geology: Strain Analyses. Academic Press, London.
-
Rutter, E.H., Maddock, R.H., Hall, S.H. and White, S.H., 1986, Comparative microstructures of natural and experimentally produced clay-bearing fault gouges. Pure and Applied Geophysics, 124, 3-30.
[https://doi.org/10.1007/BF00875717]

-
Scholz, C.H., 1988, The brittle-plastic transition and the depth of seismic faulting. Geologische Rundschau, 77, 319-328.
[https://doi.org/10.1007/BF01848693]

-
Schulz, S.E. and Evans, J.P., 2000, Mesoscopic structure of the Punchbowl Fault, Southern California and the geologic and geophysical structure of active strike-slip fault. Journal of Structural Geology, 22, 913-930.
[https://doi.org/10.1016/S0191-8141(00)00019-5]

-
Schwarcz, H.P. and Lee, H.K., 2000, Electron Spin Resonance Dating of Fault Rocks. AGU Reference Shelf 4; Quaternary Geochronology : Methods and Applications, Washington, DC, 177-186.
[https://doi.org/10.1029/RF004p0177]

-
Sibson, R.H., 1977, Fault rocks and fault mechanisms. Journal of the Geological Society, 133, 191-213.
[https://doi.org/10.1144/gsjgs.133.3.0191]

-
Sibson, R.H., 1986, Brecciation processes in fault zones: inferences from earthquake rupturing. Pure and Applied Geophysics, 124, 159-175.
[https://doi.org/10.1007/BF00875724]

-
Synn, J.H., Park, C. and Lee, B.J., 2013, Regional Distribution Pattern and Geo-historical Transition of In-situ Stress Fields in the Korean Peninsula. Tunnel & Underground space, 23, 457-469 (in Korean with English abstract).
[https://doi.org/10.7474/TUS.2013.23.6.457]

- Tanaka, K., 1990, Dating of fault movement by the ESR method; basis and application. Ph.D. Thesis, Kyushu university, Japan.
-
Vermeesch, P., 2012, On the visualization of detrital age distributions. Chemical Geology, 312-313, 190-194.
[https://doi.org/10.1016/j.chemgeo.2012.04.021]

-
Weon, H.J. and Lee, H.K., 2018, ESR age and characteristic features of the Keumwang Fault developed in the Ssangjeong-ri, Eumseong-gun, Chungcheongbuk-do, Korea. Journal of the Geological Society of Korea, 54, 335-357 (in Korean with English abstract).
[https://doi.org/10.14770/jgsk.2018.54.4.335]

- Won, J.S., Kim, S.W., Min, K.D. and Lee, Y.H., 1998, A Development of Automatic Lineament Extraction Algorithm from Landsat TM images for Geological Application. Journal of the Korean Society of Remote Sensing, 14, 175-195 (in Korean with English abstract).
- Yang, J.S., 2006, Quaternary fault activity in the southeastern part of the Korean peninsula. Ph.D. thesis, Kangwon National University, Chuncheon (in Korean with English abstract).

