해수면 해양지자기자료의 교차점 오류 보정을 위한 알고리즘 개발: 북서 태평양 지역에 대한 적용 사례
초록
해양지자기자료는 해양지각의 물리적 특성과 판구조운동을 이해하는 데 중요한 역할을 한다. 이 지자기자료를 수집하고 고해상도 해양지자기이상도를 만들기 위해 대표적으로 두 종류의 다른 자기센서가 사용된다. 양성자세차자력계는 선박 뒤에서 견인되며 자기장의 절대 강도를 측정하고, 선상삼성분자력계는 선박의 중심부에 설치되어 유도되는 주변자기장의 변화를 측정한다. 이상도를 만들기 위해 민감도가 높고 자료처리가 단순한 양성자세차자력계로 얻은 자료가 일반적으로 선호된다. 하지만 해양의 넓은 면적에 비해 지자기자료는 많이 부족하기 때문에, 이러한 자료의 공백을 메우기 위해 민감도가 상대적으로 많이 떨어지고 복잡한 보정과정을 거쳐야 하는 선상삼성분자력측정이 여전히 필요하다. Wessel (2010)에 의해 제시된 교차점 오류 평등화보정법을 이용한 교차 오류를 분석한 결과, 대부분의 선상삼성분자료에서 선형적인 변화양상을 가지는 추가적인 오류가 존재함을 발견하였다. 이 연구에서는 교차점에서의 선형회귀분석방법을 통해 이러한 오류를 획기적으로 줄임으로써 향상된 결과를 얻을 수 있었다. 이 오류는 점성자화 또는 잘못된 보정에 의해 만들어진 것으로 향후 향상된 보정과 효과적인 자료의 획득 및 이용을 위해 수치모델제작을 통한 분석이 요구된다.
Abstract
Marine magnetic data play an important role in understanding the physical properties of oceanic crust and tectonic movements. To collect the data, the two different magnetic sources, Proton Precession Magnetometer (PPM) measuring absolute intensity of the magnetic field, while Shipboard Three-Component Magnetometer (STCM) measuring relative variations of three magnetic components, are utilized and applied to make a high-resolution magnetic anomaly map. The PPM data are generally preferred for the data compilation because these are showing high sensitivity and requiring simple data processing. However, due to lack of the data, STCM measurements are still required to fill in the gaps in spite of the complications involved in data correction. After applying the crossover error analysis suggested by Wessel (2010), we found systematic errors showing linear trend from the most of the STCM tracks. In this study, we correct the errors and improve the results by applying a new crossover error analytic method based on linear regression. These errors are generally originated from false correction or viscous magnetization of the vessel. In the future, it is necessary to conduct numerical model analysis for improved correction, efficient data acquisition and use.
Keywords:
marine magnetic anomaly, crossover error analysis, proton precession magnetometer, shipboard three-component magnetometer키워드:
해양지자기이상대, 교차점 오류보정, 양성자세차자력계, 선상삼성분자력계1. 서 론
해양에서 관측된 지자기데이터는 해양지각의 확장 속도와 이동 방향, 그리고 지각의 물성 변화 관측 및 해석에 매우 중요한 역할을 해오고 있다(Lee and Kim, 2002; Choi et al., 2017; Choe and Dyment, 2020b). 하지만 서로 다른 자력센서들을 통해 얻어진 많은 양의 지자기데이터는 센서의 감도와 특성, 측정 방법에 따라 큰 오차를 보인다. 이러한 이유로 지금까지 많은 양의 해양지자기자료가 전 세계적으로 획득되었음에도 불구하고 현재까지 넓은 지역의 고해상도 해양지자기이상도를 쉽게 만들지 못했다.
일반적으로 해양자력탐사에서는 양성자세차자력계(Proton Precession Magnetometer, PPM)과 선상삼성분자력계(Shipboard Three-Component Magneto-meter, STCM)가 주로 쓰인다. PPM으로 획득된 자료는 지자기장의 강도를 매우 민감하게 측정가능하며, 일반적으로 지자기기준모델(International Geomagnetic Reference Field, IGRF; Thébault et al., 2015)을 이용하여 외핵 기원의 지자기장 효과를 제거한 후 즉시 자료로 이용할 수 있다. STCM의 경우, 배 위에서 별도의 조작없이 자료수집이 가능하고 삼성분의 벡터자료를 측정할 수 있다는 장점을 갖고 있는 반면, 배의 유도자화에 의한 영향을 크게 받고 민감도가 떨어진다는 큰 단점을 가지고 있다(Isezaki, 1986; Korenaga, 1995). 여기서 배의 움직임과 유도자기장 그리고 영구잔류자기장의 영향은 Isezaki (1986)의 방법론을 이용하여 소거할 수 있다. 하지만 이러한 보정에도 불구하고 여전히 남아있는 보정되지 않은 또다른 배의 점성자화와 같은 성분은 지금까지 보정할 수 없어 STCM 자료의 사용에 큰 제한을 주고 있다.
천문학적인 해양탐사비용을 절감시키고 자력이상도의 오차를 줄여 자력탐사자료의 가용성을 높이기 위한 다양한 교차점 분석 및 보정 방법이 고안되었다(e.g., Wessel, 2010; Ishihara, 2015). 이러한 교차점 분석들은 일반적으로 고해상도 그리고 잡음이 매우 적은 PPM으로 획득된 자력탐사자료들의 교차점을 분석하는 방법론으로 측선 자료의 교차점에서의 평균값을 계산하여 각각의 측선의 y축 절편을 조절하여 교차점오류를 줄이는 방식이었다. 이와 같이 PPM자료를 이용하여 지도를 만드는 것이 가장 이상적인 방법이지만 여전히 부족한 탐사자료로 지도제작이 매우 제한적이다.
앞서 언급한 바와 같이, 지자기장 이외에 다양한 정보를 포함하고 있고 민감도가 상대적으로 매우 낮은 STCM 자료의 경우, 그러한 단점들로 인한 낮은 가용성에도 불구하고 기존에 자력탐사 자료획득을 하지 않은 지역에서 정보를 많이 획득해왔기 때문에 그 활용 가치는 여전히 매우 높다. 하지만 PPM 자료에 기반한 기존의 교차점 오류보정법으로 STCM 자료를 보정하는 것은 실질적으로 적합하지 않기 때문에 두 자료를 함께 이용하여 넓은 지역의 고해상도 자기이상도를 만든 사례는 현재까지 없다.
본 연구에서는 서태평양에서 광범위하게 획득된 PPM자료와 STCM자료의 가용성을 더 높이기 위해 교차점 보정 알고리즘을 소개하고 보정 결과와 오차 값이 갖는 의미를 분석 및 논의하고자 한다.
2. 연구방법 및 이론
2.1 해양자력탐사자료의 자료처리
이 연구에서는 미연방해양대기청(NOAA)내 국가환경정보센터(NCEI, https://maps.ngdc.noaa.go/viewers/geophysics/)와 일본해양연구개발기구(JAMSTEC)내 세계해양자료센터(GODAC, http://www.godac.jamstec.go.jp/)에 공개된 자력탐사자료를 이용하였다(그림 1). STCM 자료의 경우 일본해양연구개발기구의 R/V Kairei와 R/V Mirai에서 획득된 자료를 사용하였다. 해양탐사에서 대표적으로 사용되는 PPM 및 STCM 센서는 서로 다른 원리와 방법으로 주변 자기장 값을 측정하므로 각각의 특성에 맞는 자료처리 방식을 적용해야 한다(그림 2).
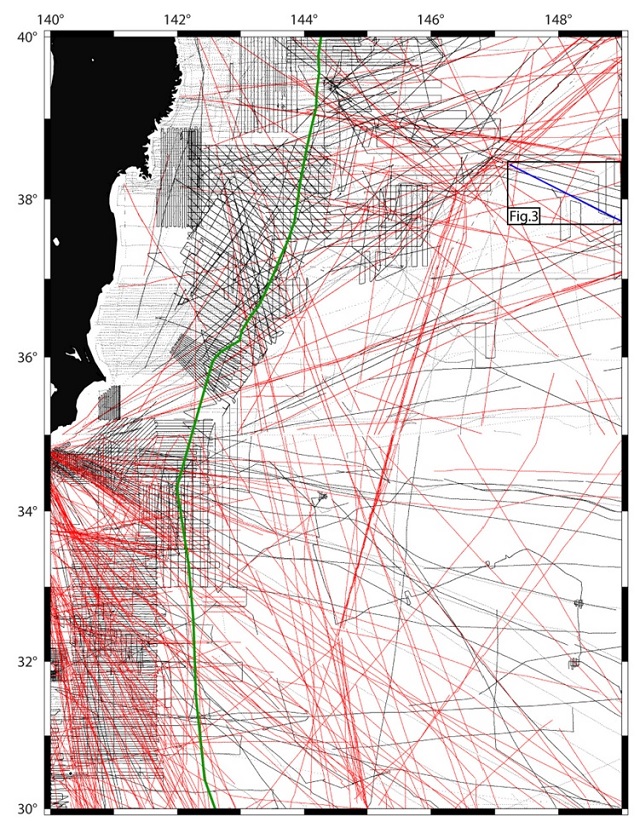
Marine magnetic surveys available in the Northwest Pacific. Red solid lines display the STCM survey tracks; black solid lines the PPM survey tracks; blue solid line both overlapped PPM and STCM track lines examined at Fig. 3. Green solid line shows the Japan and Izu-Bonin Trench.
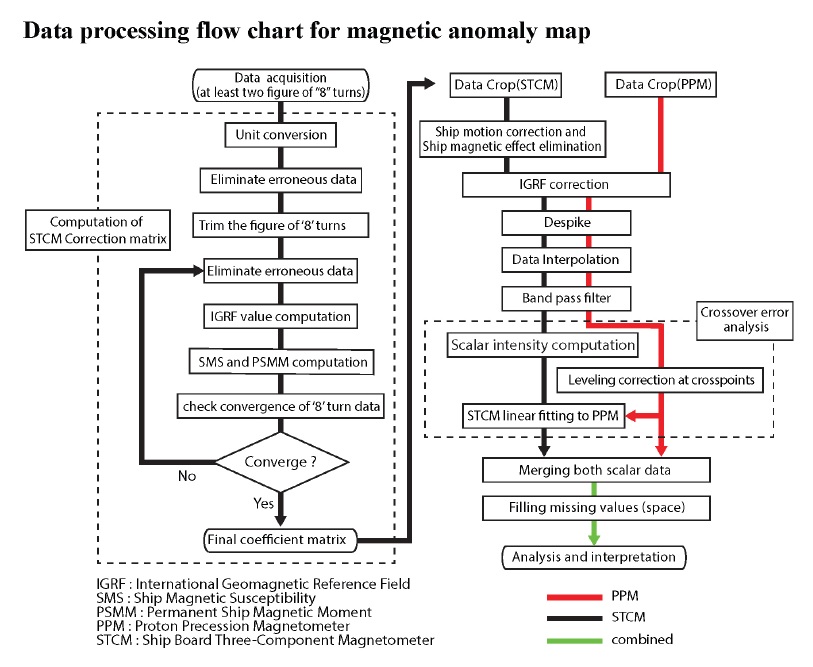
Magnetic data processing flow chart. Black solid line indicates the processing flow of magnetic data collected by shipboard three-component magnetometer, red solid line indicates the processing flow of the data acquired by proton precession magnetometer.
양성자세차자력계 또는 오버하우저자력계는 케로신(kerosene)과 같은 석유계열의 탄화수소 액체에 있는 양성자들이 지자기장 방향으로 배열을 하며 나타나는 세차운동에 의해 생성되는 미세전류를 측정하는 방식으로 자기장의 세기를 측정한다(Hrvoic, 1989). 이 자력계는 고감도 및 고분해능을 갖고 있으며 연구선으로부터 0.2-0.4 km 거리에서 후방견인으로 주변자기장을 측정하기 때문에 외부 자성체의 영향을 받지 않은 채로 자료를 획득한다. 하지만 자기장의 세기, 즉 스칼라 값만 측정할 수 있고 벡터 성분은 측정할 수 없다는 단점을 지니고 있다.
이 자력계로 획득된 자료에는 외핵에서 생성되는 주 지자기장과 이와 관련된 영년변화와 일변화, 태양풍으로 인한 간섭, 그리고 해양지각의 잔류자화와 기타 영향체의 자성으로부터 나타나는 자기장 성분들의 벡터의 합이 기록되어 있다(Hinze et al., 2013). 이 자료로부터 지자기이상을 얻기 위한 가장 좋은 방법은 탐사지역 인근의 고정점에 자력센서를 설치하여 얻은 자료 값을 탐사를 통해 획득된 자료로부터 소거해 주는 것이다. 하지만 대부분의 해양지자기탐사는 육지로부터 멀리 떨어진 넓은 지역을 목표로 탐사가 수행되기 때문에 이와 같은 방법은 그리 유효하지 않다. 따라서 우리는 영년변화와 일변화 같이 시간에 따른 주 자기장의 변화를 IGRF (Thébault et al., 2015, Bigrf)모델을 이용하여 소거해주었다. 그리고 자기폭풍과 같이 외부에서 갑작스럽게 생성된 짧은 파장의 자기장은 잡음으로 간주하여 자료처리에 배제시켰다. 여기서 ΔB: 지자기이상, Braw: 관측데이터를 나타낸다.
선상삼성분자력계는 3개의 직교 플럭스게이트 자력센서로 이루어져있으며 주변자기장의 상대적인 변화에 따른 미세전류변화를 감지하여 자기장의 벡터성분을 측정한다(Primdahl, 1979). PPM에 비하여 낮은 감도, 낮은 분해능으로 자료를 수집한다는 단점이 있지만, 가격이 저렴하고 연구선에 설치해 놓으면 별도의 조작없이 항해 중에 언제든지 자료를 수집할 수 있으며, 후방견인을 할 수 없는 극한 환경에서도 지자기장의 3축성분을 알아낼 수 있다는 큰 장점이 있다(Isezaki, 1986; Nogi and Kaminuma, 1999). 하지만 이 자력계는 주변 지자기장 벡터()뿐 만 아니라 철제선박의 강한 유도자기장(Hi) 및 영구자기장(Hp)의 영향을 받기 때문에 지자기이상을 얻기 위해서는 복잡한 계산이 필요하다. Isezaki (1986)에서 제시한 STCM 자료처리과정을 선형대수로 아래와 같이 풀이하였다.
관측된 STCM 자료는 아래와 같이 표현할 수 있다. 여기서 Hobs는 센서에서 관측된 주변 자기장 합의 삼성분 벡터를 나타낸다.
| (1) |
여기서 배의 유도자기장(Hi)는 아래와 같이 표현할 수 있다.
| (2) |
여기서 C는 배의 대자율텐서이고 3×3 행렬로 표현된다. 관측된 지자기장 벡터 F는 배의 움직임인 회전(R), 상하 이동(P), 편향(Y)에 따라 바뀌기 때문에 이를 보정하기 위하여 3×3 회전변환행렬을 곱해 주어야 한다.
따라서 관측된 STCM 자료는 아래와 같이 유도될 수 있다.
| (3) |
여기서 우리가 알고 있는 값은 Hobs, RPY, F이고 보다 쉬운 계산을 위해 (C+1)를 C로 표현하였다.
따라서
| (4) |
우리가 구하려는 대자율텐서 C와 배의 영구자기장 Hp는 아래와 같이 표현할 수 있다.
| (5) |
시간에 따라 관측되는 Hobs와 RPYF는 아래와 같이 간단히 표현될 수 있다.
| (6) |
방정식 (4)는 AX=Hobs 그리고 AX-Hobs=0으로 다시 간략하게 쓸 수 있다. 우리는 대자율텐서(C)와 배의 영구자기장(Hp)를 결합한 3×4 계수 행렬(X) 을 선형 방정식의 최소제곱법으로 풀어 계산할 수 있다.
| (7) |
Hpk(k=x,y,z)는 상수이므로 RPYF 행렬은 아래(8)과 같이 표현될 수 있다.
| (8) |
하지만 A는 정방행렬이 아니므로 역행렬이 존재할 수 없다. 따라서 X행렬을 계산하기 위해서 아래와 같이 의사역행렬(pseudo inverse, pinv)을 적용하였다.
| (9) |
배의 자성효과 제거를 위해 실시되는 배의 8자턴으로부터 얻어진 상수행렬 X를 이용하여 아래와 같이 지자기 벡터 이상대를 계산할 수 있다.
| (10) |
STCM 자료는 보정 후에도 PPM 자료에 비해 상대적으로 짧은 파장의 잡음이 많이 존재하고(König, 2006; Engels et al., 2008), 아직까지 보정할 수 없는 점성자화와 같은 긴 파장의 잡음이 존재하여 지자기이상도를 제작하는데 직접적으로 사용하기가 어렵다(Nogi and Kaminuma, 1999; Lee and Kim, 2004).
2.2 탐사자료의 교차점보정
PPM 자료는 일반적으로 배와 같은 외부자성에 대한 효과가 없는 조건 하에 획득되기 때문에 Wessel (2010)의 X2SYS 프로그램을 이용하여 교차점에서의 평등화 보정(leveling correction)으로 쉽게 보정할 수 있다. 하지만 STCM의 경우 배의 점성자화와 같은 성분이 남아있어서 평등화 보정 방법으로는 보정이 힘들다. 일반적으로 자철석 및 산화철의 점성자화(viscous magnetization)는 상온에서 대수시간척도(logarithmic time scale)에 비례하며 증가한다(Dunlop, 1989). 배가 한방향으로 움직이다가 방위각을 변경할 경우 배의 자기방향(magnetic orientation)이 변경되면서 초기 수 분 동안 점성자화가 나타나게 되며 이후 안정화된다(Lee and Kim, 2004). 하지만 지속적인 항해로 지자기장의 강도가 바뀌기 때문에 지자기 이상은 그림 3a와 같이 지속적으로 점성자화의 영향을 받아 선형 경향성의 오차를 갖게 된다. 이러한 특성을 이해하고 아래와 같은 알고리즘으로 STCM 자료의 교차점 보정을 진행하였다.
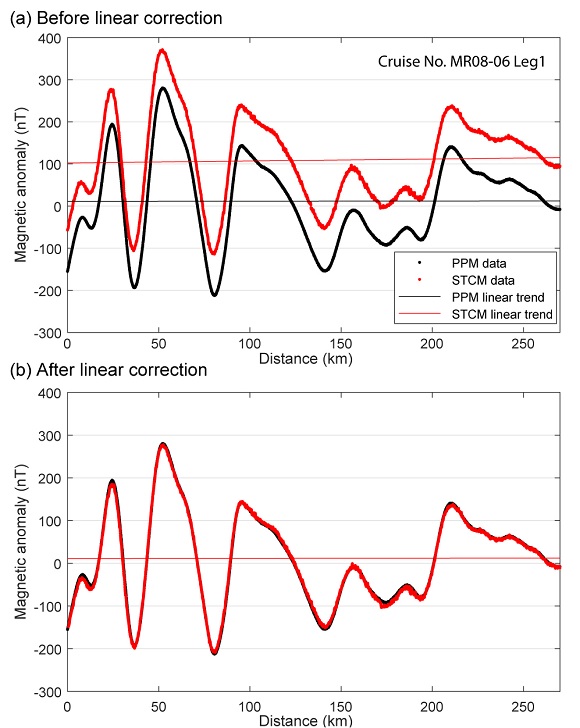
Comparison of before and after applying the newly proposed of crossover method. The method is applied to adjust the linear trend of the STCM data to the PPM data.
1) STCM 자료의 전체 조사측선 중 직선으로 이루어진 구간을 분류 및 추출해내고, 방위각의 변경에 의한 초기 점성자화의 영향을 배제하기 위해 조사측선의 첫머리 5-10 km를 제거한다.
2) 전체 보정된 PPM 자료와 전처리된 STCM의 한 측선 사이의 교차점들을 Hsu (1995)에서 사용한 방법을 통해 구하고, 교차점 반경 1 아크분(arc-minute) 내 자료들은 변화가 거의 없어야 하기 때문에 동일 값으로 간주하여 평균화한다. 이때 교차점이 3개 이상일 경우, 그리고 한 직선에서 첫번째 교차점과 마지막 교차점의 거리가 30 km 미만일 경우 측선자료의 단파장 잡음의 영향으로 인해 오차가 크게 발생할 수 있으므로 분석에서 제외시킨다.
3) 전처리된 STCM 측선의 시작점을 기점으로 교차점들의 거리를 구한다.
4) x축을 첫번째 교차점에서부터 거리(방정식 11에서 행렬 A), y축을 지자기 측정값(방정식 11에서 행렬 Bobs)으로 놓고, 각각 PPM 교차점들과 STCM 교차점들 간의 선형연립방정식에서 의사역행렬(pinv)을 이용한 최소제곱법을 통해서 각각의 선형 회귀의 계수를 구한다.
| (11) |
5) 이후 각각의 선형회귀 방정식 fppm(x)와 fstcm(x)를 구하고 두 방정식의 차를 구한다.
| (12) |
6) 그 다음 교차점 보정 전의 STCM 자료 BSTCM에 dF를 빼주면 STCM 자료의 교차점 보정이 완료된다(그림 3b).
| (13) |
실제 PPM 자료와 STCM 자료의 교차점 값을 이용하여 보정한 STCM 지자기이상 곡선을 그림 4에 나타냈다.
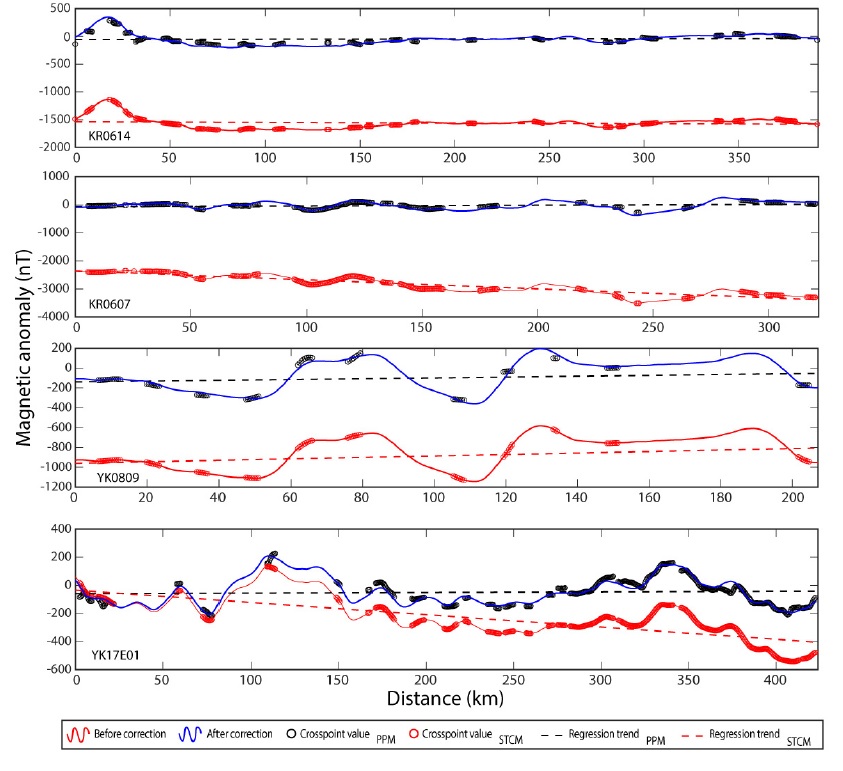
Corrected STCM data using the new crossover analysis method. Red solid line, STCM data affected by the ship viscous magnetization approximated by a linear trend; Red circles, STCM at crossover points; Red dashed line, linear regression of STCM at crossover points; Black circles, PPM at crossover points; Black dashed line, linear regression of PPM at crossover points; Blue solid line, corrected STCM data after removing the linear trend from STCM at crossover points and adding the linear trend on PPM at crossover points.
3. 연구결과
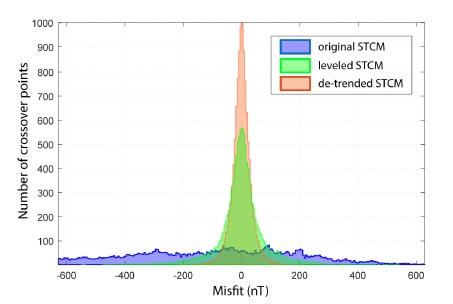
교차점 보정 전의 PPM 자료는 일본해구와 이주-보닌(Izu-Bonin)해구 주변에서 획득되었다(그림 5a). 한편, Isezaki (1986)의 방법론으로 보정된 STCM 자료는 교차점 보정 전 매우 불규칙한 양상을 보이고 있다(그림 5b). 이 연구에서 제시한 교차점보정결과의 유효성을 검증하기 위해 현재 널리 사용되고 있는 기존 교차점보정법 X2SYS (Wessel, 2010)를 이용한 PPM 자료와 STCM 자료의 보정 결과를 그림 5c와 같이 지자기이상도를 통해 나타내었다. 그 결과, STCM 자료에 여전히 남아있는 선형 잡음으로 인하여 보정이 되었음에도 불구하고 곳곳에서 오류 값들이 확인되었다(그림 5c). 한편, 이번 연구를 통해 개발된 교차점 보정법이 적용된 지자기이상도는 그림 5c에서 나타나는 오류가 확연하게 사라진 것을 볼 수 있다. 또한 이 이상도를 이용한 지자기연대 확인결과 M10Nn - M21n에 해당하는 중생대 약 1억 3천만년-1억 4천 4백만년(Nakanishi et al., 1989; Tominaga and Sager, 2010) 사이에 생성된 해양지각으로 일정한 패턴의 뚜렷한 지자기이상대가 나타나고 있다. 또한 해구 인근에서 북북서-남남동 주향방향을 보이는 다수의 파쇄대(fracture zone)가 관측되었으며 현재 태평양판의 섭입으로 인해 해구 방향으로 갈수록 이상대의 진폭이 감소하는 모습을 보이고 있다(그림 5d). 보다 객관적인 자기이상도 오류의 개선 정도를 확인하기 위해 보정 후 교차점에서의 오차를 통계적으로 분석하였다(그림 6). 이때 상자(bin)의 크기는 5 nT 간격에 해당한다. 그 결과 선형경향성을 보정한 교차점 오류보정에서의 오차가 기존의 평등화법을 이용하였을 때보다 0에 더 가깝게 수렴할 뿐 아니라, 교차점 평등화법 적용자료 및 선형경향성 보정자료에서 각각 68.9 nT, 49.2 nT의 표준편차(1σ) 값을 나타내는 것으로 볼 때, 새로운 보정법을 이용한 자료 처리가 기존의 방법에 비해 유의미한 효과를 보인다고 할 수 있다.
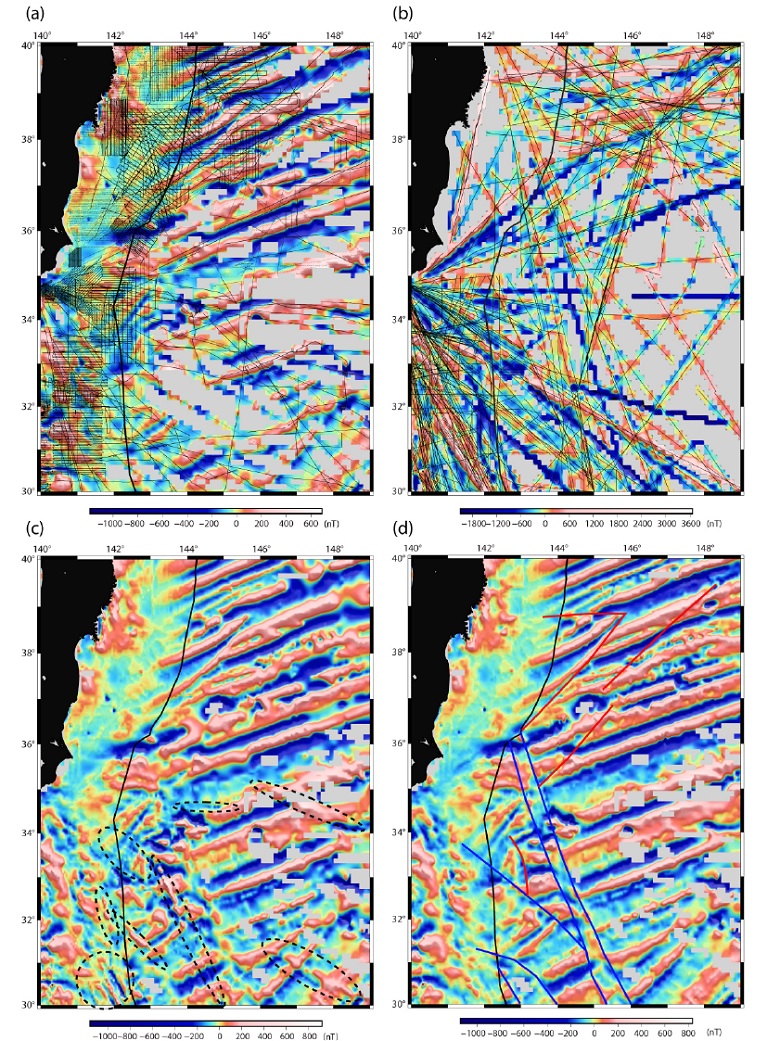
Comparison of the magnetic anomaly maps in the Western Pacific. (a) Magnetic anomaly grid from the leveled PPM data, (b) Magnetic anomaly grid from the corrected STCM data, (c) Magnetic anomaly grid after leveling the corrected STCM data to adjust them to the leveled PPM data. Dashed circles indicate remaining linear trend errors, (d) Magnetic anomaly grid after leveling and de-trending the corrected STCM data to adjust them to the leveled PPM data. Blue solid lines describe estimated fracture zones; red solid lines show estimated propagators.
4. 배의 점성자화
보정 후 오차 값이 갖는 의미를 알아보기 위해 R/V Kairei와 R/V Mirai 두 탐사선의 탐사 진행방향과 PPM 및 STCM 교차점 간의 선형회귀 잔여경향계수(residual trend)와의 관계를 탐사선박의 운행방위각에 따른 변화를 고려하여 비교하였다(그림 7). 부족한 자료를 보충하기 위해, 일본 해구 및 이주-보닌 해구 인근에 대해 공개된 자료 뿐만 아니라 Choe and Dyment (2020a)에서 일본 해구 지역의 지자기이상도 제작을 위해 사용하였던 자료들도 함께 활용하였다. 각 측선의 잔여경향계수는 상당한 산포임에도 불구하고 선박의 탐사 진행방향에 따라 사인(sine) 함수 형태의 대칭 분포를 보였다. 하지만 R/V Kairei와 R/V Mirai 두 선박의 잔여경향계수는 서로 정반대의 대칭분포를 보였다. 이러한 관측결과를 이해하기위해 연구선의 움직임과 상온에서 자성체의 시간과 점성자화와의 상관관계(Dunlop, 1989)를 이용한 단순도식모델을 만들었다(그림 8). 이 때, 연구선을 하나의 거대한 단일 자성체로 간주하였다. 예를 들어, 배가 자기적도(magnetic equator)에서 자북극(the north magnetic pole)으로 이동할 때 이 배는 주변자기장의 영향을 받아 유도자화 되어 유도쌍극자기장(induced dipole field)을 발생시킨다(Isezaki, 1986; Korenaga, 1995; Nogi and Kaminuma, 1999). 이때, 이 자성체는 배의 중심에서 선미(stern)방향으로 양의 자기장을, 그리고 선수(bow)방향으로 음의 자기장을 생성하게 되고(그림 8a), 배가 자북으로 수직이동함에 따라 점차 강해지는 유도자화에 의한 점성자화의 영향을 받아 선형 경향성의 성분을 획득하게 된다(그림 8b). 따라서 잔여경향계수가 0에 가깝게 수렴하는 R/V Kairei와 R/V Mirai에는 STCM 자력계가 선박 자성체의 중심 부근에 위치하고 있다는 것을 알 수 있다. 보다 정확히 말하면, 우리는 선상자력계가 자성체인 선박의 중심으로부터 R/V Kairei의 경우 중심보다 조금 앞쪽에, 그리고 R/V Mirai의 경우 조금 뒤쪽에 위치하고 있음을 추정할 수 있다. 따라서, 배가 북쪽으로 향할 때 R/V Kairei에 위치한 센서는 점성자화로부터 음의 자기장을, 그리고 R/V Mirai에 위치한 센서는 양의 자기장에 영향을 받으며 주변자기장을 획득한다(그림 8b). 하지만 연구선의 진행방향 변화는 유도자화의 세기 변화에 따른 점성자화의 변화를 발생시켜 진행 방위각에 따라 사인곡선 형태의 대칭성을 나타내게 될 것이다(그림 7, 8c).
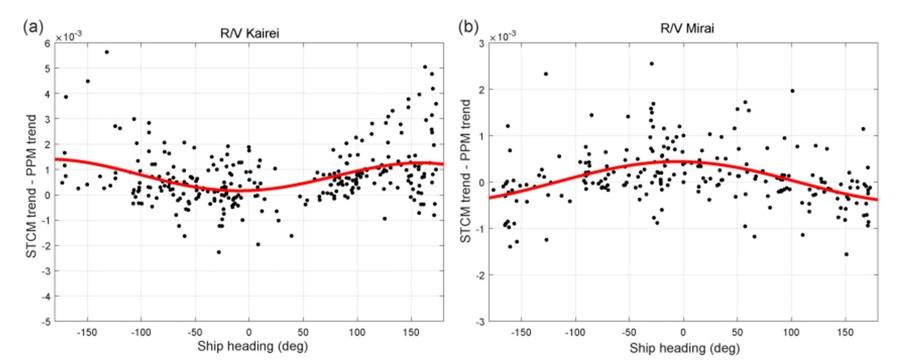
Relationship of the residual trend with the ship heading. Black dots, data from R/V Kairei (a) and R/V Mirai (b). Red solid lines, best fitting of Sine functions.
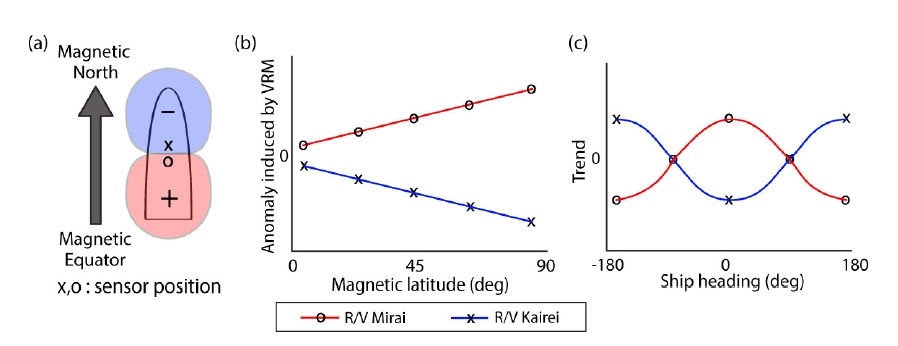
(a) Schematic illustration of the magnetic anomaly of a ferromagnetic ship body when the ship is heading to the north at northern mid-latitudes. “X” and “O” signs mark the location of the STCM sensor on R/V Kairei and R/V Mirai, respectively. (b) Expected magnetic field variations trlated to the acquisition of viscous magnetization, following Fig. 7. (c) Predicted relationship of the residual trend with the ship heading for R/V Kairei (blue) and R/V Mirai (red).
지금까지 일본 해구와 이주-보닌 해구 인근에서 획득된 해양자력탐사자료를 활용하여 선박의 점성자화 효과에 대해 분석을 수행하였다. 향후 충분히 누적된 자료를 이용하여 분석하게 된다면 해당 선박의 점성자화 수치모사도 가능하게 될 것이다. 그에 따라 센서의 잡음을 효과적으로 제어할 수 있을 뿐 아니라, 별도의 조작없는 지자기자동관측시스템의 구축을 통한 천문학적인 해양탐사비용의 절감 효과를 가져와 고해상도의 지자기이상도 제작에 중요한 역할을 수행할 수 있을 것으로 기대한다.
5. 결 론
이 연구에서는 해양자력탐사에 사용되는 주요 두 자력계의 자료처리방법을 보다 쉽게 선형대수 풀이로 소개한다. 또한, 배의 자성의 영향을 보정하였음에도 불구하고 선박의 점성자화의 영향으로 인해 지자기이상도 제작에 사용될 수 없었던 STCM 자료의 효과적인 활용을 위해 교차점 보정 알고리즘을 소개하였다. 이 보정법은 향후 연구선의 점성자화 수치모사를 통해 선내 설치된 자력 센서의 잡음을 효과적으로 제어할 수 있게 하고, 또한 별도의 조작없는 해양 지자기 자동관측시스템의 구축을 가능하게 하여 천문학적인 해양탐사비용을 줄임으로써 고해상도의 지자기이상도 제작에 중요한 역할을 할 수 있을 것으로 기대한다.
Acknowledgments
이 연구는 프랑스 파리지구물리연구소(IPGP), 한국연구재단 박사후국내연수지원사업(NRF-2020R1A6A3A01095798)과 대학중점연구소사업(No.2019R1A6A1A03033167)의 지원으로 수행되었습니다. 논문 심사과정 중 보다 좋은 원고가 될 수 있도록 세심한 심사와 아낌없는 조언을 해 주신 두 분의 심사위원님께 깊은 감사를 드립니다.
References
-
Choe, H. and Dyment, J., 2020a, Fading magnetic anomalies, thermal structure and earthquakes in the Japan trench. Geology, 48, 278-282
[https://doi.org/10.1130/G46842.1]

-
Choe, H. and Dyment, J., 2020b, Decreasing magnetization, lithospheric flexure and rejuvenated hydrothermalism off the Japan-Kuril subduction zone. Geophysical Research Letters, 47, 1-7
[https://doi.org/10.1029/2019GL085975]

-
Choi, H., Kim, S.-S., Dyment, J., Granot, R., Park, S.-H. and Hong, J.K., 2017, The kinematic evolution of the Macquarie Plate: A case study for the fragmentation of oceanic lithosphere. Earth and Planetary Science Letters, 478, 132-142
[https://doi.org/10.1016/j.epsl.2017.08.035]

-
Dunlop, D.J., 1989, Viscous remanent magnetization (VRM) and viscous remagnetization. In: Geophysics. Encyclopedia of Earth Science. Springer, Boston, MA.
[https://doi.org/10.1007/0-387-30752-4_155]

-
Engels, M., Barckhausen, U. and Gee, J.S., 2008, A new towed marine vector magnetometer: methods and results from a Central Pacific cruise. Geophysical Journal International, 172, 115-129
[https://doi.org/10.1111/j.1365-246X.2007.03601.x]

-
Hinze, W.J., Von Frese, R.R. and Saad, A.H., 2013, Gravity and magnetic exploration: Principles, practices, and applications. Cambridge University Press, 19-37
[https://doi.org/10.1017/CBO9780511843129.003]

- Hrvoic, I., 1989, Overhauser Magnetometers for Measurement of the Earth’s Magnetic Field. Magnetic field Workshop on Magnetic Observatory Instrumentation Espoo, Finland, 1-20.
-
Hsu, S.-K., 1995, XCORR: a cross-over technique to adjust track data. Computers & Geosciences, 21, 259-271
[https://doi.org/10.1016/0098-3004(94)00070-b]

-
Isezaki, N., 1986, A new shipboard three-component magnetometer. Geophysics, 51, 1992-1998
[https://doi.org/10.1190/1.1442054]

-
Ishihara, T., 2015, A new leveling method without the direct use of crossover data and its application in marine magnetic surveys: weighted spatial averaging and temporal filtering. Earth, Planets and Space, 67, 11
[https://doi.org/10.1186/s40623-015-0181-7]

- König, M., 2006, Processing of shipborne magnetometer data and revision of the timing and geometry of the Mesozoic break-up of Gondwana. Berichte zur Polar- und Meeresforschung (Reports on Polar Research), Bremerhaven, Alfred Wegener Institute for Polar and Marine Research, 525, 137 p,
-
Korenaga, J., 1995, Comprehensive analysis of marine magnetic vector anomalies. Journal of Geophysical Research, 100( B1), 365-378
[https://doi.org/10.1029/94JB02596]

-
Lee, S.-M. and Kim, S.-S., 2004, Vector magnetic analysis within the southern Ayu Trough, equatorial western Pacific. Geophysical Journal International, 156, 213-221
[https://doi.org/10.1111/j.1365-246X.2003.02125.x]

-
Nakanishi, M., Tamaki, K. and Kobayashi, K., 1989, Mesozoic magnetic anomaly lineations and seafloor spreading history of the northwestern Pacific. Journal of Geophysical Research: Solid Earth, 94, 15437-15462
[https://doi.org/10.1029/JB094iB11p15437]

- Nogi, Y. and Kaminuma, K., 1999, Measurements of vector magnetic anomalies on board the icebreaker Shirase and the magnetization of the ship. Annali di Geofisica, 42, 161-170.
-
Primdahl, F., 1979, The fluxgate magnetometer. Journal of Physics E: Scientific Instruments, 12, 241.
[https://doi.org/10.1088/0022-3735/12/4/001]

-
Thébault, E., Finlay, C.C., Beggan, C.D., Alken, P., Aubert, J., Barrois, O., Bertrand, F., Bondar, T., Boness, A., Brocco, L., Canet, E., Chambodut, A., Chulliat, A., Coïsson, P., Civet, F., Du, A., Fournier, A., Fratter, I., Gillet, N. and Zvereva, T., 2015, International Geomagnetic Reference Field: the 12th generation. Earth, Planets and Space, 67, 79
[https://doi.org/10.1186/s40623-015-0228-9]

-
Tominaga, M. and Sager, W.W., 2010, Revised Pacific M-anomaly geomagnetic polarity timescale. Geophysical Journal International, 182, 203-232
[https://doi.org/10.1111/j.1365-246X.2010.04619.x]

-
Wessel, P., 2010, Tools for analyzing intersecting tracks: The x2sys package. Computers & Geosciences, 36, 348-354
[https://doi.org/10.1016/j.cageo.2009.05.009]


