다검출기 유도결합 플라즈마 질량분석기를 이용한 납 동위원소 분석법
초록
납(Pb)은 암석 내 미량원소로 존재하고 4개의 안정동위원소(204Pb, 206Pb, 207Pb, 208Pb)를 가지고 있으며 제련, 채광, 화석연료의 연소 및 유연 휘발유의 사용과 같은 각종 산업활동으로 인하여 대기권, 수권, 생물권 및 지권에 유입되어 심각한 환경오염을 일으킨다. 납 동위원소는 납 오염 기원 추적 및 납의 생지화학적 순환을 이해하는데 유용하게 사용될 수 있다. 염산(HCl)과 브로민화수소(HBr)를 이용하는 납 분리법은 높은 분석 재연성 및 정확도를 얻을 수 있지만 전처리 과정에 오랜 시간이 소요되는 단점이 있다. 따라서 본 연구에서는 염산(HCl)만을 이용한 신속하며 효율적인 분리법을 정립 하고자 하였다. 본 연구에서는 두 종류 이온 교환수지(Sr-resin 및 Pb-resin)의 납 분리 효율 및 회수율 비교를 통하여 최적의 이온 교환수지를 선정하였다. 개발된 분리법의 신뢰성 검증을 위하여 미국 지질조사국(USGS)과 캐나다 국립연구원(NRCC)의 참조물질에 대한 납 동위원소 분석을 실시하였고 기존에 보고값과 오차범위 내에서 일치하는 것을 확인하였다. 본 연구를 통해 개발된 납 분리법은 많은 시료에 대한 분석이 요구되는 환경시료의 납 동위원소를 분석하는데 유용하게 활용될 수 있을 것으로 여겨진다.
Abstract
Lead (Pb) as a trace element occurs in rocks and has four stable isotopes (204Pb, 206Pb, 207Pb, 208Pb). Pb is released into the atmosphere, biosphere, hydrosphere and geosphere through various industrial activities, such as smelter, mining, combustion of fossil fuels and use of leaded gasoline, and result in serious environmental contamination. Pb isotopes can be used to trace the Pb contamination source and to understand of the biogeochemical cycling of Pb in the environment. Pb purification with two-step chemical separation using hydrochloric acid (HCl) and hydrogen bromide (HBr) can yield high precise and accurate results although it needs a lot of time and labor during Pb purification. Here, we developed one-step chemical separation using only HCl. In order to develop an efficient separation method, two kinds of ion exchange resins, Eichrom Sr-resin and Pb-resin, were used to compare the separation and recovery of Pb from other matrix elements. Further, in order to verify this method we measured Pb isotopes in several geological reference materials distributed by USGS and NRCC. The results are consistent with the reported values within the error, indicating that this method is successfully developed. It is expected that this study can be broadly used to measure Pb isotopes in various environmental samples.
Keywords:
Pb isotopes, chemical separation, MC-ICP-MS, environmental sample키워드:
납 동위원소, 원소분리법, 다검출기 유도결합 플라즈마 질량분석기, 환경시료1. 서 론
납(Pb)은 원자번호 82, 질량수 207.2 g/mol인 원소로 암석 내 미량으로 존재하며 4개의 안정동위원소(204Pb, 206Pb, 207Pb, 208Pb)를 가지고 있다. 이 중 204Pb는 비방사기원(non-radiogenic) 안정동위원소이고 206Pb, 207Pb, 208Pb는 우라늄과 토륨의 방사성 붕괴에 의해 생성된 방사기원(radiogenic) 동위원소이다. 일반적으로 암석이나 광물의 풍화에 의해 자연계로 배출되는 납은 대기권, 수권, 지권, 생물권에 미량으로 존재하지만 광산배수, 제련 활동, 석탄 및 석유에너지 사용과 같은 인위적인 활동의 부산물로 다량 배출되어 심각한 환경오염을 유발하며 인체건강에 악영향을 미칠 수 있다(Rieuwerts et al., 1999; Ahlberg et al., 2006). 다량의 납으로 오염된 지역에서의 오염원 기원추적 및 지구화학적 순환 연구에 납 동위원소는 유용하게 사용될 수 있어 이를 이용한 연구가 국내외에서 활발히 이루어 지고 있다. 예를 들어 호수 및 해양 퇴적물(Farmer et al., 1996; Monna et al., 1999; Townsend and Snape, 2002), 눈 및 빙하 코어(Rosman et al., 1993; Simonetti et al., 2000), 토탄층(Weiss et al., 1999; Novák et al., 2003), 나무의 나이테(Watmough et al., 1999; Patrick and Farmer, 2006), 이끼(Doucet and Carignan, 2001; Kylander et al., 2007) 등의 다양한 시료에 대한 납 동위원소 분석을 통하여 오염원 추적 및 그 이동경로를 추적하였다.
일반적으로 납 동위원소 분석에는 열이온화질량분석기(TIMS)와 다검출기 유도결합 플라즈마 질량분석기(MC-ICP-MS)가 이용되고 있다. TIMS를 이용하여 분석할 경우, 염산(HCl)을 이용한 1차 원소분리와 브로민화수소(HBr)를 이용한 2차 원소분리과정을 거치게 된다. 총 2차에 걸친 원소분리 과정을 통하여 시료에 대한 높은 분석 재연성 및 낮은 분석오차를 얻을 수 있지만 시료 전처리 과정에 오랜 시간이 소요되어 다수의 시료를 분석할 때 어려운 점이 있다(Kuritani and Nakamura, 2002; Weiss et al., 2004). 이에 반해 MC-ICP-MS를 이용하여 분석할 경우 용액화된 시료를 원소분리과정 없이 동위원소 존재비를 알고 있는 탈륨(Tl) 용액(NIST SRM 997 Thallium isotopic standard; 205Tl/203Tl = 2.38714)을 주입하여 단시간에 많은 시료를 분석할 수 있다. 그러나 총용존고형물질(total dissolved solid)이 많을 경우 매질효과(matrix effect)에 의해 분석감도가 낮아져 분석 재연성이 낮고 상대적으로 높은 분석오차를 얻게 된다.
이러한 단점을 해결하기 위하여 본 연구에서는 추출 수지(Eichrom Pb resin, 100-150 μm)와 염산(HCl)을 이용하여 신속하고 효율적인 원소분리법을 정립하고자 하였다. 본 연구에서 개발된 분리법에 대한 신뢰성 검증을 위하여 미국 지질조사국(USGS)과 캐나다 국립연구원(NRCC)의 참조물질에 대하여 MC-ICP-MS를 이용하여 납 동위원소 분석을 수행하였다.
2. 실험방법 및 동위원소 분석
2.1 납 원소 분리법 개발
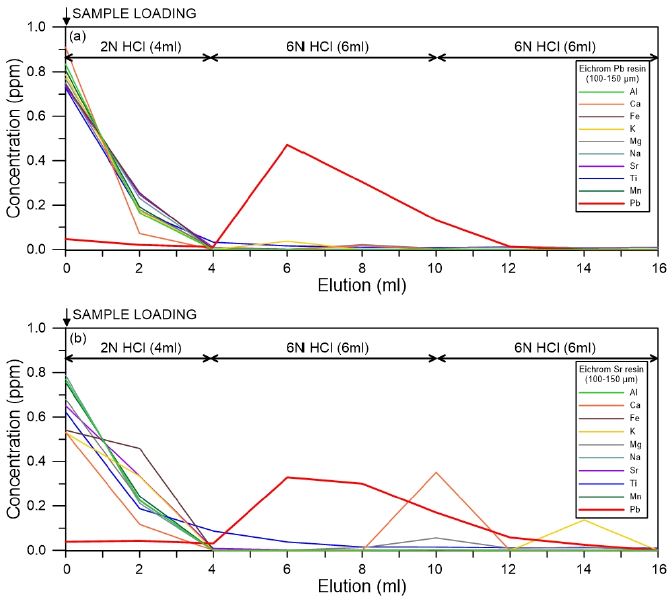
납 분리법을 개발하기 위하여 4종류의 ICP 표준물질(ICP-MS-CAL I-IV standard solutions)을 혼합하여 원소의 농도가 1.0 mg/L가 되도록 제조하였다. 납 원소 분리에 많이 이용되고 있는 두 종류의 이온 교환수지(Eichrom Sr-resin, Eichrom Pb-resin)를 사용하여 분리 후 회수율을 비교하였다. 두 종류 수지에서 모두 납이 분리되었지만 Sr-resin을 이용했을 때 약 80%, Pb-resin을 이용했을 때 약 90%이상의 회수율을 얻을 수 있었다. 또한 Sr-resin의 경우, 납 원소 분리 구간에 칼슘이 함께 용출되어 납 원소 분리에 Pb-resin이 더 효과적임을 밝혔다(그림 1).
2.2 시료전처리
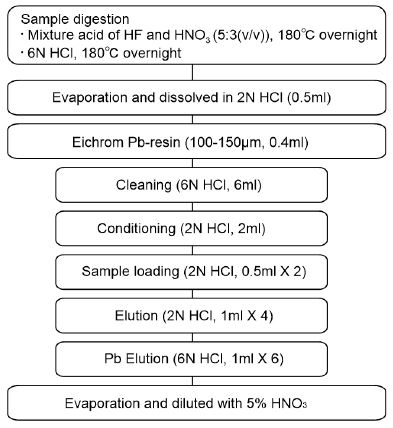
미국 지질조사국(USGS)의 7종 암석 참조물질(SGR-1, STM-1, AGV-2, GSP-2, BCR-2, BHVO-2, BIR-1a)과 캐나다 국립연구원(NRCC)의 2종 퇴적물 참조물질(MESS-3, HISS-1)을 사용하여 실험을 수행하였다. 우선 각 참조물질에 대해 보고된 납 농도를 이용하여 납의 양이 100 ng이 되도록 60 mL 테플론 용기에 시료를 취한 후 고순도 불산(HF)과 질산(HNO3)이 5:3의 부피비로 혼합된 산 5 mL를 넣고 약 180~200℃에서 시료를 완전 용해시켰다. 이후 용해과정 중 생성된 플루오르화물(fluoride)를 제거를 위해 시료를 증발시킨 후 6N 염산 5 mL를 넣고 하루 동안 가열한 후 반응 용액을 증발시켰다(Ryu et al., 2014). 증발된 시료에 2N 염산 0.5 mL를 넣고 매질을 변화시켰다.
시료 내 납 분리를 위해서 먼저 Bio-rad사의 크로마토그래피 컬럼(Poly-Prep Chromatography columns, 0.8×4 cm, 10 mL reservoir)에 Eichrom사의 이온 교환수지(Eichrom Pb-resin, 100-150 μm)를 0.4 mL 충진하였다. 컬럼에 충진된 수지는 6N염산 6 mL를 이용하여 세척한 후 2N의 염산 2 mL를 이용하여 매질을 변화시켰다. 사전에 준비된 참조물질을 컬럼에 로딩한 후 2N 염산 0.5 mL를 넣어 시료가 수지에 충분히 흡착되도록 하였다. 2N 염산 4 mL를 넣어 시료 내 다른 원소를 제거한 후 6N 염산 6 mL를 넣어 납을 분리하였다(그림 2). 이 구간에서 시료 내 존재하는 납의 90% 이상이 용출되었으며 기타 원소들은 존재하지 않았다. 본 방법으로 납을 분리할 때 소요된 시간은 약 1시간으로 기존 분리법보다 상당한 시간을 절약할 수 있었다.
2.3 납 동위원소 분석
분리된 납의 동위원소 분석은 한국기초과학지원연구원(KBSI)에 설치된 독일 Thermo Scientific사의 다검출기 유도결합 플라즈마 질량분석기(MC-ICP-MS, Neptune model)를 이용하였다. 4개의 납 동위원소 중 204Pb만 비방사기원(radiogenic) 동위원소이기 때문에 분석 중 발생하는 질량분별(instrumental mass fractionation)과 질량편이(mass bias effect)를 납 동위원소를 이용하여 내부적으로 보정하는 것이 불가능하다. 따라서 동위원소 존재비를 알고 있는 탈륨(Tl) 용액(NIST SRM 997 Thallium isotopic standard; 205Tl/203Tl = 2.38714)을 시료에 약 5:1의 비가 되도록 주입하여 분석된 납 동위원소 비에 대한 질량분별보정을 아래의 수식을 이용하여 수행하였다.
1) 지수법칙을 이용한 Tl 질량 편이 상수 계산:
| (1) |
식(1)에서 M은 각 동위원소의 질량을 나타냄.
2) 지수법칙을 이용한 납 동위원소 비 보정:
| (2) |
| (3) |
식(2)는 204Hg에 의한 동중원소간섭(isobaric interference)을 보정하는 수식이며, 식(3)에서 x = 206, 207, 208이며, β(Tl)은 식(1)에서 계산된 값이다.
3) 외부보정법을 통한 납 동위원소 비 보정:
납 동위원소 표준물질(NBS 981)을 이용하여 표준물질-시료-표준물질의 외부보정법을 사용하여 식(3)에서 얻은 납 동위원소 비를 보정하였다.
3. 결과 및 토의
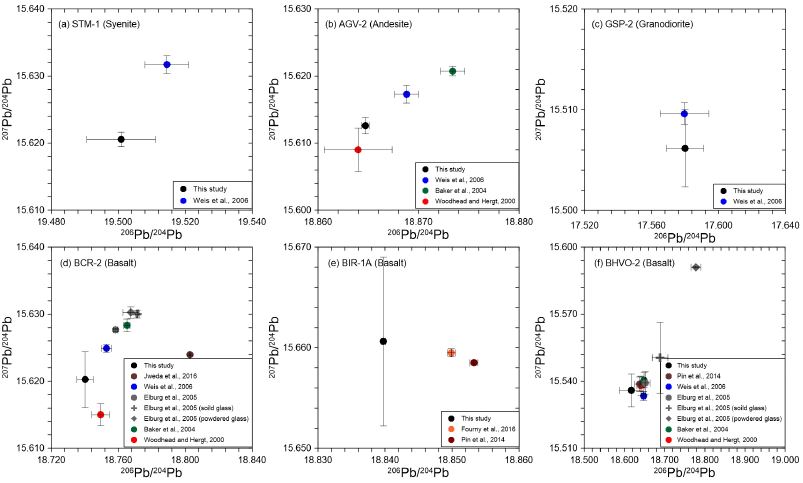
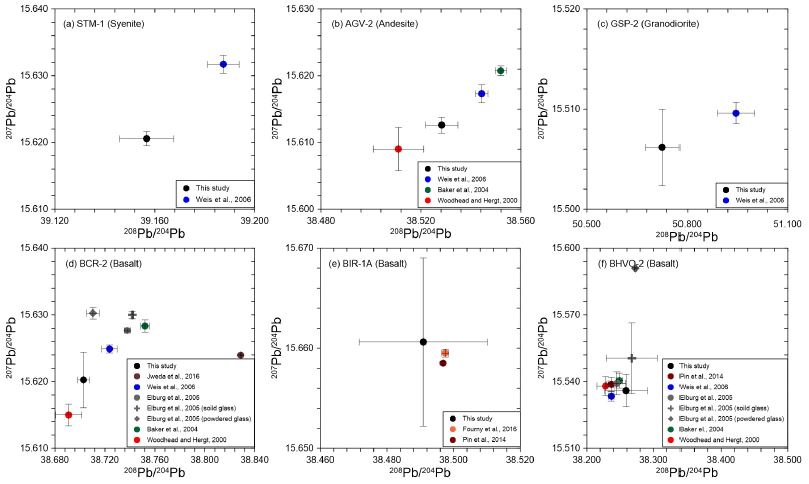
표 1과 그림 3에 Pb 동위원소 표준물질(NBS 981)을 반복 분석한 결과를 나타내었다. 2017년 5월부터 7월까지 50회 반복 분석된 NBS 981의 Pb 동위원소 비는 각각 206Pb/204Pb = 16.936±0.000 (1se), 207Pb/204Pb = 15.489±0.000 (1se), 208Pb/204Pb = 36.701±0.000 (1se)이며 이는 기존 보고값과 오차범위 내에서 일치하는 값을 보여주었다(Todt et al., 1996). 표 2와 그림 4 및 5에 본 연구에서 개발된 Pb 분리법을 이용하여 분석한 9종 참조물질에 대한 Pb 동위원소 비를 나타내었다. 현무암 참조물질 BIR-1a, 섬장암 참조물질 STM-1, 화강섬록암 참조물질 GSP-2를 제외하고 분석된 납 동위원소 비(206Pb/204Pb, 207Pb/204Pb, 208Pb/204Pb)는 모두 기존 연구에서 보고된 값과 오차범위 내에서 일치하였다(Woodhead and Hergt, 2000; Baker et al., 2004; Elburg et al., 2005; Weis et al., 2006; Pin et al., 2014; Fourny et al., 2016; Jweda et al., 2016). 그러나 BIR-1a의 경우207Pb/204Pb와 208Pb/204Pb는 보고값에 비해 상대적으로 넓은 오차범위를 보이고, 206Pb/204Pb는 보고값에 비해 작은 값을 가진다. 또한 STM-1의 206Pb/204Pb비는 기존 보고값과 오차범위 내에서 일치하였지만, 207Pb/204Pb와 208Pb/204Pb비는 기존 보고값에 비해 낮은 값을 보였다. 화강섬록암 참조물질인 GSP-2의 208Pb/204Pb비는 기존 보고값에 비해 낮고 207Pb/204Pb비는 보고된 값에 비해 넓은 오차범위를 보였다. 현무암 참조물질인 BHVO-2의 207Pb/204Pb비는 기존 보고값과 오차범위 내에서 일치하는 값을 보였지만, 206Pb/204Pb와 208Pb/204Pb비는 기존 보고값에 비해 상대적으로 넓은 오차범위를 보였다. 이러한 결과는 기존 연구가 고압용기(High-pressure PTFE bomb)를 이용하여 용해된 시료를 분석한 반면 본 연구에서는 일반 산분해법을 이용하여 저어콘과 같은 불용성 광물이 용해되지 않아 나타난 결과(Weis et al., 2006)이거나 참조물질 자체가 가진 불균질성에 기인하는 결과로 여견진다(Woodhead and Hergt, 2000; Kuritani and Nakamura, 2002; Weis et al., 2006). 예를 들어, Elburg et al. (2005) 에 따르면 암석 참조물질과 유리질 참조물질은 상당한 납 동위원소의 차이를 보인다(그림 4, 5). 이는 암석 참조물질이 상당한 불균질성을 가진다는 것을 의미하며 따라서 본 연구에서 기존 보고값과 일치하지 않는 납 동위원소 비는 암석 참조물질의 불균질성에 기인함을 알 수 있다. 퇴적물 참조물질(MESS-3, HISS-1)과 셰일 참조물질(SGR-1)은 Pb 동위원소 비에 대한 기존 보고값이 없으며 본 연구에서 최초로 보고하였다(표 2).

Measured Pb isotopic ratios of common Pb isotopic standard SRM 981 during this study. Line represents a mean value of measured Pb isotope ratios. Errors are internal standard error (1se, n=20).

Comparison of measured Pb isotopic ratios (207Pb/204Pb vs.206Pb/204Pb) with reported values in the USGS reference materials. The circle, cross, and diamond symbols represent bulk rock, powdered glass, and solid glass, respectively. Errors are external standard error (1se).

Comparison of measured Pb isotopic ratios (207Pb/204Pb vs.208Pb/204Pb) with reported values in the USGS reference materials. The circle, cross, and diamond symbols represent bulk rock, powdered glass, and solid glass, respectively. Errors are external standard error (1se).
본 연구를 통해 기존 납 분리방법의 단점인 오랜 시료 분리시간을 획기적으로 단축하였으며 다양한 참조물질에 대한 Pb 동위원소 분석을 통하여 개발된 Pb 분리법이 성공적임을 확인하였다. 따라서 향후 많은 시료에 대해 Pb 동위원소 분석을 요하는 미세먼지 등과 같은 환경분야 시료에 대한 Pb 동위원소 분석을 신속하고 정확하게 함으로써 오염원 기원 추적 및 지구화학적 순환 연구에 유용하게 사용될 수 있을 것으로 기대된다.
Acknowledgments
본 연구는 2017년 정부(과학기술정보통신부)의 재원으로 국가과학기술연구회 창의형 융합연구사업(No. CAP-17-05-KIGAM)과 한국기초과학지원연구원(과제번호 C38709)의 지원을 받아 수행되었습니다. 원고를 세심하고 검토하고 좋은 의견을 주신 박계헌 교수님과 이승구 박사님께 감사의 말씀을 드립니다.
References
-
Ahlberg, G., Gustafsson, O., and Wedel, P., (2006), Leaching of metals from sewage sludge during one year and their relationship to particle size, Environmental pollution, 144, p545-553.
[https://doi.org/10.1016/j.envpol.2006.01.022]

- Baker, J., Peate, D., Waight, T., and Meyzen, C., (2004), Pb isotopic analysis of standards and samples using a 207Pb-204Pb double spike and thallium to correct for mass bias with a double-focusing MC-ICP-MS, Chemical Geology, 211, p275-303.
- Doucet, F.J., and Carignan, J., (2001), Atmospheric Pb isotopic composition and trace metal concentration as revealed by epiphytic lichens: an investigation related to two altitudinal sections in Eastern France, Atmospheric Environment, 35, p3681-3690.
-
Elburg, M., Vroon, P., van der Wagt, B., and Tchalikian, A., (2005), Sr and Pb isotopic composition of five USGS glasses (BHVO-2G, BIR-1G, BCR-2G, TB-1G, NKT-1G), Chemical Geology, 223, p196-207.
[https://doi.org/10.1016/j.chemgeo.2005.07.001]

-
Farmer, J.G., Eades, L.J., Mackenzie, A.B., Kirika, A., and Bailey-Watts, T.E., (1996), Stable lead isotope record of lead pollution in Loch Lomond sediments since 1630 AD, Environmental Science & Technology, 30, p3080-3083.
[https://doi.org/10.1021/es960162o]

-
Fourny, A., Weis, D., and Scoates, J.S., (2016), Comprehensive Pb‐Sr‐Nd‐Hf isotopic, trace element, and mineralogical characterization of mafic to ultramafic rock reference materials, Geochemistry, Geophysics, Geosystems, 17, p739-773.
[https://doi.org/10.1002/2015gc006181]

-
Jweda, J., Bolge, L., Class, C., and Goldstein, S.L., (2016), High Precision Sr‐Nd‐Hf‐Pb Isotopic Compositions of USGS Reference Material BCR-2, Geostandards and Geoanalytical Research, 40, p101-115.
[https://doi.org/10.1111/j.1751-908x.2015.00342.x]

-
Kuritani, T., and Nakamura, E., (2002), Precise isotope analysis of nanogram-level Pb for natural rock samples without use of double spikes, Chemical Geology, 186, p31-43.
[https://doi.org/10.1016/s0009-2541(02)00004-9]

-
Kylander, M.E., Weiss, D.J., Jeffries, T.E., Kober, B., Dolgopolova, A., Garcia-Sanchez, R., and Coles, B.J., (2007), A rapid and reliable method for Pb isotopic analysis of peat and lichens by laser ablation-quadrupole-inductively coupled plasma-mass spectrometry for biomonitoring and sample screening, Analytica chimica acta, 582, p116-124.
[https://doi.org/10.1016/j.aca.2006.08.050]

-
Monna, F., Dominik, J., Loizeau, J.L., Pardos, M., and Arpagaus, P., (1999), Origin and Evolution of Pb in Sediments of Lake Geneva (Switzerland-France). Establishing a Stable Pb Record, Environmental Science & Technology, 33, p2850-2857.
[https://doi.org/10.1021/es9902468]

- Novák, M., Emmanuel, S., Vile, M.A., Erel, Y., Véron, A., Paces, T., Wieder, R.K., Vanecek, M., Stepanova, M., Brizova, E., and Hovorka, J., (2003), Origin of lead in eight Central European peat bogs determined from isotope ratios, strengths, and operation times of regional pollution sources, Environmental science & technology, 37, p437-445.
-
Patrick, G.J., and Farmer, J.G., (2006), A stable lead isotopic investigation of the use of sycamore tree rings as a historical biomonitor of environmental lead contamination, Science of the total environment, 362, p278-291.
[https://doi.org/10.1016/j.scitotenv.2005.12.004]

-
Pin, C., Gannoun, A., and Dupont, A., (2014), Rapid, simultaneous separation of Sr, Pb, and Nd by extraction chromatography prior to isotope ratios determination by TIMS and MC-ICP-MS, Journal of Analytical Atomic Spectrometry, 29, p1858-1870.
[https://doi.org/10.1039/c4ja00169a]

- Rieuwerts, J.S., Farago, M., Cikrt, M., and Bencko, V., (1999), Heavy metal concentrations in and around households near a secondary lead smelter, Environmental Monitoring and Assessment, 58, p317-335.
-
Rosman, K.J.R., Chisolm, W., Boutron, C.F., Candelone, J.P., and Gorlach, U., (1993), Isotopic evidence for the source of lead in Greenland snows since the late 1960s, Nature, 362, p333-334.
[https://doi.org/10.1038/362333a0]

-
Ryu, J.S., Vigier, N., Lee, S.W., Lee, K.S., and Chadwick, O.A., (2014), Variation of lithium isotope geochemistry during basalt weathering and secondary mineral transformations in Hawaii, Geochimica et Cosmochimica Acta, 145, p103-115.
[https://doi.org/10.1016/j.gca.2014.08.030]

-
Simonetti, A., Gariépy, C., and Carignan, J., (2000), Pb and Sr isotopic compositions of snowpack from Québec, Canada: Inferences on the sources and deposition budgets of atmospheric heavy metals, Geochimica et Cosmochimica Acta, 64, p5-20.
[https://doi.org/10.1016/s0016-7037(99)00207-0]

- Todt, W., Cliff, R.A., Hanser, A., and Hofmann, A.W., (1996), Evaluation of a 202Pb-205Pb Double Spike for High-Precision Lead Isotope Analysis, Earth processes: reading the isotopic code, p429-437.
-
Townsend, A.T., and Snape, I., (2002), The use of Pb isotope ratios determined by magnetic sector ICP-MS for tracing Pb pollution in marine sediments near Casey Station, East Antarctica, Journal of Analytical Atomic Spectrometry, 17, p922-928.
[https://doi.org/10.1039/b203449m]

-
Watmough, S.A., Hughes, R.J., and Hutchinson, T.C., (1999), 206Pb/207Pb Ratios in Tree Rings as Monitors of Environmental change, Environmental science & technology, 33, p670-673.
[https://doi.org/10.1021/es980454k]

-
Weis, D., Kieffer, B., Maerschalk, C., Barling, J., de Jong, J., Williams, G., Mattielli, N., Scoates, J.S., Friedman, R.M., and Mahoney, J.B., (2006), High‐precision isotopic characterization of USGS reference materials by TIMS and MC‐ICP‐MS, Geochemistry, Geophysics, Geosystems, 7.
[https://doi.org/10.1029/2006gc001283]

-
Weiss, D., Shotyk, W., Appleby, P.G., Kramers, J.D., and Cheburkin, A.K., (1999), Atmospheric Pb deposition since the industrial revolution recorded by five Swiss peat profiles: enrichment factors, fluxes, isotopic composition, and sources, Environmental Science & Technology, 33, p1340-1352.
[https://doi.org/10.1021/es980882q]

-
Weiss, D.J., Kober, B., Dolgopolova, A., Gallagher, K., Spiro, B., Le Roux, ., Mason, T.F.D., Kylander, M., and Coles, B.J., (2004), Accurate and precise Pb isotope ratio measurements in environmental samples by MC-ICP-MS, International Journal of Mass Spectrometry, 232, p205-215.
[https://doi.org/10.1016/j.ijms.2004.01.005]

-
Woodhead, J.D., and Hergt, J.M., (2000), Pb‐Isotope Analyses of USGS Reference Materials, Geostandards and Geoanalytical Research, 24, p33-38.
[https://doi.org/10.1111/j.1751-908x.2000.tb00584.x]


