경주 어일분지 내 변형띠: 산상과 구조적 특성

초록
취성변형에 의해 비다공질 암석에서는 단열이, 다공질 암석에서는 변형띠가 주로 발달하며, 이들 중 일부는 단층으로 진화할 수 있다. 본 연구에서는 다공질 암석 내 변형띠의 산상과 구조적, 물질적 특성을 기반으로 변형띠의 진화를 이해하기 위하여 경주 어일분지 반고결 퇴적층 내 변형띠를 대상으로 구조관찰 및 물질분석을 실시하였다. 노두규모 관찰 결과, 변형띠는 운동학적 분류로 볼 때 전단띠이다. 식별되는 대부분의 전단띠는 수 mm 폭과 10 cm 미만의 겉보기 전단변위를 보인다. 대표적인 전단띠의 미구조 관찰결과, 파쇄로 인한 입자크기의 감소는 있으나 암편이 기질보다 많은 초기단계 파쇄변형 조직이 확인된다. 한편, 노두관찰에서 겉보기 변위량이 증가함에 따라 전단띠의 폭이 증가하는 경향과 전단띠 중 소수는 단층활면의 발달과 함께 최대 ~3 cm의 넓은 폭을 갖는 단층성 변형띠(또는 단층)로 진화하였음이 확인되었다. 단층성 변형띠 내부에는 전단변형이 집중된 영역인 수십 µm 폭의 주미끌림대가 발달하는데, 특징적으로 석영, 장석의 초미세입자들과 점토광물(특히, 스멕타이트)들로 채워져 있다. 이러한 관찰은, 작은 변위의 전단띠에서는 초기단계 파쇄변형 조직의 발달이 응력변형강화 거동과 그에 따른 전단띠 폭의 증가를 야기할 수 있는 반면, 초파쇄변형에 의한 초미세입자들의 형성이나 낮은 마찰강도의 점토광물들의 생성은 주미끌림대에서의 응력변형약화 거동과 전단변형 국지화(또는 전단띠의 단층으로의 진화)에 기여할 수 있음을 지시한다.
Abstract
Due to brittle deformation, fractures and deformation bands may form in non-porous rocks and porous rocks, respectively, and some of them may evolve into faults. We conducted structural observation and material analysis on deformation bands in the semi-consolidated, porous sediments of the Eoil Basin, Gyeongju, SE Korea, to understand their structural evolution into faults. According to the outcrop-scale observation, the deformation bands are shear bands in terms of kinematic classification. Most of the identified shear bands are several millimeters wide, and the apparent shear displacement along them is less than 10 cm. Microstructural observation of the typical shear band confirms that it has a protocataclasis structure with a high clast vs. matrix ratio despite grain size reduction due to mechanical crushing. At the outcrop, the shear band's width appears to increase as the apparent displacement increases, and a small number of the shear bands change to faulted deformation bands (or faults) which are as wide as up to ~3 cm and have slickensides (or smooth slip surfaces). The increase in the band's width with the displacement increase may be due to the strain-hardening behavior associated with the protocataclasis structure. In the faulted deformation bands, principal slip zones (PSZs) with a width of several tens of μm, where shear strain is localized, are developed. The PSZs are composed of ultrafine grains of quartz, feldspar, and clay minerals (mostly smectite). The observation implies that the formation of ultrafine particles by ultracataclasis or the formation of clay minerals with low frictional strength may contribute to the strain-softening behavior and the shear localization in the PSZs (or the evolution of the shear bands into faults), whereas the development of the protocataclasis structure in the shear band of small displacement may cause the strain-hardening behavior and increase in the band thickness.
Keywords:
Eoil Basin, porous rocks, deformation bands, shear deformation bands, faulted deformation bands키워드:
어일분지, 다공질 암석, 변형띠, 전단띠, 단층성 변형띠1. 서 론
변형띠(deformation bands)는 광물 또는 암석의 변형으로 인해 형성된 어느 정도의 폭을 갖는 대상 구조로서, 2차원적으로는 마치 띠처럼 보인다. 이러한 형태의 구조는 결정 내 소성변형으로 격자가 국부적으로 휘어지면서 만들어질 수 있고(e.g., Blenkinsop, 2000), 압쇄암에서의 전단띠(shear bands)처럼 연성전단변형의 결과로 형성될 수도 있으나(e.g., Trouw et al., 2010), 천부지각의 사암, 응회암, 석회암 등과 같은 다공질 암석과 미고결 내지 반고결 입상퇴적물의 응력변형국지화(strain localization)의 결과로 가장 흔하게 형성된다(Aydin, 1978). 이들 중 본 연구에서의 관심대상은 맨 마지막에 언급한 변형띠로서, 단층운동과 관련하여 주로 단층의 손상대(damage zones) 혹은 진행대(process zones)에서 발달하기 시작하는 불연속면 구조이다(Fossen et al., 2007).
노두규모에서 변형띠는 대부분 작은 변위(수 cm 미만)를 보이며 수 mm에서 수 cm의 폭을 가지는데, 여러 개가 군집 형태로 나타나거나 하나에서 여러 개로 분기하는 모습을 보이기도 한다(Aydin, 1978; Aydin and Johnson 1978; Fossen et al., 2007). 변형띠는 운동학적 메커니즘에 따라 압밀띠(compaction bands), 팽창띠(dilation bands), 전단띠(shear deformation bands; SDB) 및 둘 이상의 변형특성을 갖는 하이브리드 변형띠(hybrid deformation bands)로 분류된다(Fossen et al., 2007, 2011; Fossen, 2010). 이들 중 야외에서 흔히 관찰되는 전단띠는 입자의 회전 및 입자경계 미끌림에 의한 변형 뿐만 아니라 상당한 파쇄(cataclasis)를 동반하며 발달하기도 한다.
변형띠에 대한 이전 연구들은 변형띠의 수리학적 특성과 다공질 물질의 변형, 그리고 변형띠의 단층으로의 성장 등에 대해 주목하였다. 가령, 변형띠는 모암에 비해 상당히 다른(일반적으로 낮은) 투수율을 가질 수 있어 변형띠의 발달에 따른 퇴적층 내 유체유동의 변화 등을 비롯해 석유지질학 및 수리지질학적 측면의 연구가 많이 진행되어왔다(Heynekamp et al., 1999; Lothe et al., 2002; Sample et al., 2006; Sternlof et al., 2006; Tueckmantel et al., 2012; Torabi et al., 2013; Ballas et al., 2015). 다공질 퇴적암(또는 퇴적층)의 변형과 관련하여, 변형띠의 형성 및 단층으로의 진화 메커니즘을 이해하고자 하는 연구들이 수행되었다. 그 결과, 공극의 존재에 따른 입자의 운동학적 자유도로 인해 다공질 물질에서 변형띠 형성이 가능해진다는 점(Fossen, 2010), 각진 입자들의 증가는 전단저항을 증가시킨다는 점, 조립질 입자와 양호한 분급이 파쇄의 국지화(localization)에 용이하여 파쇄를 촉진시킨다는 점, 석영질보다는 장석질 사암에서 우선적으로 파쇄가 발생하는 경향이 있으며 상대적으로 높은 공극률 조건에서 입자 간 접촉부 응력(grain contact stress)이 크게 발생한다는 점 등이 보고되었다(Dunn et al., 1973; Mair et al., 2000, 2002a, 2002b; Du Bernard et al., 2002; Rotevatn et al., 2008; Eichhubl et al., 2010; Kaproth et al., 2010; Exner and Tschegg, 2012; Ballas et al., 2013, 2015). 변형띠가 형성된 후 지속적으로 전단변형이 누적되면, 극심한 입자 파쇄로 만들어진 암편 및 파쇄된 물질과 유체와의 반응에 의해 이차적으로 형성된 점토광물들로 구성된 변형띠 핵(core)이 발달할 수 있다. 변형띠 핵 내에 미끌림이 집중되는 주미끌림대(principal slip zones; PSZ)가 발달하는 경우 이를 단층성 변형띠(faulted deformation bands; FDB), 미끌림띠(slipped bands), 미소단층(micro faults), 또는 간단히 단층(faults)이라고 부르는데(Fossen and Hesthammer, 1997; Fossen et al., 2007; Pizzati et al., 2020), 초기단계의 변형띠로부터 어떻게 단층성 변형띠로 진화하는가가 다공질 퇴적층에서의 단층발달 메커니즘 연구에 있어 핵심적인 질문이다(Aydin and Johnson, 1978, 1983; Schultz, 2019). 기존의 몇몇 연구들에서 다공질 퇴적층에서의 변형띠 및 단층의 발달 모델이 제시된 바 있다. 가령, Aydin and Johnson (1978)은 단일 변형띠의 형성으로부터 시작하여 다수의 변형띠가 발달하는 변형띠 군집(deformation band cluster) 단계를 거쳐 변형띠가 가장 집중적으로 발달한 영역을 따라 미끌림면이 발달함을 주장하였다. Rotevatn et al. (2008)은 Aydin and Johnson (1978)의 모델과는 달리, 군집이 아닌 독립적인 변형띠 내부에서 점진적인 파쇄 후 미끌림면이 만들어지고 거기를 따라 미끌림이 계속될 수 있다는 모델을 제시하였다. 이 외의 연구에서도 발달 모델이 제시되기도 하였으나(Schultz and Siddharthan, 2005; Nicol et al., 2013), 변형띠의 단층성 변형띠로의 진화 메커니즘에 기반하여 단층발달을 설명하는 연구는 아직까지 충분히 이루어지지 못했다.
본 연구는 국내의 퇴적층에서 나타나는 변형띠를 대상으로 일차적으로는 변형띠의 산상과 구조적, 물질적 특성을 이해하고 궁극적으로는 수리학적, 역학적 실험과 결합하여 변형띠에 의한 퇴적층의 수리학적 특성변화와 변형띠로부터 단층으로의 역학적 진화모델을 제시하는 것을 목적으로 시작되었다. 국내에서는 금왕단층에서 발달한 단층암 특성을 보고하고 이를 토대로 단층 운동사 및 운동시기를 제시한 연구(Hong and Lee, 2012; Jang and Lee, 2012), 울산광역시 매곡동 일대 단층대에서의 구조분석을 통한 제4기 단층운동 연구(Choi et al., 2015), 한반도 남동부의 고응력장 복원 연구(Gwon and Kim, 2017) 등에서 변형띠가 기재, 논의되었으나 변형띠의 상세한 (미)구조와 물질특성을 제시한 연구는 수행되지 않았다. 본 연구는 경주 어일분지 남서부 마이오세 퇴적층에서 관찰되는 변형띠를 대상으로 실시하였다. 하나의 동일한 노두에는 서로 다른 전단(겉보기)변위를 겪은 변형띠, 즉 수 cm 미만의 작은 변위를 보이는 다수의 전단띠뿐 아니라 수십 cm 변위의 단층성 변형띠 여러 개가 공존하므로 작은 변위의 전단띠로부터 단층으로의 진화 연구에 적합하다. 본 논문은 앞서 언급된 궁극적인 연구 결과를 도출하기 위한 기초 연구로서, 연구지역에서 관찰된 전단띠와 단층성 변형띠의 노두규모 산상, (미)구조 및 물질 특성을 기재하고 이를 토대로 변형띠의 구조적 진화에 초점을 두고 토의하였다.
2. 어일분지 지질개요
한반도 남동부에는 동해 확장 시의 신생대 마이오세 지각변형 과정에서 형성된 여러 퇴적분지들이 존재하는데, 어일분지는 그 중 하나로 알려져 있다(Son et al., 2000; Kwon et al., 2011). 어일분지는 전체적으로 북동 방향으로 연장된 함몰지로서 길이는 약 12 km, 폭은 5 km에 달하는데, 주향이동단층과 정단층들을 분지경계단층으로 하는 지구(graben)와 반지구(half-graben)의 형태를 보이고 이들을 채우는 퇴적층은 하부로부터 전기 마이오세의 감포역암과 어일층 그리고 이를 부정합으로 피복하는 중기 마이오세 초의 송전층으로 구성된다(Son et al., 2000, 2013; Kwon et al., 2011). 어일분지는 북북서방향의 우수향 주향이동단층에 의해 북동과 남서 소분지로 나뉘는데, 북동 소분지는 하성 역암과 역질 사암 등으로 구성된 감포층과 현무암질 화산암, 화산쇄설암 및 호성 퇴적물로 이루어진 어일층이 주로 채우고 있으며, 남서 소분지의 경우 하성 역암, 각력암 및 사암으로 구성된 비화산성 송전층이 분지를 충전한다(Son et al., 2000, 2013; Kwon et al., 2011). 분지 북서경계단층과 분지 내부에 발달한 단층들은 이들을 덮고있는 퇴적층의 자세가 대부분 북서 내지 서북서로 경동(tilting)되어 동사구조(homocline)를 보이고 상부 지층일수록 경사각이 감소하는 양상이 나타남에 따라 퇴적동시기성 단층으로 해석되었다(Son et al., 2000, 2005). 아울러 분지 내부에 발달한 습곡구조, 공액상의 변형띠 그리고 암맥의 방향성과 관련한 연구 결과들은 서북서-동남동 방향의 분지 확장을 지시한다(Son et al., 2000). 앞선 구조지질학적, 퇴적학적 연구에서 도출된 결과들을 종합하면 어일분지는 북북서방향의 우수향 전단운동 시 유도된 서북서-동남동 방향의 확장으로 형성된 전형적인 당겨열림분지(pull-apart basin)로 해석된다(Son et al., 2000, 2005, 2013). 본 연구의 조사지역인 경주시 죽전리 일대는 어일분지 중 남서 소분지의 송전층에 해당하는 곳으로서, 절개단면에 드러나는 사암, 이암 및 역암층 내에서 다수의 변형띠가 나타난다(그림 1).

Location and geology of the study area. (a) Satellite image showing the study area including major tectonic faults and the Eoil Basin in SE Korea (modified from Son et al., 2013). (b) Geological map of the Eoil Basin. The study site indicated by the solid star is located in the southwestern part of the basin (modified from Son et al., 2000, 2005, 2013).
3. 연구방법
변형띠 노두에 대한 야외조사를 통해 변형띠의 특징적인 구조를 관찰, 스케치 및 기재하였으며, 층리, 변형띠, 단층활면(slickensides) 및 단층조선(slickenline)의 자세를 측정하였다. 아울러 변형띠를 따라 어긋나 보이는 퇴적층으로부터 겉보기 변위를 측정하였다. 추가적으로 실내분석을 위해 변형띠가 포함된 비정향 및 정향 벌크시료를 채취하였다.
변형띠 및 이를 둘러싼 모암 시료는 하루 동안 실온 건조 후 저점도 에폭시를 이용하여 시료 겉면을 보강하여 고결시켰다. 야외에서 단층활면과 단층조선이 확인된 단층성 변형띠의 경우는 변형띠에 대한 법선과 단층조선을 포함하는 면을 설정한 후 암석절단기로 절단하였다. 야외에서 단층조선을 인지하지 못한 변형띠는 단층조선이 확인된 변형띠와 유사한 운동감각으로 변형되었을 것으로 가정하여 절단하였다. 절단된 시료들은 50℃ 오븐에서 약 24시간 동안 건조되었으며, 시료 건조 시 물질이 탈락된 부분들은 저점도 에폭시를 이용해 추가적으로 보강하였다. 이후 추가적인 시료 절단과 연마를 통해 슬랩과 박편용 칩을 제작하였으며, 스캐너(Epson Perfection V800 Photo)를 이용하여 고해상도(1200 dpi)의 구조분석용 이미지를 획득하였다. 시료의 절단 및 연마 전 과정에 걸쳐 수분에 의한 구조 및 물질 훼손을 방지하기 위해 물 대신 방전가공유를 사용하였다.
모암 조직과 변형띠 미구조는 일차적으로 광학현미경(Olympus BX53)으로 분석하였고, 보다 작은 규모에서의 추가적인 구조 및 물질은 경상국립대학교 공동실험실습관의 에너지분산형 분광분석기(energy dispersive X-ray spectroscopy; EDS; Oxford X-Max 50)가 장착된 전계방사 전자현미분석기(field emission electron probe micro-analyzer; FE-EPMA; JEOL JXA-8530F PLUS)를 이용해 분석하였다. 분석은 박편의 탄소코팅 후 가속전압 15 kV, 빔 전류 10 nA 조건에서 실시하였다.
변형띠와 모암의 광물학적 특성을 비교 분석하기 위하여 X-선 회절분석을 실시하였다. 분말시료는 변형띠와 그 주변 모암을 포함하는 슬랩 내에서 적합한 위치를 선정한 후 마이크로드릴(micro-drill; FBS 240/E, Proxxon)을 이용하여 물질을 긁어내는 방식으로 획득하였다(Kim et al., 2017). 이후 아게이트를 이용해 15분간 분쇄하고 50℃ 오븐에서 약 24시간 동안 건조하였다. 분석은 경상국립대학교 공동실험실습관의 X-선 회절분석기(X-ray diffractometer (XRD); Bruker D8 Advance A25)를 이용하여 40 kV, 40 mA, 4-70°(2θ) 구간에 주사간격 0.02°, 각 스텝당 주사시간 0.2초, 니켈필터를 이용한 구리 파장의 X-선 조건에서 수행하였다. 결과의 정성분석에는 Bruker AXS Diffrac Eva 프로그램을 이용하였다.
4. 변형띠의 산상, 구조 및 물질
노두 상의 퇴적층은 대체로 반고결 상태로 존재하며, 사암, 자색 이암, 회색 이암 및 역암이 교호하며 나타난다(그림 2). 층리의 자세는 N40-50°W/35-40°SW이다. 적어도 수십 개 이상의 변형띠가 고각(>65°)의 경사로 퇴적층을 가로지르며 발달하며, 대부분의 변형띠는 겉보기 변위가 인지되므로 전단띠(shear deformation bands)에 해당된다. 아울러 상대적으로 폭이 넓고 연장성이 좋으며 단층활면이 발달한 세 개의 단층성 변형띠도 관찰된다(그림 2). 노두규모에서 빈번히 관찰되는 변형띠의 산상으로는 (1) 다수의 전단띠가 공액상(conjugate)으로 발달하는 점(그림 3a), (2) 수 mm-cm 폭을 보이는 하나의 변형띠가 다수로 분기(branching)한다는 점(그림 3b), (3) 층리를 따라 발달한 적색 혹은 암적색을 띠는 산화물 농집대가 변형띠 인근에서 휘어지거나 가로막히기도 하고 혹은 변형띠에 나란하게 발달한다는 점(그림 3c) 등을 들 수 있다. 이 장에서는 전단띠와 단층성 변형띠의 중규모 구조를 보다 상세하게 기술함과 함께 미규모에서의 구조 관찰 결과를 제시한다.

(a) Overview of the studied outcrop. (b) Schematic illustration of the studied outcrop showing the locations of studied deformation bands and the spatial distribution of sedimentary rocks. Many deformation bands are observed in the outcrop, but some notable deformation bands are only displayed. SDB: shear deformation band; FDB: faulted deformation band.

Outcrop photographs showing the representative field occurrence of deformation bands. (a) Conjugate deformation band sets (white arrows). (b) Branching of deformation bands (black arrows) from the faulted deformation band 1 (FDB1 in Fig. 2). (c) Oxide concentration zone near the faulted deformation band 2 (FDB2 in Fig. 2). The oxide concentration zone (white arrow) appears to be dragged near the deformation band (yellow arrow).
4.1 전단띠
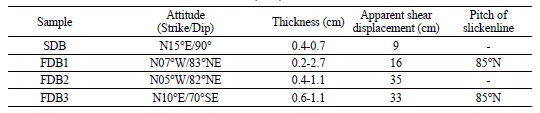
이 절에서는 다수의 전단띠 중 사암과 자색 이암 내에 발달한 전단띠(그림 2)를 상세 관찰한 결과를 기술한다. 관찰영역에서 전단띠는 여러 개가 서로 나란하거나 사교하며 약 0.4-0.7 cm 폭으로 발달한다(표 1; 그림 4a, 4b). 이 전단띠들에서는 단층활면과 단층조선이 발달하지 않아 정확한 변위는 알기 어려우며 약 9 cm의 정단층성 겉보기 전단변위만이 추정된다(표 1; 그림 4a, 4b). 동서 방향의 수직단면으로 제작한 슬랩 상에서 사암(SS)과 변형된 사암(DS), 자색 이암(PMS) 및 두 개의 전단띠(SDB)가 확인되는데, 전단띠와 사암, 전단띠와 자색 이암 사이의 경계는 굴곡져 있으며 사암보다 전단띠의 입자크기가 훨씬 작다(그림 4c). 적색 혹은 암적색의 산화물 농집대는 전단띠를 관통하지 못하고 휘어진 형태로 전단띠와의 경계부에서 종지된다(그림 4c). 이러한 특징들은 박편 관찰 과정에서 보다 명확하게 확인된다. 박편에서 사암은 약 1.1 mm 이상 크기의 아원형 석영, 장석 입자들과 점토광물들로 구성되고 중간정도의 분급(moderately sorted)을 보인다(그림 4d, 4e). 전단띠는 약 0.5 mm 이하 크기의 아각형 혹은 각형의 석영, 장석 입자들과 기질부를 이루는 점토광물들로 구성되고, Sibson (1977)과 Ballas et al. (2015)에서 제시한 단층암 파쇄분류에 따라 초기단계 파쇄변형(protocataclasis)의 특징을 보인다(그림 4f). 변형된 사암 영역은 약 0.7 mm 이하 크기의 아각형 석영, 장석 입자들과 기질부를 채우는 산화물 농집대로 구성된다(그림 4g). 변형된 사암은 모암과 비교했을 때, 상대적으로 작은 암편의 함량이 높고 보다 각진 입자들로 이루어져 있으며, 전단띠와 비교 시 상대적으로 큰 암편의 함량이 높을 뿐 아니라 파쇄변형의 흔적을 보이는 입자의 수도 훨씬 적다(그림 4d, 4f).

Characteristics of shear deformation bands (SDB) and faulted deformation bands (FDB).

Outcrop photograph (a) and schematic illustration (b) of the shear deformation bands (SDB). (c) Slab image of the boxed area in Fig. 4b. Two shear bands of about 0.4-0.7 cm width are observed. Both the shear band boundaries are rough. (d) Photomicrograph of the sandstone (SS) and SDB. Note that the shear bands are composed of finer grains than the SS. (e) Photomicrograph of the SS. (f) Photomicrograph of the SDB showing a protocataclasis structure. (g) Photomicrograph of the deformed sandstone (DS) showing its larger grain size and a smaller number of fractured grains than the SDB. PMS: purple mudstone; XPL: crossed-polarized light; PPL: plane-polarized light.
앞서 산화물 농집대라 명명한 영역을 대상으로 슬랩과 박편을 제작하여 관찰하였다. 농집대는 슬랩에서처럼 광학 현미경의 개방니콜 하에서도 적색 내지 암적색을 띠며(그림 4c, 5a), 전자현미경 관찰 결과, 기질부의 극세립질(ultrafine) 물질은 점토광물과 함께 상대적으로 밝게 보이는 입자들로 구성된다(그림 5b, 5c). 해당 위치의 에너지분산 X선 분광분석(EDS) 결과 철(Fe)의 함량이 높게 검출되는데, 이는 퇴적층의 특정 영역이 적색 내지 암적색으로 보이는 이유가 유체로부터 침전된 철산화물(혹은 철수산화물)이 상대적으로 농집된 것 때문임을 지시한다.

(a) Photomicrograph of the boxed area in Fig. 4c. The matrix of oxide concentration zone is composed of (dark) reddish materials. (b, c) Back-scattered electron (BSE) images of the boxed area in Fig. 5a, showing the ultrafine grains in the matrix. The reddish materials consist mainly of clay minerals and bright grains. (d) The energy-dispersive X-ray spectroscopy (EDS) data, obtained from the yellow-boxed area in Fig. 5c, show typical element peaks from smectite as well as high Fe peaks, which indicates the presence of smectite and Fe-oxides (or Fe-hydroxides). PPL: plane-polarized light.
4.2 단층성 변형띠
이 절에서는 약 16 cm의 겉보기 전단변위를 보이는 단층성 변형띠1(표 1; 그림 2의 FDB1)를 따라 단층활면이 인지되는 영역을 중심으로 관찰한 결과를 기술하였다. 이 단층성 변형띠는 사암 내에서 고각(83°)으로 발달하며, 0.2-2.7 cm의 폭을 보여 다른 다수의 전단띠에 비해 비교적 두껍다(표 1; 그림 6a). 변형띠에 발달하는 단층활면과 조선으로부터 좌수향 주향이동성분을 포함하는 정단층성 미끌림이 확인된다. 단층활면의 발달은 이미 변형띠가 단층으로 진화했음을 지시하므로 연구자에 따라 변형띠라는 용어가 아닌 단층으로 기술할 수 있으나, 이 논문에서는 그 구조가 변형띠에서 진화한 것임을 특정하는 의미로 ‘faulted deformation bands’를 우리말로 옮긴 ‘단층성 변형띠’라는 용어로 기술한다.

(a) Outcrop photograph of the faulted deformation band 1 (FDB1), which has a slickenside. Normal sense of shear with a minor sinistral strike-slip component is inferred. (b) Slab image of the FDB1. The boundaries between the deformed sandstone (DS) and the faulted deformation band (FDB) are curvy. In the FDB, one of the boundaries of the core, which has much finer grains than the neighboring areas, is very sharp (indicated by the blue arrow). (c) Overview of the microstructures of the FDB and its core (FDB core). (d) Photomicrograph showing a cataclasis structure in the FDB. (e) Photomicrograph of an ultracataclasis structure in the FDB core. The FDB core has a strong foliation (yellow arrow) and a much smaller grain size and content than the FDB. (f) Close-up view of the FDB core (boxed area in Fig. 6e; gypsum plate inserted). A ca. 100 μm-thick strongly foliated zone defined by the preferred orientation of clay minerals is inferred as a principal slip zone (PSZ) (black arrow). (g) Back-scattered electron (BSE) image of the boxed area in Fig. 6f. A strongly foliated zone is mainly composed of smectite, and the amount of quartz and feldspar grains is small. (h) BSE image, for the boxed area in Fig. 6g, showing a ca. 3-5 mm-thick Y-direction foliation (yellow arrow). XPL: crossed-polarized light; PPL: plane-polarized light; Qz: quartz; Kfs: K-feldspar; Sme: smectite.
슬랩 상에서는 변형된 사암(DS), 약 1.8 cm 폭을 보이는 백색의 단층성 변형띠(FDB), 약 0.2-0.5 cm 폭의 밝은 회색의 단층성 변형띠 핵(FDB core) 영역으로 구분되며, 단층성 변형띠 핵의 경계는 날카로운 직선형을 보이나 다른 경계들은 굴곡진 모습을 보인다(그림 6b). 또한 변형된 사암에서 단층성 변형띠쪽으로 갈수록 입자크기가 감소하는데(그림 6b), 이러한 특징은 광학 및 전자현미경을 통한 미구조 관찰에서도 확인된다(그림 6c-h). 단층성 변형띠 영역은 약 0.7 mm 이하 크기의 아원형 석영, 장석 입자들과 점토광물들로 구성되고 파쇄변형 조직을 보인다(그림 6c, 6d). 단층성 변형띠 핵 영역은 주로 점토광물들과 약 0.3 mm 이하 크기의 아원형 혹은 원형의 석영, 장석 입자들로 구성되며, 초파쇄변형 조직이 관찰된다(그림 6c, 6e). 변형띠 핵 내에서는 시료 제작과정 중 생긴 것으로 보이는 벌어진 틈이 있는데, 틈의 경계부를 따라 석영과 장석 입자 함량의 극적인 감소(그림 6e)와 더불어 점토광물들의 정향배열에 따른 엽리가 보이는 띠 모양의 영역이 약 100 µm 폭으로 나타난다(그림 6f). 이러한 구조적 특징은 전자현미경 관찰을 통해서도 잘 확인되며(그림 6g, 6h), 따라서 해당 영역은 대부분의 전단변위를 수용한 주미끌림대(PSZ)인 것으로 추정된다(그림 6f의 화살표). 점토광물들의 강한 정향배열을 보이는 영역은 주로 스멕타이트로 이루어져 있으며, 석영, 장석 입자의 함량은 비교적 낮은 것으로 관찰된다(그림 6g). 그리고 벌어진 틈과의 경계부를 따라 약 3-5 µm 폭의 Y-전단방향의 엽리가 관찰된다(그림 6h의 화살표).
단층성 변형띠2는 노두에서 약 35 cm의 겉보기 전단변위를 보이고(표 1; 그림 2의 FDB2), 사암 내에서 약 0.4-1.1 cm 폭으로 나타나며(표 1; 그림 7a, 7b), 노두와 슬랩상에서 특징적으로 흑색물질을 수반한다(그림 7a, 7b). 모암과의 서편 경계는 불규칙하게 굴곡진 반면, 동편 경계는 상대적으로 날카로운 직선형이다(그림 7b). 단층성 변형띠1과 같이 변형띠 내부에 핵을 포함하며, 변형된 사암(DS)과 이웃한다(그림 7b). 변형된 사암 밖으로는 모암인 사암(SS)이 나타난다. 사암은 주로 아각형의 석영 및 장석 입자들로 구성되며 중간정도의 분급을 보이는데, 몇몇 입자들에서 단열이 관찰되나 전체적으로 일차적인 사암 조직을 잘 보존하고 있다(그림 7c). 변형된 사암은 약 0.8 mm 이하 크기의 각진 석영 및 장석 입자들과 점토광물들로 구성되고 분급은 불량하며 초기단계 파쇄변형 조직을 보인다. 입자들의 크기와 함량은 사암에서보다 감소했으나 사암 조직은 남아있다(그림 7d). 단층성 변형띠는 점토광물들과 소량의 아원형 내지 아각형의 석영, 장석 입자들로 구성되고 파쇄변형조직을 보이며, 일차적인 사암 조직은 관찰되지 않는다(그림 7e의 FDB). 변형띠 핵은 주로 점토광물들로 이루어진 가운데 약 0.5 mm 이하 크기의 아원형 내지 원형의 석영 및 장석 입자들을 소량 포함하고 있고 전체적으로는 초파쇄변형 조직을 보인다(그림 7f의 FDB core). 변형띠 핵 내부에는 파쇄입자의 함량과 입자크기가 극적으로 감소하는 영역이 존재하며(그림 7f의 화살표), 광학현미경 관찰 시 약 20 µm 폭으로 점토광물들의 강한 정향배열이 확인된다(그림 8a). 전자현미경 관찰 결과, 주로 스멕타이트 초미세입자로 구성되어 있음이 확인되었다(그림 8b, 8c).

(a, b) Outcrop photograph and slab image of the faulted deformation band 2 (FDB2), respectively. The FDB2 shows a much smaller grain size than the deformed sandstone (DS). Thin bands of black materials (yellow arrow in Fig. 7a) are observed along the FDB. (c) Photomicrograph of the sandstone (SS), which preserves a primary sedimentary texture. (d) Photomicrograph of the DS showing a protocataclasis structure. (e, f) Photomicrographs of the faulted deformation band and its neighboring rock. The FDB has less grain content than the DS. The FDB shows a cataclasis structure, while the faulted deformation band core (FDB core) has an ultracataclasis structure. The FDB core has a well-foliated narrow zone (orange arrow). XPL: crossed-polarized light; PPL: plane-polarized light.

(a) Photomicrograph showing a strong preferred orientation of clay minerals in the faulted deformation band core (FDB core). Gypsum plated inserted. (b, c) Back-scattered electron (BSE) images of the boxed area in Fig. 8a. A ca. 15-20 μm-thick principal slip zone (PSZ; yellow arrows), where the grain content is significantly smaller than its surrounding parts, is observed in the FDB core. The PSZ is mainly composed of smectite. XPL: crossed-polarized light. Qz: quartz; Kfs: K-feldspar; Pl: plagioclase; Sme: smectite.
단층성 변형띠2에서 특징적으로 관찰되는 흑색물질은 변형띠 내 틈을 충전한 것처럼 보인다(그림 7a, 7b). 흑색물질은 광학현미경의 개방니콜 하에서 갈색을 띠는 부분과 흑색을 띠는 영역으로 구분되는데, 흑색을 띠는 물질의 일부가 마치 암편과 같은 형태로 갈색을 띠는 영역 내에 존재하기도 한다(그림 9a). 흑색을 띠는 물질은 전자현미경의 후방산란전자이미지(BSE)에서 망상(anastomosing) 조직을 보이며 갈색을 띠는 물질보다 밝게 보인다(그림 9b). 전자현미경 원소 맵핑 결과, 흑색 영역과 갈색 영역은 각각 망간(Mn)과 철(Fe)의 함량이 높은 것으로 확인된다(그림 9c, 9d). 이상의 관찰 결과와 (1) 모암에는 흑색물질을 구성하는 망간이 관찰되지 않는 점, (2) 흑색물질이 단층성 변형띠에 분포하는 스멕타이트보다 철의 함량이 높은 점을 바탕으로 흑색물질이 변형띠의 미끌림으로 발생한 팽창(dilation)으로 인해 생긴 공간을 따라 주입된 유체로부터 기원했음을 추론할 수 있다(e.g., Niwa et al., 2019). 변형띠 내 유체와 관련된 물질에 대한 상세 분석을 바탕으로 변형띠 내 물리 화학적 프로세스를 이해하는 것은 이번 연구의 범위를 벗어나는 것으로, 앞으로 별도의 연구에서 다뤄질 필요가 있다.

(a) Photomicrograph showing the black materials in the faulted deformation band core (FDB core) (see Fig. 7e for the location). The black materials are classified into a light brown zone and a black zone. (b) Back-scattered electron (BSE) image of the boxed area in Fig. 9a. The black zone looks brighter than the light brown zone. (c, d) Images of the element mapping conducted at the same area as (b). Manganese (Mn) and iron (Fe) are enriched in the black zone and the light brown zone, respectively. PPL: plane-polarized light.
단층성 변형띠3은 노두에서 약 33 cm의 겉보기 전단변위를 보이는 것으로(표 1; 그림 2의 FDB3), 변형띠 중 단층활면이 잘 보이는 영역에 대해 주로 관찰하였다. 변형띠는 사암 내에서 약 0.6-1.1 cm 폭으로 나타나고(표 1; 그림 10a의 FDB), 변형띠와 이를 둘러싼 변형된 사암과의 양쪽 경계는 모두 굴곡진 곡면 형태를 보인다. 단층활면에서 관찰한 단층조선의 자세와 노두면에서의 겉보기 변위는 변형띠를 따라 좌수향 주향이동성분을 포함하는 정단층성 미끌림이 있었음을 지시한다.

(a, b) Outcrop photograph and slab image of the faulted deformation band 3 (FDB3). The ~0.8-cm-wide FDB3 is surrounded by the deformed sandstone (DS) and has a core (FDB core). (c) Photomicrograph of the FDB3 showing that the grain size progressively decreases from the DS to the FDB core. (d) Close-up view of a very narrow zone showing a significant decrease in grain content and clay minerals' preferred orientation is identified (yellow arrow). (e) Back-scattered electron (BSE) image of the white-boxed areas in (d). Again, clast content is low in this zone. (f) BSE image of the boxed area in the inset of (d). A ca. 5-6 μm-thick principal slip zone (PSZ), mainly composed of smectite, is observed. XPL: crossed-polarized light. Qz: quartz; Sme: smectite.
암석 슬랩상에서 변형된 사암(DS)과 약 0.8 cm 폭을 보이는 백색의 변형띠(FDB) 및 약 0.5 cm 폭으로 밝은 회색을 띠는 단층성 변형띠 핵(FDB core)이 확인된다(그림 10b). 변형띠 핵은 변형띠 중심부에 위치하는데 관찰시료 제작 중 분리가 일어나면서 만들어진 것으로 추정되는 단열이 발달한다(그림 10b, 10c). 변형된 사암은 주로 약 1.6 mm 이상 크기를 보이는 아각형 내지 각형의 석영, 장석 입자들로 구성되나 소량의 점토광물들도 포함한다. 변형된 사암 내 입자들은 대체로 중간정도의 분급을 보이며 입자들의 크기는 변형띠 핵에 가까워질수록 감소한다(그림 10c). 변형띠는 약 1.3 mm 이상의 크기의 아각형 석영, 장석 입자들과 점토광물들로 구성되며 파쇄변형 조직을 보인다(그림 10c). 한편, 변형띠 핵은 주로 점토광물들과 약 0.5 mm 이하 크기의 석영, 장석 입자들로 구성되며, 내부에 초파쇄변형 조직이 발달하고 일차적인 사암 조직은 더 이상 확인되지 않는다(그림 10c). 변형띠 핵 내에는 약 5-6 µm 폭으로 파쇄입자의 함량이 매우 낮고 점토광물들의 강한 정향배열이 특징적인 영역이 존재한다(그림 10d). 해당영역에 가까워질수록 파쇄입자의 크기와 함량은 점진적으로 감소하고(그림 10e), 결과적으로 전단변위가 집중된 미규모의 주미끌림대(PSZ)로 추정된다. 전자현미경 관찰결과, 강한 정향배열을 보이는 점토광물들은 극세립질의 스멕타이트로 확인되었다(그림 10f).
4.3 단층성 변형띠와 사암의 광물조성
단층성 변형띠와 모암의 광물조성을 비교하기 위하여 앞서 언급된 3조의 단층성 변형띠와 그에 인접하는 사암을 대상으로 XRD 정성분석을 실시하였다(그림 11). 그 결과 사암은 공통적으로 석영, 사장석, K-장석 피크는 높은 반면 점토광물 피크는 낮게 나타났다. 반면 3조의 단층성 변형띠 경우, 사암과 비교해 사장석류와 K-장석류 피크는 낮으나 스멕타이트 피크가 높게 나타났다. 이러한 분석 결과는 앞선 미규모 관찰에서 변형띠 내부에 점토광물 함량이 증가한 것과 일치한다.

(a) X-ray diffraction patterns of the power specimens taken from the faulted deformation bands (FDB-DB) and their neighboring sandstones (FDB-SS). Note that the FDB-SS specimens are mainly quartz and feldspar, whereas the FDB-DB specimens are composed of quartz and smectite. (b) Close-up view of the boxed area in (a).
5. 토의 및 결론
본 연구에서는 변형띠가 발달하는 마이오세 어일분지 퇴적층에 대한 노두규모에서 미규모까지의 구조관찰 및 물질분석을 통하여 서로 다른 발달 정도(전단띠와 단층성 변형띠의 폭, 겉보기 변위량, 파쇄 정도, 미끌림면 유무의 차이)를 보이는 변형띠의 산상과 구조적, 물질적 특성을 파악 및 비교하였다.
연구대상 노두의 상세관찰 결과, 모암인 반고결 사암으로부터 약하게 변형된 사암과 전단띠 또는 단층성 변형띠로 점이적으로 변화하는데, 이는 사암에서 시작된 변형이 계속 진행됨에 따라 전단띠로 발달하거나 그 일부는 더 큰 전단변형을 수용하면서 단층성 변형띠로 진화하였음을 지시한다. 이와 관련한 두 가지 질문은 (1) 전단띠의 폭이 전단응력변형의 누적에 따라 증가하는 이유와 (2) 미끌림면을 갖지 않는 전단띠로부터 미끌림면을 갖는 단층성 변형띠로의 진화과정에 관한 것이다. 위에서 언급된 전단응력변형은 변형띠의 생성에서 단층으로의 발달까지 발생한 모든 변형이력(deformation history)을 포함하며, 전단응력변형 사건의 횟수나 시기를 특정하지 않는다.
모암과 전단띠의 가장 두드러진 미구조적(또는 조직적) 차이는 전단띠 내 입자가 모암 내 입자에 비해 더 작고 각진 형태를 갖는다는 점이다. 이는 다공질 물질에 전단력이 작용하는 과정에서 입자의 회전과 재배치가 발생하고 입자간 접촉부에서의 응력집중(stress concentration)으로 인하여 파쇄작용이 효과적으로 발생하였음을 의미한다(Aydin, 1978; Zhang et al., 1990; Schultz, 2019). 변위량이 제한적인 전단띠의 경우, 초기단계 파쇄변형 조직이 특징적이다. 그 전단띠를 따라 전단응력변형이 계속되면 전단띠 내 공극은 작게 파쇄된 입자들로 점차 더 채워지고 다져지는데, 이로 인해 나타나는 공극률과 입자크기의 감소, 각진 파쇄입자의 함량 증가는 추가적인 변형을 위해서 더 큰 응력을 요구하는 거동, 즉 응력변형강화(strain hardening)를 야기하는 것으로 알려져 있다(Antonellini et al., 1994; Gu and Wong, 1994; Kaproth et al., 2010; Schultz, 2019). 이러한 응력변형강화 거동은 추가적인 변형이 기존의 변형띠를 따라 발생하기 보다는 더 낮은 응력조건에서 변형이 가능한 변형띠 인접 물질쪽에서 새롭게 개시될 수 있도록 한다. 이에 따라 야기된 변형영역의 이동(shift)이 이번 연구에서 관찰된 전단띠 폭의 증가에 대한 한가지 설명이 될 수 있다고 판단하며, 이후 실험연구를 통해 역학적 거동 및 미구조적 진화의 상관관계를 살펴봄으로써 이러한 설명이 타당한지를 확인할 필요가 있다.
계속된 전단변형으로 넓어진 폭을 갖는 전단띠에서 미끌림면을 갖는 단층성 변형띠로의 진화와 관련하여, 전단띠와는 달리 단층성 변형띠에서는 사암에서부터 단층성 변형띠로 갈수록 입자의 크기와 함량이 점진적으로 감소하는 것뿐 아니라 점토광물 함량이 증가함이 미구조 관찰을 통해 확인되며 장석류 함량은 감소하고 스멕타이트 함량은 증가하는 점도 X-선 회절분석을 통해 입증된다(그림 4d, 6c, 7e, 11). 단층성 변형띠 내에는 초파쇄변형 조직을 보이는 핵과 그 핵 내에서도 파쇄된 입자의 함량이 매우 낮고 주로 스멕타이트로 구성된 수 µm에서 수십 µm 폭의 주미끌림대가 확인된다(그림 6f, 8c, 10f). 이상의 관찰결과로 보아 기본적으로 극심한 입자크기 감소를 보이는 초파쇄변형 조직과 점토광물(스멕타이트)의 형성이 전단띠 내 미끌림면 발달에 중요하게 기여하는 요인인 것으로 판단되나 구체적으로 미규모에서 어떠한 메커니즘에 의해 미끌림면이 발달하는지에 대해서는 확실치 않으므로 추가적인 연구, 특히 실험관찰이 필요해 보인다.
전단띠에서 초기단계 파쇄변형에 의한 입자크기의 감소가 응력변형강화 거동을 야기하여 변형띠 폭 증가의 원인이 될 수 있다는 점을 앞에서 토의했지만(Schultz, 2019) 석영입자들의 초파쇄변형에 의한 초미세 또는 나노입자들의 형성은 오히려 전단변형 국지화를 야기할 수 있다는 실험결과가 보고된 바 있다(Scuderi et al., 2017). 이는 입자크기의 감소가 변형띠 진화의 어느 단계까지는 변형의 폭을 증가시키는 역할을 하지만 초미세입자를 형성시키는 파쇄변형이 작동하면 변형의 국지화를 가져올 수 있음을 암시한다. 아울러, 이는 미끌림면의 발달에 있어 점토광물의 존재가 항상 요구되는 것은 아님을 보여주는데, 연구지역 모암에 대한 우리의 예비실험 결과에서도 확인된다(Han, R. et al., unpublished). 한편, 선행 연구들에서 제시되었던 초파쇄작용과 국지화된 미끌림면 발달 사이의 상관관계(e.g., Aydin and Johnson, 1978; Shipton and Cowie, 2001; Fossen et al., 2007) 외에도 추가적으로 변형띠의 광물학적 특성에 기반한, 다시 말해 변형띠를 주로 구성하는 점토광물의 존재가 미끌림면 발달에 어떠한 방식으로 영향을 끼칠 수 있는지에 대해 논하고자 한다. 우선, 주미끌림대를 따라 스멕타이트가 존재한다는 관찰결과는 전단띠의 진화 및 마찰특성과 관련하여 무엇을 암시하는가? 첫째, 기계적 파쇄에 의한 입자크기 감소 이후 파쇄입자와 물의 반응에 따른 광물학적 변화(점토광물의 형성)가 뒤따랐음을 보여준다. 둘째, 스멕타이트의 형성 또한 전단띠 내에서의 미끌림 국지화에 긍정적인 영향을 미쳤음을 지시한다. 스멕타이트는 물에 젖은 상태에서 매우 낮은 마찰강도를 갖는 물질이므로(Ikari et al., 2007; Morrow et al., 2017) 스멕타이트의 존재는 전단띠를 따라 낮은 전단저항 하에서의 미끌림이 가능했음을 추정케 한다. 스멕타이트에 대한 마찰강도의 속도의존성(즉, 마찰이 속도 증감에 따라 어떻게 변화하는지의 특성)에 대해서는 아직까지 정확하게 밝혀지지 않았지만, 단층성 변형띠 핵 내 주로 스멕타이트로 이루어진 영역에서 수 µm에서 수십 µm 폭으로 미끌림이 국지화된 구조가 발견되는 점은 주목할 만 하다. 좁은 폭으로 발달하는 변형 국지화구조는 일반적으로 속도약화거동을 보이는 물질에서 특징적이라는 점을 고려할 때(Verberne et al., 2013, 2014; Ikari, 2015), 단층성 변형띠 내 스멕타이트로 구성된 주미끌림대 또한 그러한 마찰거동을 보였을 것으로 추정할 수 있다. 이러한 측면은 점토광물을 포함한 현장 물질 시료를 대상으로 한 전단실험 연구(e.g., Woo and Han, 2019)를 통해 확인되어야 할 부분이다.
이번 연구를 통해, 전단띠에 전단변형이 누적될 때 전단띠 폭이 증가하며, 그 중 일부는 미끌림면이 발달한 단층성 변형띠로 진화함을 확인하였다. 단층성 변형띠의 미끌림면은 파쇄변형에 의해 만들어진 초미세입자들과 점토광물(특히, 스멕타이트)들로 구성된 주미끌림대에 대응되는 구조이다. 단층성 변형띠 내 주미끌림대의 스멕타이트는 변형띠가 매우 낮은 전단저항 하에서도 미끌릴 수 있도록 하는 등 변형띠의 마찰특성을 지배하였을 것으로 보인다. 앞에서 언급하였듯이 이번 연구는 초기단계의 전단띠에서 성숙한 단층성 변형띠로의 구조적, 역학적 진화 모델 구축을 위한 기초연구의 의미를 가지며 이후에는 변형띠의 모암을 대상으로 한 체계적인 실험연구가 뒤따라야 한다. 아울러, 본 연구결과는 활성단층 미끌림과 관련한 미고결 퇴적층의 변형 및 구조적 진화(주미끌림대의 형성 등)를 이해하는 연구(e.g., Cashman et al., 2007; Han et al., 2020; Park et al., 2020) 등에서 활용될 수 있을 것으로 보인다.
Acknowledgments
이 연구는 기상청 기상·지진See-At기술개발연구(KMI2018-01710)의 지원과 2020년도 정부(과학기술정보통신부)의 재원으로 한국연구재단의 지원을 받아 수행되었습니다(No. 2019R1A2C1008082). 야외조사 및 물질분석 등에서 도움을 준 한국지질자원연구원 김창민박사, 경상국립대 구도희 대학원생에게 감사드립니다. 원고의 세심한 검토를 통해 유익하고 건설적인 의견 제시로 논문의 질적 향상에 큰 도움을 주신 두 분의 심사위원께 감사드립니다.
References
-
Antonellini, M., Aydin, A. and Pollard, D.D., 1994, Microstructure of deformation bands in porous sandstones at Arches National Park, Utah. Journal of Structural Geology, 16, 941-959.
[https://doi.org/10.1016/0191-8141(94)90077-9]

-
Aydin, A., 1978, Small faults formed as deformation bands in sandstone. Pure and Applied Geophysics, 116, 913-930.
[https://doi.org/10.1007/BF00876546]
- Aydin, A. and Johnson, A.M., 1978, Development of faults as zones of deformation bands and as slip surfaces in Sandstone. Pure and Applied Geophysics, 116, 931-942.
-
Aydin, A. and Johnson, A.M., 1983, Analysis of faulting in porous sandstones. Journal of Structural Geology, 5, 19-31.
[https://doi.org/10.1016/0191-8141(83)90004-4]
-
Ballas, G., Fossen, H. and Soliva, R., 2015, Factors controlling permeability of cataclastic deformation bands and faults in porous sandstone reservoirs. Journal of Structural Geology, 76, 1-21.
[https://doi.org/10.1016/j.jsg.2015.03.013]
-
Ballas, G., Soliva, R., Sizun, J.-P., Fossen, H., Benedicto, A. and Skurtveit, E., 2013, Shear-enhanced compaction bands formed at shallow burial conditions; implications for fluid flow (Provence, France). Journal of Structural Geology, 47, 3-15.
[https://doi.org/10.1016/j.jsg.2012.11.008]
- Blenkinsop, T.G., 2000, Deformation Microstructures and Mechanisms in Minerals and Rocks. Kluwer Academic Publishers, Dordrecht, 150 p.
-
Cashman, S.M., Baldwin, J.N., Cashman, K.V., Swanson, K. and Crawford, R., 2007, Microstructures developed by coseismic and aseismic faulting in near-surface sediments, San Andreas fault, California. Geology, 35, 611-614.
[https://doi.org/10.1130/G23545A.1]
-
Choi, J.-H., Kim, Y.-S., Gwon, S., Edwards, P., Rezaei, S., Kim, T. and Lim, S.-B., 2015, Characteristics of large-scale fault zone and Quaternary fault movement in Maegok-dong, Ulsan. The Journal of Engineering Geology, 25, 485-498 (in Korean with English abstract).
[https://doi.org/10.9720/kseg.2015.4.485]
-
Du Bernard, X., Eichhubl, P. and Aydin, A., 2002, Dilation bands: a new form of localized failure in granular media. Geophysical Research Letters, 29, 2176-2179.
[https://doi.org/10.1029/2002GL015966]
-
Dunn, D.E., Lafountain, L.J. and Jackson, R.E., 1973, Porosity dependence and mechanism of brittle fracture in sandstone. Journal of Geophysical Research, 78, 2403-2417.
[https://doi.org/10.1029/JB078i014p02403]
-
Eichhubl, P., Hooker, J. and Laubach, S.E., 2010, Pure and shear-enhanced compaction bands in Aztec Sandstone. Journal of Structural Geology, 32, 1873-1886.
[https://doi.org/10.1016/j.jsg.2010.02.004]
-
Exner, U. and Tschegg, C., 2012, Preferential cataclastic grain size reduction of feldspar in deformation bands in poorly consolidated arkosic sands. Journal of Structural Geology, 43, 63-72.
[https://doi.org/10.1016/j.jsg.2012.08.005]
-
Fossen, H., 2010, Structural Geology. Cambridge University Press, New York, 463 p.
[https://doi.org/10.1017/CBO9780511777806]
-
Fossen, H. and Hesthammer, J., 1997, Geometric analysis and scaling relations of deformation bands in porous sandstone. Journal of Structural Geology, 19, 1479-1493.
[https://doi.org/10.1016/S0191-8141(97)00075-8]
-
Fossen, H., Schultz, R.A., Shipton, Z.K. and Mair, K., 2007, Deformation bands in sandstone: a review. Journal of the Geological Society of London, 164, 755-769.
[https://doi.org/10.1144/0016-76492006-036]
-
Fossen, H., Schultz, R.A. and Torabi, A., 2011, Conditions and implications for compaction band formation in the Navajo Sandstone, Utah. Journal of Structural Geology, 33, 1477-1490.
[https://doi.org/10.1016/j.jsg.2011.08.001]
-
Gu, Y. and Wong, T.-F., 1994, Development of shear localization in simulated quartz gouge: effect of cumulative slip and gouge particle size. Pure and Applied Geophysics, 143, 387-423.
[https://doi.org/10.1007/BF00874336]
-
Gwon, S. and Kim, Y.-S., 2017, Paleostress reconstruction using fault-slip data from drill core: Application to the interpretation of the Quaternary faulting events in SE Korea. Journal of the Geological Society of Korea, 53, 193-206 (in Korean with English abstract).
[https://doi.org/10.14770/jgsk.2017.53.1.193]
-
Han, R., Kim, C.-M., Woo, S., Jeong, G.Y. and Hirose, T., 2020, Structural records and mechanical characteristics of seismic slip along an active fault crosscutting unconsolidated Quaternary sediments: Suryum fault, SE Korea. Geosciences Journal, 24, 379-389.
[https://doi.org/10.1007/s12303-019-0037-4]
-
Heynekamp, M.R., Goodwin, L.B., Mozley, P.S. and Haneberg, W.C., 1999, Controls on fault zone architecture in poorly lithified sediments, Rio Grande Rift, New Mexico: implications for fault zone permeability and fluid flow. In: Haneberg, W.C., Mozley, P.S., Moore, C.J. and Goodwin, L.B. (eds.), Faults and Subsurface Fluid Flow. Geophysical Monograph, American Geophysical Union, 113, 27-49.
[https://doi.org/10.1029/GM113p0027]
- Hong, N.-R. and Lee, H.-K., 2012, Structural features and ESR dating of the Keumwang fault at Eumseong-gun, Chungcheongbuk-do. Journal of the Geological Society of Korea, 48, 473-489 (in Korean with English abstract).
-
Ikari, M.J., 2015, Principal slip zones: Precursors but not recorders of earthquake slip. Geology, 43, 955-958.
[https://doi.org/10.1130/G37028.1]
-
Ikari, M.J., Saffer, D.M. and Marone, C., 2007, Effect of hydration state on the frictional properties of montmorillonite‐based fault gouge. Journal of Geophysical Research: Solid Earth, 112, B06423.
[https://doi.org/10.1029/2006JB004748]
- Jang, B.-G. and Lee, H.-K., 2012, Structural features of fault rocks developed in the Keumwang Fault at Hakgok-ri, Hoengseong-gun, Gangwon-do. Journal of the Geological Society of Korea, 48, 11-26 (in Korean with English abstract).
-
Kaproth, B.M., Cashman, S.M. and Marone, C., 2010, Deformation band formation and strength evolution in unlithified sand: the role of grain breakage. Journal of Geophysical Research: Solid Earth, 115, B12103.
[https://doi.org/10.1029/2010JB007406]
-
Kim, C.-M., Jeong, J.O., Gu, D. and Han, R., 2017, Identification of materials in principal slip zones of faults by X-ray diffraction analysis using a small amount of sample. Journal of the Geological Society of Korea, 53, 873-883 (in Korean with English abstract).
[https://doi.org/10.14770/jgsk.2017.53.6.873]
-
Kwon, C.W., Jeong, J.O. and Sohn, Y.K., 2011, Sedimentary records of rift to pull-apart tectonics in the Miocene Eoil Basin, SE Korea. Sedimentary Geology, 236, 256-271.
[https://doi.org/10.1016/j.sedgeo.2011.01.011]
-
Lothe, A.E., Gabrielsen, R.H., Bjørnevoll-Hagen, N. and Larsen, B.T., 2002, An experimental study of the texture of deformation bands: effects on the porosity and permeability of sandstones. Petroleum Geoscience, 8, 195-207.
[https://doi.org/10.1144/petgeo.8.3.195]
-
Mair, K., Elphick, S. and Main, I., 2002a, Influence of confining pressure on the mechanical and structural evolution of laboratory deformation bands. Geophysical Research Letters, 29, 1410.
[https://doi.org/10.1029/2001GL013964]
-
Mair, K., Frye, K.M. and Marone, C., 2002b, Influence of grain characteristics on the friction of granular shear zones. Journal of Geophysical Research: Solid Earth, 107(B10), 2219.
[https://doi.org/10.1029/2001JB000516]
-
Mair, K., Main, I. and Elphick, S., 2000, Sequential growth of deformation bands in the laboratory. Journal of Structural Geology, 22, 25-42.
[https://doi.org/10.1016/S0191-8141(99)00124-8]
-
Morrow, C.A., Moore, D.E. and Lockner, D.A., 2017, Frictional strength of wet and dry montmorillonite. Journal of Geophysical Research: Solid Earth, 122, 3392-3409.
[https://doi.org/10.1002/2016JB013658]
-
Nicol, A., Childs, C., Walsh, J.J. and Schafer, K.W., 2013, A geometric model for the formation of deformation band clusters. Journal of Structural Geology, 55, 21-33.
[https://doi.org/10.1016/j.jsg.2013.07.004]
-
Niwa, M., Shimada, K., Ishimaru, T. and Tanaka, Y., 2019, Identification of capable faults using fault rock geochemical signatures: A case study from offset granitic bedrock on the Tsuruga Peninsula, central Japan. Engineering Geology, 260, 105235.
[https://doi.org/10.1016/j.enggeo.2019.105235]
-
Park, H.-J., Han, R. and Gu, D., 2020, Structures and deformation characteristics of the active fault, Hwalseongri area, Gyeongju, Korea. Journal of the Geological Society of Korea, 56, 703-726 (in Korean with English abstract).
[https://doi.org/10.14770/jgsk.2020.56.6.703]
-
Pizzati, M., Balsamo, F. and Storti, F., 2020, Displacement-dependent microstructural and petrophysical properties of deformation bands and gouges in poorly lithified sandstone deformed at shallow burial depth (Crotone Basin, Italy). Journal of Structural Geology, 137, 104069.
[https://doi.org/10.1016/j.jsg.2020.104069]
-
Rotevatn, A., Torabi, A., Fossen, H. and Braathen, A., 2008, Slipped deformation bands: a new type of cataclastic deformation bands in Western Sinai, Suez rift, Egypt. Journal of Structural Geology, 30, 1317-1331.
[https://doi.org/10.1016/j.jsg.2008.06.010]
-
Sample, J.C., Woods, S., Bender, E. and Loveall, M., 2006, Relationship between deformation bands and petroleum migration in an exhumed reservoir rock, Los Angeles Basin, California, USA. Geofluids, 6, 105-112.
[https://doi.org/10.1111/j.1468-8123.2005.00131.x]
-
Schultz, R.A., 2019, Geologic Fracture Mechanics. Cambridge University Press, UK, 608 p.
[https://doi.org/10.1017/9781316996737]
-
Schultz, R.A. and Siddharthan, R., 2005, A general framework for the occurrence and faulting of deformation bands in porous granular rocks. Tectonophysics, 411, 1-18.
[https://doi.org/10.1016/j.tecto.2005.07.008]
-
Scuderi, M.M., Collettini, C., Viti, C., Tinti, E. and Marone, C., 2017, Evolution of shear fabric in granular fault gouge from stable sliding to stick slip and implications for fault slip mode. Geology, 45, 731-734.
[https://doi.org/10.1130/G39033.1]
-
Shipton, Z.K. and Cowie, P.A., 2001, Damage zone and slip-surface evolution over μm to km scales in high-porosity Navajo sandstone, Utah. Journal of Structural Geology, 23, 1825-1844.
[https://doi.org/10.1016/S0191-8141(01)00035-9]
-
Sibson, R.H., 1977, Fault rocks and fault mechanisms. Journal of the Geological Society of London, 133, 191-213.
[https://doi.org/10.1144/gsjgs.133.3.0191]
-
Son, M., Kim, I.-S. and Sohn, Y.K., 2005, Evolution of the Miocene Waup basin, SE Korea, in response to dextral shear along the southwestern margin of the East Sea (Sea of Japan). Journal of Asian Earth Sciences, 25, 529-544.
[https://doi.org/10.1016/j.jseaes.2004.06.003]
-
Son, M., Seo, H.J. and Kim, I.-S., 2000, Geological structures and evolution of the Miocene Eoil basin, southeastern Korea. Geosciences Journal, 4, 73-88.
[https://doi.org/10.1007/BF02910128]
- Son, M., Song, C.W., Kim, M.-C., Cheon, Y., Jung, S., Cho, H., Kim, H.-G., Kim, J.S. and Sohn, Y.K., 2013, Miocene Crustal Deformation, Basin Development, and Tectonic Implication in the southeastern Korean Peninsula. Journal of the Geological Society of Korea, 49, 93-118 (in Korean with English abstract).
-
Sternlof, K.R., Karimi-Fard, M., Pollard, D.D. and Durlofsky, L.J., 2006, Flow and transport effects of compaction bands in sandstone at scales relevant to aquifer and reservoir management. Water Resources Research, 42, W07425.
[https://doi.org/10.1029/2005WR004664]
-
Torabi, A., Fossen, H. and Braathen, A., 2013, Insight into petrophysical properties of deformed sandstone reservoirs. American Association of Petroleum Geologists Bulletin, 97, 619-637.
[https://doi.org/10.1306/10031212040]
-
Trouw, R.A.J., Passchier, C.W. and Wiersma, D.J., 2010, Atlas of mylonites and related microstructures. Springer, New York, 322 p.
[https://doi.org/10.1007/978-3-642-03608-8]
-
Tueckmantel, C., Fisher, Q.J., Manzocchi, T., Skachkov, S. and Grattoni, C.A., 2012, Two-phase fluid flow properties of cataclastic fault rocks: implication for CO2 storage in saline aquifers. Geology, 40, 39-42.
[https://doi.org/10.1130/G32508.1]
-
Verberne, B.A., de Bresser, J.H.P., Niemeijer, A.R., Spiers, C.J., de Winter, D.A.M. and Plümper, O., 2013, Nanocrystalline slip zones in calcite fault gouge show intense crystallographic preferred orientation: Crystal plasticity at sub-seismic slip rates at 18-150℃. Geology, 41, 863-866.
[https://doi.org/10.1130/G34279.1]
-
Verberne, B.A., Spiers, C.J., Niemeijer, A.R., de Bresser, J.H.P., de Winter, D.A.M. and Plümper, O., 2014, Frictional Properties and Microstructure of Calcite-Rich Fault Gouges Sheared at Sub-Seismic Sliding Velocities. Pure and Applied Geophysics, 171, 2617-2640.
[https://doi.org/10.1007/s00024-013-0760-0]
-
Woo, S. and Han, R., 2019, Shear tests on intact fault gouges preserving natural deformation fabrics. Journal of the Geological Society of Korea, 55, 131-139 (in Korean with English abstract).
[https://doi.org/10.14770/jgsk.2019.55.1.131]
-
Zhang, J., Wong, T.-F. and Davis, D.M., 1990, Micromechanics of pressure-induced grain crushing in porous rocks. Journal of Geophysical Research: Solid Earth, 95, 341-352.
[https://doi.org/10.1029/JB095iB01p00341]