High-resolution stable isotope variations in a coral Porites lutea from the Wenno Island, Micronesia: Implications of low-latitude ocean environments
Abstract
The scleractinian coral (Porites lutea) collected near Wenno Island, tropical Micronesia in the South Pacific, was analyzed to investigate the stable oxygen and carbon isotope composition over the past 22 years. High-resolution isotope results clearly showed 22 cyclic annual variations (July 1985 to June 2007) even though seasonal variations in sea surface temperature (SST) is relatively small (< 2℃), which are consistent with an annually-banded skeleton in the coral. The interrelationships between in situ instrumental observation on SST, sea surface salinity (SSS), and stable oxygen isotope values generate the relatively strong negative and weak correlation curves (R2 = 0.77 for SST and 0.35 for SSS). Based on these investigations, coral isotopic amplitude suggests that the SST may reflect the local environment in a lagoon associated with low-latitude oceanography. Further, comparison with Niño-3/-4 SST anomalies (ONI index; Ocean Nino Index) suggests that the small island’s low-latitude environment has been influenced by El Niño Southern Oscillation (ENSO) events as well as local oceanographic environmental changes for the last 22 years. Therefore, our data combined with the previous result indicates that corals isotope from Micronesia provide low-latitude and local oceanographic environmental changes and can be used to speculate past atmospheric-oceanographic environmental changes across the wide area.
초록
남태평양 마이크로네시아 웨노섬에서 채집된 산호(Porites lutea)시료에 대해 과거 22년간에 걸쳐 산소 및 탄소의 안정동위원소를 분석하였다. 산소동위원소를 분석한 결과 표층 수온(SST)은 2℃ 미만의 계절 변화를 보이지만, 1985년 7월부터 2007년 6월까지 22년에 걸쳐 뚜렷한 주기적인 연 변화와 계절 변화를 보이고 있다. 시료가 채취된 지점 인근에서 기기관측으로 직접 수온(SST), 염분(psu) 변화를 2년동안 관측한 결과와 산소동위원소비율을 비교한 결과 수온과는 비교적 강한 음의 상관(R2=0.77)을 보이며, 염분과는 약한 양의 상관(R2=0.35)을 보인다. 이와 같이 산소동위원소의 주기적 변화는 계절 변화를 지시하는 수온 변화와 잘 일치하고 있어, 저위도의 지역적 해양환경변화와 밀접히 관련되어 있음을 지시한다. 또한 멀리 떨어진 해양관측지점인 Niño-3/-4에서 보고된 표층 수온 이상(SST anomaly) 기록과 비교한 결과, 과거 22년 동안 엘리뇨 남방진동(ENSO)의 영향과 지역해의 해양환경변화를 동시에 받은 것으로 해석된다. 따라서 이 연구가 수행된 저위도 마이크로네시아에서 얻어진 산호 시료에 대한 산소 및 탄소동위원소 기록은 해양-대기 간 저위도 지역의 해양환경변화와 지역의 환경변화에 대한 정보를 제공하고 있으며, 광범위한 지역의 해양환경변화를 연구하는데 유익할 것으로 판단된다.
Keywords:
coral, stable isotope, El Niño Southern Oscillation (ENSO), Western Pacific Warm Pool (WPWP), low-latitude키워드:
산호, 안정동위원소, 엘니뇨 남방진동, 서태평양 온난수역, 저위도1. Introduction
Massive Porites corals, common in tropical to temperate shallow seas provide a unique opportunity for understanding paleoclimatic and paleoceanographic variations as they contain a wide range of geochemical information in their skeleton (e.g., Gagan et al., 2000; Quinn and Sampson, 2002; Shimamura et al., 2008; Watanabe et al., 2014). Further, it is possible to track past seasonal and annual oceanographic and environmental changes through high-resolution study because corals have distinct annual banding. In particular, the isotope composition of stable oxygen (δ18O) in the coral skeleton is one of several powerful tracers that can track sea surface temperature (SST) and seawater δ18O composition (McConnaughey, 1989; Felis et al., 2000; Gagan et al., 2000); the latter is related to sea surface salinity (SSS) (Fairbanks et al., 1997; Morimoto et al., 2002). For this reason, numerous isotopic studies on coral skeletons have been conducted, and demonstrate paleoclimate and paleoceanographic records across various regions (e.g., Felis et al., 2000, 2009; Asami et al., 2004, 2005; Zinke et al., 2014).
Recent scientific concern regarding climate change adds impetus to the use of the coral skeleton to provide high-resolution information about the detailed variability beyond instrumental records (e.g., Gagan et al., 2000; Tudhope et al., 2001). In particular, the Western Pacific Warm Pool (WPWP) area is important because this area has the highest SST in the global ocean and, therefore, is a large source of latent heat that could affect highlatitudes. One of the most important atmosphericoceanographic phenomena, the El Niño Southern Oscillation (ENSO), is the best example of the energy balancing between the WPWP and other areas. Large number of coral studies attest to the potential importance of the WPWP to understand the pre-instrumental climatic and paleoceanographic history and its influences on the climate of East Asia and teleconnections on Middle East climate variability (Felis et al., 2000; Le Bec et al., 2000).
Even though many previous studies have shown the variability of the ENSO cycle in various area (e.g., Corrège et al., 2000; Asami et al., 2005; Chiang et al., 2010), little is known about low-latitude effects and the relationship between the ENSO cycle and local environmental changes near the edge of the WPWP. Furthermore, the eastern and western parts of the low latitude Pacific Ocean are well documented by the foraminiferal oxygen isotope and SST proxy showing that thermal gradients on both sides of the equatorial Pacific have been evolving throughout the Quaternary (de-Garidel-Thoron et al., 2005). Therefore, the variation of the equatorial Pacific, its influence on the edge area of WPWP and low-latitude region, and its linkage to oceanographic and climatic change still need to be investigated.
Here, we investigated the oxygen and carbon isotope composition in a coral Porites lutea and monitored environmental changes in the shallow regions of Micronesia where the samples were collected, which belong to the eastern part of the WPWP area. The purpose of this study is to reconstruct high-resolution coral isotopic composition and to evaluate the linkage between the coral records and low-latitude local environments associated with a global phenomenon such as ENSO.
2. Study Area and General Oceanography
The sampling area of Chuuk, belongs to the Federated States of Micronesia (FSM), is located in the low-latitudes, approximately at 7°3'N, 151°54'E, in the equatorial Pacific Ocean (Fig. 1). This site is on the eastern part of the WPWP and is placed inside of a famous atoll. The previous study indicates that the Chuuk Lagoon has been formed by volcanic activity including hot-spot origin during 14.8 to 4.3 Ma (Hafiz Ur et al., 2013), and it may reflect global-scale climate change and related oceanographic environments because it is situated in the low-latitude WPWP area with relatively shallow depths.
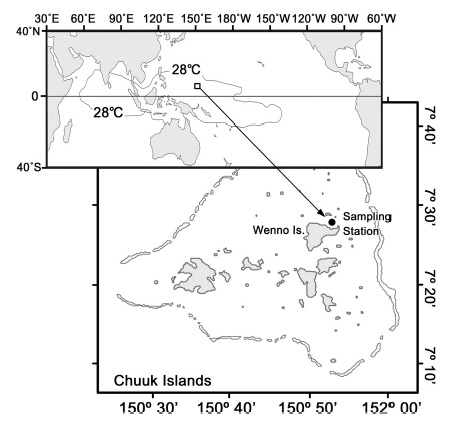
Map of the tropical Pacific Ocean and location of the study area, Wenno Island, in Micronesia. The thin line represents the Western Pacific Warm Pool (WPWP) area, and a black dot indicates sampling location of corals.
On the basis of in-situ instrumental observation by SBE 19 plus (Sea-Bird Electronics, Inc.), the variability of the temperature and salinity are not high. Temperature and salinity were ranged between 28.2 and 30.0℃, and between 33.4 and 34.3 psu, respectively. A relatively narrow range of temperature variation implies that this site belongs to the WPWP area. Previous works indicate that this WPWP area is characterized by oligotrophic oceanic conditions and by SSTs over 28℃ (Kawahata et al., 2000).
3. Samples and Analytical Methods
3.1 Coral sampling and subsampling
The skeletal core of modern living coral (Porites lutea) was collected near Wenno Island in tropical Micronesia, at 7°27'13.4”N, 151°54'6.5”E, on 30 June 2007 (Fig. 1). The coral sample was taken from about 3 m water depth using KIOST (Korea Institute of Ocean Science and Technology)’ self-produced drill instrument. After collecting samples, 3-mm-thick slabs were cut at the laboratory and soft X-radiographs were obtained (Fig. 2). The initial radiographs were used to identify annual density bands and to determine subsample for stable isotope analysis.
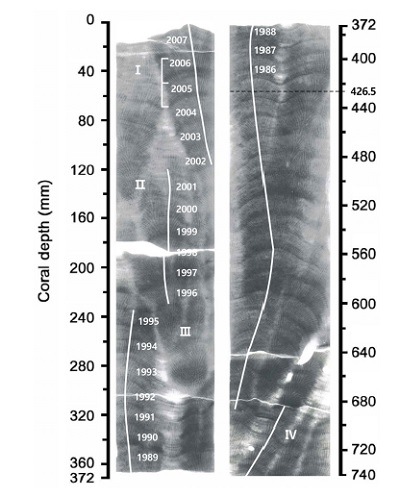
X-radiographic image of a coral skeleton (Porites lutea). Well-developed annual growth bands reveal alternating high-density (dark color, corresponds to summer) and low-density (light and winter time) intervals. One year is represented by a low- and high-density band pair. Thin white lines depict sampling transects for isotope analysis. 350 samples were taken coral top to 426.5 mm interval only.
Based on visual observation of the X-ray images, the rate of coral growth seems not constant and growth axes are variable. Therefore, a powder subsample was taken along the three sampling axis lines I, II, and III (Fig. 2) and then the respective overlap of ~1 year between two lines yield a continuous coral isotope record. A total of 350 samples were collected from the coral top to the coral length of 426.5 mm with intervals of 0.8-2.4 mm. The sampling resolution corresponds to 13-20 samples/year.
3.2 Oxygen and carbon isotope analysis and in situ measurement of SST and SSS
Stable oxygen (δ18Oc) and carbon isotope (δ13Cc) measurement of the coral skeleton were conducted using an automated Finnigan-MAT 251 gas ratio mass spectrometer at Ohio State University (OSU) of USA. Powdered samples were analyzed by Mass Spectrometry using a carbonate preparation system that reacts samples with 100% phosphoric acid at 70℃ for 10 min. Data were calibrated using an in-house calcite standard, and the international standard NBS-19 was run with each batch of samples to check the accuracy and precision of both δ13C and δ18O ratios. The analytical precision was reported as 0.02‰ VPDB for δ13C and 0.03‰ VPDB for δ18O, respectively.
For the comparison, we selected the previously published open data from the National Oceanic and Atmospheric Administration (NOAA) describing the neighboring area of Aulong (7°16’23’’N, 134°18’07’’E) and Drum Can Islands (7°17’44’’N, 134°24’24’’E) (Morimoto et al., 2002), and the temperate climate region Kikai Island (28°16′ to 28°22′ N and 129°55' to 130°02'E) (Moromoto et al., 2004). Also NOAA Optimum Interpolation (OI) SST data from nearby coral sampling point were collected from the NOAA physical science laboratory to comparison between δ18Oc and SST variability for 22 years. Detailed explanation about the isotopic similarities will be discussed in following Section 4.3.
The Korea Institute of Ocean Science and Technology (KIOST) has been collecting in situ SST and SSS data using conductivity, temperature, and depth (CTD) equipment (Seabird-25) for regular observation and comparison with other physical data. The CTD equipment had been deployed about 21 m meter water depth every week as a part of the KIOST’s program of monitoring ocean acidification. The collected in situ SST and SSS data were used to compare with oxygen and carbon isotope data of the studied coral. Instrumental data are available since September 2006.
3.3 Determination of coral chronology
Usually corals exhibit annual bands within their skeleton, which representing alternation of low-density (light color) and high-density (dark). Even though band width (growth rate) may be differed by various environmental factors such as temperature, one year is represented by a low- and high-density pair as shown Fig. 2. In this study, coral chronology of studied coral was determined by setting the maximum δ18Oc value in a given year equal to mid-February (consistent with the minimum SST), and minimum value equal to mid-September (consistent with the maximum SST). Therefore, we linearly interpolated between two fixed points for age determination. The resulting values were interpolated linearly to 15 to 20 values per year, providing a monthly resolution.
The strong δ18Oc cyclic variation was observed, and it was compared with annual band to determine the chronology of the coral, supporting consistent density banding pattern of low-density bend during winter and high-density band during summer. Regarding the high resolution sampling and seasonal growth rate, we assigned 22 year records from coral top to 426.5 mm depth (Fig. 2). To improve the data quality and enhance analytical accuracy, 37 samples were duplicated or triplicated and the averaged values were finally used.
4. Results and discussion
4.1 Isotope excursion, amplitude, and time-series variation
Oxygen (δ18Oc) and carbon (δ13Cc) isotope ratios of coral skeleton show cyclic seasonal variations, covering a growth history of 22 cycles from the bottom at the core depth of 42.65 cm to the top (Fig. 3). Also, the δ18Oc data is characterized by a large-scale variation with an amplitude of about 1‰. The highest ratios of δ18Oc (-5.22‰) occur at 178.98 mm, 271.57 mm, and 285.04 mm depths from the coral top; corresponding to February 1999, 1994, and 1993, respectively (Fig. 3). Also, the lowest ratio (-6.13‰) of δ18Oc occurs at 372.78 mm depth and the next lowest occur at 51.4 mm and 58.814 mm depths from the top, corresponding to early September 1987 and 2004, respectively. The general difference of δ18Oc between the highest and lowest values within a cycle is approximately 0.9‰, corresponding to about 3.5℃ SST difference when the δ18Oc was converted into a temperature scale based on previous research (Epstein et al., 1953; Jouzel et al., 1994). On the other hand, instrumental SST change is approximately 1.5℃ through a year, this means that the variation of the δ18Oc is influenced by both SST and seawater δ18O relating to SSS (Gagan et al., 2000). In fact, in situ monitored SSS clearly shows seasonal variations with an amplitude of about 0.8 psu (Fig. 4); this corresponds to 0.27‰ of seawater δ18O when using a relationship of Fairbanks et al. (1997).
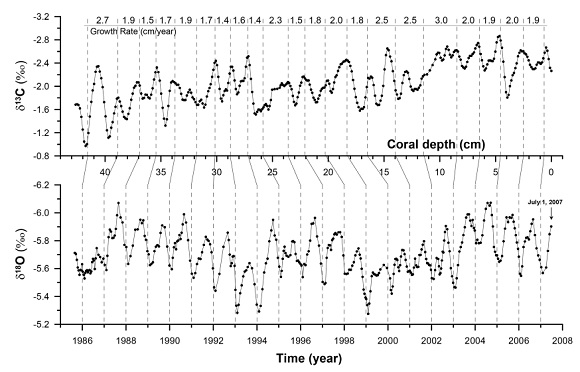
Stable oxygen and carbon isotope variation during the period from June 1985 to July 2007 with original coral depth (cm) in upper panel. Twenty-two cyclic variations are shown with high amplitudes. The whole depth was represented corresponding calendar year (lower panel).
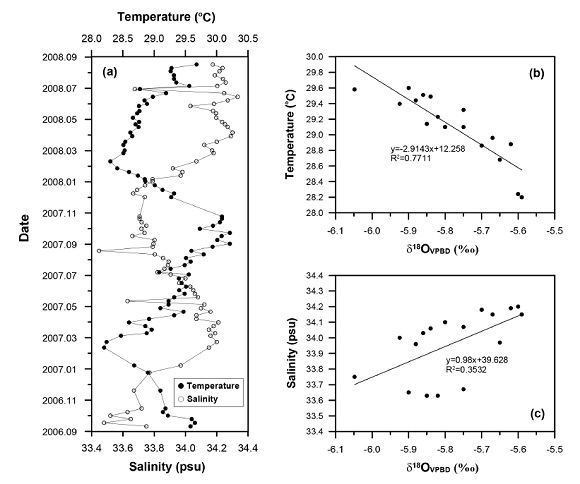
Variations of instrumental SST and SSS data from Sep 2006 to Sep 2008 (a) and relationship between stable oxygen isotope and SST (b) and SSS (c). Since the coral samples have annual band and growth rate, each subsamples taken within a year were calculated corresponding depth. Black and open circles are instrumental data of seawater temperature and salinity by CTD, respectively.
The δ13Cc ratio revealed high amplitude-cyclic variation that was similar to δ18Oc excursion (Fig. 3). It seems that there was approximately 1‰ difference, and depleted δ13Cc ratios were observed in 1994, 2005 and 2001 when δ18Oc had reached the maximum values. However, minima and maxima of δ13Cc ratios preceded those of δ18Oc ratios by about a month. This time lag between δ18Oc and δ13Cc ratio was also observed in Guam coral sample (Asami et al., 2004). Since the δ13Cc ratio is related with metabolic effect and kinetic effects that are directly linked with dissolved inorganic carbon (DIC) thus, the rate of coral growth and calcification in ambient water (Swart et al., 1996), the time lag between δ18Oc and δ13Cc might be arisen by the difference in utility of solar radiation, and nutrient availability.
As shown in Fig. 3, the δ18Oc ratio increased when the δ13Cc ratio was lower. The highest δ18Oc in a year occurs approximately every February and the lowest δ13Cc does not necessarily occur in a particular period. It indicates that the δ13Cc variation is related to several factors such as environmental and physiological effects: nutrients, solar radiation, δ13C of dissolved inorganic carbon (e.g., Swart et al., 1996). Therefore, the tendency differences in both isotopic excursions may be derived from the independent controlling factors, and these factors might explain the time lag between δ18Oc and δ13Cc.
As discussed, δ18Oc is usually controlled by temperature and δ18O of the ambient water. The 2-year monitoring showed that the annual lowest and highest SST reached about 28.2℃ in February and 30.2℃ in September, respectively, with a small seasonal amplitude of about 2℃. The monitored SSS data varied between 34.3 and 33.5 psu, with lower salinity occurring commonly in September-October. Weekly records of these instrumental SST and SSS were compared with δ18Oc as illustrated in Fig. 4. Based on the comparison between instrumental SST and SSS data and the δ18Oc ratio in the last two years, a strong negative correlation (R2 = 0.77, n = 17) in SST, a slightly lower positive correlation in SSS (R2 = 0.35, n = 17) were observed. This suggests that the coral δ18Oc composition is closely associated with ambient water SST and SSS (Figs. 4b and 4c).
The relatively strong negative relationship between SST and δ18Oc and weak positive relationship between SSS and δ18Oc were observed in this study (Figs. 4b and 4c). This numerical relationship among SST, SSS and δ18Oc of studied coral supports the general relationship among SST, SSS and oxygen isotope ratios in ambient sea water environments. Therefore, δ18Oc of analyzed coral data directly implies a seasonal variation of SST of the study area. Also the differences of heavier and lighter δ18Oc corresponding to lower and higher SST with slightly lower SST differences. A weak relationship between SSS and δ18Oc may have resulted from the offset SST variations.
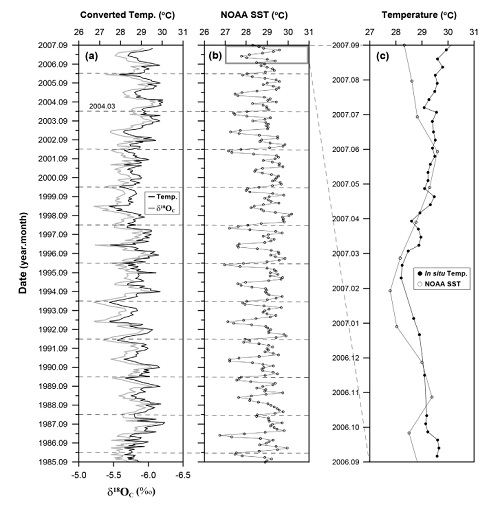
The relationship between coral δ18Oc and measured in situ SSTs revels a SST to coral isotope values as follow; SST (℃) = (-2.91×δ18Oc) + 12.258 (R2 = 0.77) (Fig. 4b). This formula does not show big differences to those determined by Gagan et al. (1994) for a Great Reef Porites, and by Boiseau et al. (1998) for a Moores Porites. Using this equation, we reconstructed SST (SSTcon.) for the 22 years, and compared with NOAA SST again (Figs. 5a and 5b). The NOAA SST and SSTcon. exhibits strong resemblance, suggesting the applicability of coral thermometry in the study area. Relatively good correlation between in situ temperature from study area and NOAA SST for a year may supports proxy of δ18Oc (Fig. 5c).
4.2 Linear skeleton extension (LSE) and its implications
The annual growth rate of linear skeleton extension (LSE) was determined based on the combination of soft X-ray photographs and annual signals from seasonal variations in δ18Oc (Fig. 3). The growth rate is quite variable, ranging from approximately 14 to 26.3 mm/year (av. 19.36 mm/ year). There were several reports on the coral growth rate and on the relationship between the instrumental SST and oxygen isotope of coral (Baker and Weber, 1975; Scoffin et al., 1992; Lough and Barnes, 2000; Asami et al., 2004). In their studies, the growth rate was closely related to coral calcification rate. This means that the variability of LSE in our study is associated with calcification rate of coral, further it was strongly related to local oceanographic environmental changes.
The highest LSE was observed in 2002, and the lowest LSE was observed in the 1992 and 1995 periods. The LSE observed at this site is generally higher than those in the Caribbean (6-12 mm/year), and very similar or slightly lower than those of the eastern Pacific (21-39 mm/year), even though the coral species is different (https://editors.eol.org/eoearth/wiki/coralgrowth). In the case of coral Porites lutea, the LSE is quite variable, differing from site to site. Extensive examination on LSE from 48 sites near the coast of Thailand clearly revealed a wide range of LSE variability from approximately 9.5 to 31 mm/year (Scoffin et al., 1992). They interpreted that the LSE is strongly associated with the calcification rate of the coral, the product of linear extension and skeletal bulk density. The hydraulic energy of the individual coral reef sites is the primary controller of the variation in LSE, which is inversely related with skeletal bulk density (Scoffin et al., 1992).
Usually, coral growth depends on sea temperature, irradiance, calcium carbonate saturation, turbidity, salinity, pH, nutrients (Shinn, 1966; Schenider and Smith, 1982; Hubbard and Scaturo, 1985; Shimamura et al., 2008), and climate changes (Al-Rousan et al., 2002). The levels of these components directly influence the physiological processes of photosynthesis and calcification of coral. In particular, coral growth is directly linked to the precipitation of the calcium carbonate skeleton in the form of aragonite. The rate of calcification is consequently controlled by the saturation state of carbonate ions in seawater. Thus, the concentration of carbon dioxide, which is dissolved in seawater as an acidic solution. However, the most important factors controlling the coral calcification are the surrounding SST and light availability, which eventually controls the environmental condition for coral growth (Lough and Barnes, 2000). Since the LSE is the most representative variable of coral calcification (Lough and Barnes, 2000), it is commonly compared with δ18O in regards to the local and global climatic events such as El Niño (e.g., Maier et al., 2004).
In the present study, the annual δ18Oc minima, i.e., the annual maximum temperatures, are not linearly in agreement with annual LSE as shown in Fig. 3. This means that annual LSEs may correspond to different environmental factors such as SSS and nutrients level of ambient seawater. In the whole scale, the LSE variation may reflect the decadal-scale in situ oceanographic variation. In this study, interval of small LSEs (i.e., less than 15 mm/year) correspond to the years of 1988, 1992, 1994 and 1996. Among these years, 1997-1998 arerecognized as El Niño years. Also, larger LES also appeared in higher water temperature as indicated in 2001 and 2002 yrs. Therefore, LSE variability might be related to the global scale ENSO signatures which affects the regional ocean environment in the study area.
4.3 Comparison with other coral sites and potential ENSO signal
As a coupled ocean-atmospheric interaction, ENSO is one of the most investigated climatic phenomena in low-latitude area. Because ENSO has played a crucial role in modulating global climate variation across the glacial-interglacial scale (Tudhope et al., 2001) and decadal timescale (e.g., Gu and Philander, 1997; Linsely et al., 2000), and also has widespread effects on the global climatic system and the ecology of the tropical ocean, its variability and uncertainty have been widely recognized based on past natural variations and its response, global warming (e.g., Correge et al., 2000; Latif and Keenlyside, 2009). For example, 10 years of SST observations by satellite clearly showed that the annual mean SST and size of the WPWP increased from 1983 to 1987. Yan et al. (1992) has interpreted this increase as a result of solar irradiance variability, ENSO events, and global warming. In a previous similar study, ENSO events were mostly and clearly recorded as SST signals in corals growing (Wellington and Dunbar, 1995).
Our isotopic data were compared with previous works of Morimoto et al. (2002, 2004) (Fig. 6). This Fig. 6 showed a coincident cyclic variation during 1991~1999, even though Kikai Island is located in the further northern part of the Pacific Ocean (more than 20°N). The isotopic excursion of the studied coral was strongly matched with those of Kikai even though the amplitude of δ18Oc our study is rather smaller than those of Kikai. Given that both δ18Oc is associated with latitude-dependence oceanic carbon chemistry, and ENSO phenomena influence on global climatic changes, the strong resemblance in both δ18Oc variation could be linked to global climatic and ocean environmental changes. The relatively small variation in δ18Oc duringthe years 1995 and 1996 in our study could be caused by a difference in the degree of SST seasonal variations to inter-annual variations.
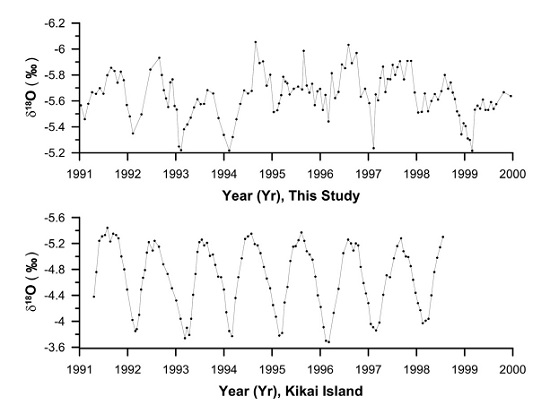
Comparison of oxygen isotope ratios of corals between this study and previous works in Kikai Island (Morimoto et al., 2002).
As illustrated in Figs. 6 and 7, those excursions of δ18Oc during 1991 to 1999 in Kikai Island, and 1998 to 200 in Aulong and Drum Can Islands show fairly good coincident variation with some inconsistency in fluctuation. Additionally, the δ18Oc variation in our study is roughly consistent with those in a Guam coral in the western tropical Pacific Ocean (Asami et al., 2004). There are δ18Oc amplitude differences among the Aulong, Drum Can Island and our study during 1988 to 2001. Considering the δ18Oc is dependent on various factors such as water temperature, carbonate ion and the degree of calcification, these δ18Oc differences may attribute to local oceanographic variation. Even though the δ18Oc excursion is slightly smooth in Aulong and Drum Can Island data (Morimoto et al., 2002), the initiating point toward lighter δ18Oc ratio shifting is quite synchronized. In Kikai Island, δ18Oc ratio is much heavier than other reference sites implying much colder temperature. Therefore, it is expected that ENSO may influence on the area of Kikai Island’s oceanographic environments across the Aulong and Drum Can Island even though direct comparison by SST anomaly were not conducted.
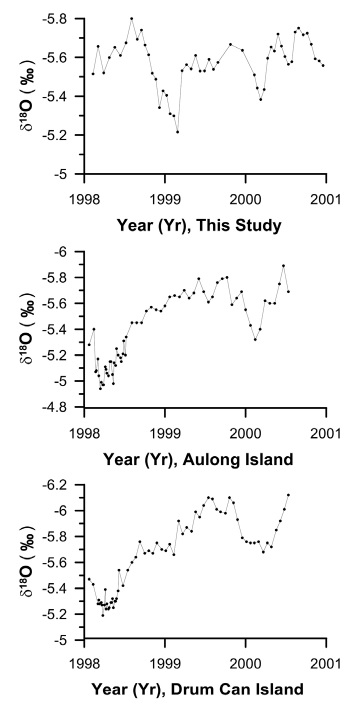
Comparison of oxygen isotope ratios of corals between this study and previous works in Aulong and Drum Can Islands (Morimoto et al., 2004).
To compare the ENSO effect, our SSTcon. data were normalized with average value for 22 years (28.86℃), and then expressed the difference value with respect to the averaged value as the SSTano(av.). This method is similar with NOAA’s SST anomaly, but it differs from in terms of normalized interval. The comparison with El Niño-3/-4 in the east-central Pacific is adjusted for 22 years as shown in Fig. 8 (Kaplan et al., 1998). The comparison between the SSTano(av.) of this study and the SSTAnomaly by NOAA is characterized by distinctive negative anomaly intervals occurred in several specific years such as 1995~1996, 1999~2000 yrs. On the whole, the entire phase variation between our data and El Niño-3/-4 were roughly analogous in 1987, 1997, 2002 and 2006 with positive anomaly. However, out of phase in two data sets occurred in 1989, 1991, 1992 and 2007.
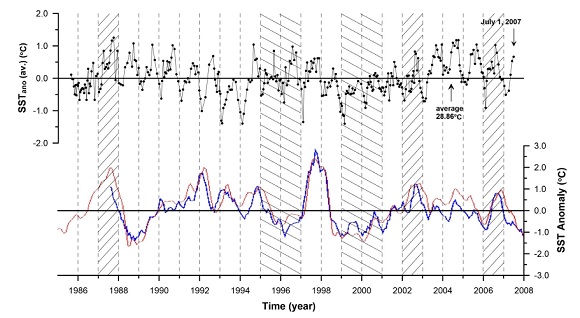
Comparison between the SST anomalies in El Niño-3 (blue) and -4 (red) regions (5°S-5°N, 170°W-120°W) and converted SST anomaly (SSTano(av.)) based on oxygen isotope signals. SSTano(av.) were averaged, and expressed by deviated value from average value as anomaly. Ocean Nino Index (ONI) was cited from http://bmcnoldy.rsmas.Miami.edu/tropics/oni/. ONI implies a standard metric to define the phase of the El Niño Southern Oscillation (ENSO). Distinctive negative anomalies were observed during 1995-1996, 1999-2000 years. ONI index was cited from http://bmcnoldy.rsmas.miani.edu/tropics/oni/.
In particular, negative anomalies occurred at 1995~1996, 1999~2000 in NOAA’ SST anomaly were roughly matched with our SSTano(av.) (Fig. 8). In between these two periods, there is a big positive anomaly during El Niño year of 1997~1998. Also, there are positive anomalies are shown during 1997, 2002 and 2006. Therefore, SSTano(av.) calculated by δ18Oc in our study resembles to NOAA’s SST anomaly implying that oceanographic condition of the study area may have been associated with global scale ENSO phenomenon. In detail, positive warm phase is shown during 1991-1994 by NOAA’s SSTanomaly, however our SSTano(av.) did not show coincident variation, indicating relatively colder conditions in our study area. Negative cold phase by NOAA’ s SST shown during a 1995-1996 ENSO cooling phase, but relatively smaller negative SSTano(av.) indicate a slightly warmer SST in our SSTano(av.). However, the signature of a strong ENSO cooling phase in 1999-2000 was well matched with our SSTano(av.).
Our Micronesian data are clearly distinguished negative SST anomalies from the averaged value between the 1995 and 1996, and 1999 and 2000. Also distinctive positive anomalies were observed during 1987, 2002 and 2006. These positive and negative anomalies are coincident with NOAA’s SST anomalies. Also, there are remarkable positive and negative anomalies of SST are commonly recognized during ENSO warm phase in the eastern and western Pacific Ocean (Asami et al., 2004). Therefore, the coincident δ18Oc variation between our data and NOAA’s SST may imply that the ENSO effect influences low-latitude oceanographic environments. In addition, our coral-isotopic data suggesting that the study area may reflect the global phenomenon superimposed onto the local oceanographic condition.
5. Conclusions
The hard coral Porites lutea was collected from Micronesia in the southern Pacific, and oxygen and carbon isotope (δ18Oc and δ13Cc) compositions were analyzed to track low-latitude paleoceanographic changes. X-radiographs clearly showed 22 pairs of annual growth bands with a wide range of variability of Linear Skeleton Extension (LSE) of coral. The δ18Oc and δ13Cc compositions of the coral showed cyclic variation indicating seasonal variation, and the amplitude of the composition reflected the oceanographic environmental changes. The comparison between instrumental SST and SSS and the δ18Oc composition of coral showed a fairly good negative correlation in SST and a weak relationship in SSS. In particular, an investigation of the annual LSE and its comparison to isotope results may manifest some environmental factors that influence the aragonite lattice. The result of the comparison between isotope results, and its converted SST and El Niño-3/-4 signals may reflect ENSO influences on study area. In particular, strong resemblance of negative SST anomalies between NOAA’ SSTanomaly and our SSTano(av.) during 1999-2000 yr ESSO phase were recognized. Therefore, the δ18Oc and δ13Cc composition of the coral from Micronesia can be used to evaluate past information concerning low-latitude and local ocean environmental changes.
Acknowledgments
We thank Dr. Noh, J.H. for his provide in situ instrumental SST and SSS data. Also, the author thanks Dr. Asami, Kochi University, Japan for his reviews and comments on earlier drafts of the manuscript, and the first author thanks anonymous reviewer for valuable comments to enhance the manuscript quality. This study was supported by Korea Institute of Ocean Science and Technology (KIOST) programs (PM57190) and K-IODP program (PM62120) in part.
References
-
Al-Rousan, S., Al-Monghrabi, S., Pätzold, J. and Wefer, G., 2002, Environmental and biological effects on the stable oxygen isotope records of corals in the northern Gulf of Aqaba, Red Sea. Marine Ecology Progress Series, 239, 301-310.
[https://doi.org/10.3354/meps239301]

-
Asami, R., Yamada, T., Iryu, Y., Meyer, C.P., Quinn, T.M. and Paulay, G., 2004, Carbon and oxygen isotope composition of a Guam coral and their relationships to environmental variables in the western Pacific. Palaeogeography, Palaeoclimatology, Palaeoecology, 212,1-22.
[https://doi.org/10.1016/S0031-0182(04)00301-3]

-
Asami, R., Yamada, T., Iryu, Y., Quinn, T.M., Meyer, C.P. and Paulay, G., 2005, Interannual and decadal variability of the western Pacific sea surface condition for the years 1787-2000: Reconstruction based on stable isotope record from a Guam coral. Journal of Geophysical Research: Oceans, 110
[https://doi.org/10.1029/2004JC002555]

-
Baker, P.A. and Weber, J.N., 1975, Coral growth rate: variation with depth. Earth and Planetary Science Letters, 27, 57-61.
[https://doi.org/10.1016/0012-821X(75)90160-0]

-
Boiseau, M., Juillet-Leclere, A., Yiou, P., Salvat, B., Isdale, P. and Guillaume, M., 1998, Atmospheric and oceanic evidences of El Niño-Southern Oscillation events in the south central Pacific Ocean from coral stable isotope records over the last 137 years. Paleoceanography and Paleoclimatology, 13, 671-685.
[https://doi.org/10.1029/98PA02502]

-
Chiang, H.W., Chen, Y.G., Fan, T.Y. and Shen, C.C., 2010, Change of the ENSO-related 18O-SST correlation from coral skeletons in northern South China Sea: A possible influence from the Kuroshio Current. Journal of Asian Earth Sciences, 39, 684-691.
[https://doi.org/10.1016/j.jseaes.2010.04.007]

-
Corrège, T., Delcroix, T., Récy, J., Beck, W., Cabioch, G. and Le Cornec, F., 2000, Evidence for stronger El Niño-Southern Oscillation (ENSO) events in a mid-Holocene massive coral. Paleoceanography and Paleoclimatology, 15, 465-470.
[https://doi.org/10.1029/1999PA000409]

-
de Garidel-Thoron, T., Rosenthal, Y., Bassinot, F. and Beaufort, L., 2005, Stable sea surface temperature in the western Pacific warm pool over the past 1.75 million years. Nature, 433, 294-298.
[https://doi.org/10.1038/nature03189]

-
Epstein, S., Buchsbaum, R., Lowenstam, H.A. and Urey, H.C., 1953, Revised carbonate-water isotopic temperature scale. Geological Society of America Bulletin, 64, 1315-1326.
[https://doi.org/10.1130/0016-7606(1953)64[1315:RCITS]2.0.CO;2]

-
Fairbanks, R.G., Evans, M.N., Rubenstone, J.L., Mortlock, R.A., Broad, K., Moore, M.D. and Charles, C.D., 1997, Evaluating climate indices and their geochemical proxies measured in corals. Coral Reefs, 16, S93-S100.
[https://doi.org/10.1007/s003380050245]

-
Felis, T, Pätzold, J., Loya, Y., Fine, M., Nawar, A.H. and Wefer, G., 2000, A coral oxygen isotope record from the northern Red Sea documenting NAO, ENSO, and North Pacific teleconnections on Middle East Climate variability since the year 1750. Paleoceanography and Paleoclimatology, 15, 679-694.
[https://doi.org/10.1029/1999PA000477]

-
Felis, T., Suzuki, A., Kuhnert, H., Dima, M., Lohmann, G. and Kawahata, H., 2009, Subtropical coral revels abrupt early-twentieth-century freshening in the western North Pacific Ocean. Geology, 37, 527-530.
[https://doi.org/10.1130/G25581A.1]

-
Gagan, M.K., Ayliffe, L.K., Beck, J.W., Cole, J.E., Druffel, E.R.M., Dunbar, R.B. and Schrag, D.P., 2000, New views of tropical paleoclimates from corals. Quaternary Science Reviews, 19, 45-64.
[https://doi.org/10.1016/S0277-3791(99)00054-2]

-
Gagan, M.K., Chivas, A.R. and Isdale, P.J., 1994, Highresolution isotopic records from corals using ocean temperature and mass-spawning chronometers. Earth and Planetary Science Letters, 121, 549-558.
[https://doi.org/10.1016/0012-821X(94)90090-6]

-
Gu, D. and Philander, S.G.H., 1997, Interdecadal climate fluctuations that depend on exchanges between the Tropics and Extratropics. Science, 275, 805-807.
[https://doi.org/10.1126/science.275.5301.805]

- Hafiz Ur, R., Hideo, N. and Kei, K., 2013, Geological origin of the volcanic Islands of the Caroline group in the Federated States of Micronesia, Western Pacific. South Pacific Studies, 33, 101-118.
- Hubbard, D.K. and Scaturo, D., 1985, Growth rates of seven species of Scleractinean corals from Cane Bay and Salt River, ST. CROIX, USVI. Bulletin of Marine Science, 36, 325-338.
-
Jouzel, J., Koster, R.D., Suozzo, R.J. and Ruwwell, G.L., 1994, Stable water isotope behavior during the last glacial mzximum: a general circulation model analysis. Journal of Geophysical Research: Atmospheres, 99, 25791-25801.
[https://doi.org/10.1029/94JD01819]

-
Kaplan, A., Cane, M.A., Kushnir, Y., Clement, A.C., Blumenthal, M.B. and Rajagopalan, B., 1998, Analyses of global sea surface temperature 1856-1991. Journal of Geophysical Research: Oceans, 103, 18567-18589.
[https://doi.org/10.1029/97JC01736]

-
Kawahata, H., Suauki, A. and Ohta, H., 2000, Export fluxes in the Western Pacific Warm Pool. Deep Sea Research Part I: Oceanographic Research Papers, 47, 2061-2091.
[https://doi.org/10.1016/S0967-0637(00)00025-X]

-
Maier, C., Felis, T., Pätzold, J. and Bak, R.P.M., 2004, Effect of skeletal growth and lack of species effects in the skeletal oxygen isotope climate signal within the coral genus Porites. Marine Geology, 207, 193-208.
[https://doi.org/10.1016/j.margeo.2004.03.008]

-
McConnaughey, T., 1989, 13C and 18O isotopic disequilibrium in biologic carbonates: I. Patterns. Geochim. Cosmochimica Acta, 53, 151-162.
[https://doi.org/10.1016/0016-7037(89)90282-2]

-
Morimoto, M., Abe, O., Kayanne, H., Kurita, N., Matsumoto, E. and Yoshida, N., 2002, Salinity records for the 1997-98 El Niño from Western Pacific corals. Geophysical Research Letters, 29
[https://doi.org/10.1029/2001GL013521]

-
Morimoto, M., Kitagawa, H., Shibata, Y. and Kayanne, H., 2004, Seasonal radiocarbon variation of surface seawater recorded in a coral from Kikai Island, subtropical Northeastern Pacific. Radiocarbon, 46, 643-648.
[https://doi.org/10.1017/S0033822200035694]

-
Latif, M. and Keenlyside, N.S., 2009, El Niño/Southern Oscillation response to global warming. Proceedings of the National Academy of Sciences, 106, 20578-20583.
[https://doi.org/10.1073/pnas.0710860105]

-
Le Bec, N., Juillet-Leclerc, A., Corrège, T., Blamart, D. and Delcroix, T., 2000, A coral δ18O record of ENSO driven sea surface salinity variability in Fiji (south-western tropical Pacific). Geophysical Research Letters, 27, 3897-3900.
[https://doi.org/10.1029/2000GL011843]

-
Linsley, B.K., Ren, L., Dunbar, R.B. and Howe, S.S., 2000, El Niño southern Oscillation (ENSO) and decadal-scale climate variability at 10°N in the eastern Pacific from 1893 to 1994: A coral-based reconstruction from Clipperton Atoll. Paleoceanography and Paleoclimatology, 15, 322-335.
[https://doi.org/10.1029/1999PA000428]

-
Lough, J.M. and Barnes, D.J., 2000, Environmental controls on growth of massive coral Porites. Journal of experimental marine biology and ecology, 245, 225-243.
[https://doi.org/10.1016/S0022-0981(99)00168-9]

-
Quinn, T.M. and Sampson, D.E., 2002, Multiproxy approach to reconstructing sea surface conditions using coral skeleton geochemistry. Paleoceanography and Paleoclimatology, 17
[https://doi.org/10.1029/2000PA000528]

-
Schenider, R.C. and Smith, S.V., 1982, Skeletal Sr content and density in Porites spp. in relation to environmental factors. Marine Biology, 66, 121-131.
[https://doi.org/10.1007/BF00397185]

-
Scoffin, T.P., Tudhope, A.W., Brown, B.E., Chansang, H. and Cheeney, R.F., 1992, Patterns and possible environmental controls of skeletogenesis of Porites lutea, South Thailand. Coral Reefs, 11, 1-11.
[https://doi.org/10.1007/BF00291929]

-
Shimamura, M., Hyeong, K., Yoo, C.M., Watanabe, T., Irino, T. and Jung, H.-S., 2008, High resolution stable isotope records of sclreractinian coral near Ishigaki Island: Their implication as a potential paleoclimatic recorder in middle latitude regions. Geosciences Journal, 12, 25-31.
[https://doi.org/10.1007/s12303-008-0004-y]

- Shinn, E.A., 1966, Coral growth-rate, an environmental indicator. Journal of Paleontology, 40, 233-240.
-
Swart, P.K., Healy, G.F., Dodge, R.E., Karmer, P., Hudson, J.H., Halley, R.B. and Robblee, M.B., 1996, The stable oxygen isotope and carbon isotopic record from a coral growing in Florida Bay: a 160 year record of climatic and anthropogenic influence. Palaeogeography, Palaeoclimatology, Palaeoecology, 123, 219-237.
[https://doi.org/10.1016/0031-0182(95)00078-X]

-
Tudhope, A.W., Chilcott, C.P., McCulloch, M.T., Cook, E.R., Chappell, J., Ellam, R.M., Lea, D.W., Lough, J.M. and Shimmield, G.B., 2001, Variability in the El Niño-Southern Oscillation through a Glacial-Interglacial cycle. Science, 291, 1511-1517.
[https://doi.org/10.1126/science.1057969]

-
Yan, X.-H., Ho, C.-R., Zheng, Q. and Klems, V., 1992, Temperature and size variabilities of the Western Pacific Warm Pool. Science, 258, 1643-1645.
[https://doi.org/10.1126/science.258.5088.1643]

-
Watanabe, T., Kawamura, A., Yamazaki, M., Murayama, M. and Yamano, H., 2014, A 106 year monthly coral record reveals that the East Asian summer monsoon modulates winter PDO variability. Geophysical Research Letters, 41, 3609-3614
[https://doi.org/10.1002/2014GL060037]

-
Wellington, G.M. and Dunbar, R.B., 1995, Stable isotopic signature of El Niño-Southern Oscillation events in eastern tropical Pacific reef corals. Coral Reefs, 14, 5-25.
[https://doi.org/10.1007/BF00304066]

-
Zinke, J., Loveday, B.R., Reason, C.J.C., Dullo, W.-C. and Kroon, D., 2014, Madagascar corals track sea surface temperature variability in the Agulhas Current core region over the past 334 years. Scientific reports, 4, 4393
[https://doi.org/10.1038/srep04393]

