
맨틀과 암석권의 기계적 강도를 반영한 2차원 점탄성 좌굴 구조 유한요소 수치 모사 연구
초록
암석권은 다양한 기계적 강도를 갖는 지각과 맨틀이 샌드위치 구조로 배치된 층상 구조이며 대부분의 암석권은 판구조적 압축력 하에 놓여있다. 약한 모암 층에 강한 층이 삽입된 형태의 샌드위치 구조에 압축력이 작용하면 좌굴 형태의 불안정을 유발할 수 있으며, 이는 좌굴 구조가 암석권에서 빈번하게 발생할 수 있는 지구동역학적 현상임을 지시한다. 지구에서 발견되는 좌굴 구조의 방향, 파장, 진폭 등은 좌굴 생성 당시의 지구조 환경(예, 응력의 크기와 방향)과 암석권의 강도를 추정할 수 있게 해주므로 판구조론적 관점에서 중요한 구조로 인식되어왔다. 본 연구에서는 상용 유한요소 소프트웨어 콤솔 멀티피직스을 활용하여 라그랑지안 접근법을 바탕으로 한 2차원 점탄성 수치 모형을 개발하여 좌굴 구조를 형성하고 기존 연구와 비교하였다. 기존 좌굴 수치 모사 연구에서는 계산의 용이성을 위해서 작은 공간 규모(수백 m2 단위)와 약한 기계적 강도(점성도 < 1020 Pa·s, 영률 < 109 Pa)를 도입하였으나, 본 연구에서는 지구동역학적 규모에 맞게 수백 km2 공간 규모와 1023 Pa·s 단위의 점성도, 1010 Pa 단위의 영률을 사용하여 좌굴 구조를 재현하였으며 이는 우리가 대규모 좌굴 구조(예, 섭입 시작 전에 발생하는 암석권 규모 좌굴 현상 등) 연구에 적합한 모형을 개발하였음을 의미한다. 강한 층이 하나만 있는 모형의 경우에 대해서, 점탄성 대비와 강한 층의 두께 증가에 따른 진폭과 파장의 증가 결과를 도출하였다. 점탄성 대비가 작은 경우(50)와 큰 경우(400)를 비교할 때, 각각 ~9%와 ~3%의 변형률에서 좌굴이 급격하게 생성되기 시작하였다. 이러한 결과는 기존 이론적/수치적 연구와 유사한 결과다. 그뿐만 아니라 우리의 수치 모형은 강한 층이 다수 삽입되어 더욱 복잡한 격자 변형이 필요한 수치 모사를 성공적으로 계산하였으며, 그 결과 강한 층 간의 거리에 따라 두 층 간의 응력 교란 양상을 확인하였다. 본 연구에서 개발한 수치 모형은 지구 천부에서 심부에 이르는 넓은 깊이 범위에서 존재하는 맨틀 좌굴 구조 연구에 활용될 수 있을 것으로 기대된다.
Abstract
The lithosphere of the Earth is sandwich structures with crust and mantle with various mechanical strength of viscosity and elastic modulus, and a general stress regime of lithosphere is tectonic compression. A compression stress acting on the sandwich structure with mechanically strong layers embedded in the weak matrix layer can induce buckling instability, which means that the buckling structure is frequent geodynamic features in the lithosphere. The orientation, wavelength, and amplitudes of the buckling structures found on the Earth has been recognized as important indicator for tectonic environments (e.g., magnitude and orientation of tectonic stress) and lithospheric strength at the moment of buckling formation. In present study, we developed 2D viscoelastic numerical model based on the Lagrangian approach using a commercial finite element software, the COMSOL Multiphysics, to reproduce buckling structure and compare with previous studies. Previous conventional works applied small spatial scale ( ~100 m2) and low mechanical strength (viscosity < 1020 Pa·s, Young's modulus < 109 Pa) for simple calculation. However, our study adopted a spatial scale of ~500 km2, viscosity ≈ 1023 Pa·s, and Young's modulus ≈ 1010 Pa to reflect realistic geodynamics situations. This means that our model can suitably simulate the large-scale buckling structures such as lithospheric buckling before subduction initiation. In the case with a single strong layer, the increase of viscoelastic contrast and thickness of the layer lead to the increase of amplitude and wavelength of buckling structure. When the viscoelastic contrast is small (50) and large (400), the growth rate of buckling structure abruptly increases right after ~ 9% and ~ 3% bulk strain, respectively. These results are consistent with previous theoretical and numerical researches on the buckling. Furthermore, our models with two strong layers successfully handle the complicated buckling structures that requires more severe element deformation. We confirmed that the patterns of stress interaction strongly depend on the distance between the two layers. We expect that our numerical model can be applied to the buckling structure of the lithosphere and mantle in a wide range of vertical and horizontal scales with realistic mechanical strength.
Keywords:
buckling, finite element method, Maxwell viscoelasticity, geodynamics, COMSOL Multiphysics키워드:
좌굴, 유한요소법, 맥스웰 점탄성, 지구동역학, 콤솔 멀티피직스1. 서 론
지각과 암석권에 존재하는 좌굴 구조는 응력이 가해지는 방향에 대해 수직 방향의 변위가 발생하는 규칙적 혹은 불규칙적 파장을 가진 주기 함수 형태의 기계적 불안정으로, 직접 측정하는 것이 어려운 판구조 응력의 크기와 방향을 파악할 수 있다는 점에서 중요한 지구조로 인식되고 있다. 좌굴 구조의 파장과 진폭으로부터 지각과 맨틀의 강도를 계산할 수 있는데, 주로 자연에서 발견한 좌굴 구조를 수치 모사 기법을 이용해 운동량과 질량 보존 방정식을 해석하여 재현하는 방식으로 응력의 크기와 방향을 역산한다(Gerbault et al., 1999; Gerbault, 2000, Schmalholz et al., 2002). 이를 바탕으로 지구조 형성의 역사와 미래를 추정할 수 있다. 기존 수치 모사 연구(예, Guest et al., 2007; Thielmann and Kaus, 2012)에서는 대륙주변부에서 발생한 해양 지각의 좌굴 구조로부터 지구조 응력(tectonic stress)과 지각과 맨틀의 기계적 강도를 추산하여, 대륙주변부가 섭입 시작(subduction initiation)의 형태로 재활성화하는 기작을 설명하였다. 그 외에도, 자원개발의 관점에서 좌굴 구조와 석유 및 가스 하이드레이트 부존 사이의 상관관계에 대해 지속적인 연구가 진행되어왔다(Shipley et al., 1979; Curi, 1993; Bordenave and Hegre, 2005; Crutchley et al., 2018).
기존 지구물리학 탐사를 통해서 다수의 대규모의 좌굴 구조를 발견하였는데 인도양과 히말라야가 대표적인 예이다(Cloetingh and Burov, 2010). 인도양의 벵골 만에서는 반사파 탐사를 통해 해양 지각에 파장 ~200 km, 진폭 ~1.5 km의 좌굴 구조(Geller et al., 1983; Stephenson and Cloetingh, 1991; Beekman et al., 1996)를, 히말라야에서는 중력 역산을 통해 모호면에서 파장 ~250 km, 진폭 ~10 km의 좌굴 구조(Caporali, 2000; Shin et al., 2009; Shin et al., 2015)을 관찰하였다. 상대적으로 소규모 좌굴 구조가 발견되기도 한다. 동해에 위치한 대륙주변부에서 파장 ~ 70 km, 진폭 ~0.2 km의 좌굴 구조(Kim, G.-B. et al., 2018)를, 이베리아 반도의 대륙 지각에서 파장 ~60 km의 좌굴 구조(Cloetingh et al., 2002)를 관찰하였다.
좌굴 작용은 기계적 강도(예, 점성도 및 탄성 계수)가 강한 지층이 약한 모암 사이에 놓여 있을 때, 해당 지층과 평행한 방향으로 압축력이 작용할 때 습곡 구조가 형성되는 현상을 의미한다(Donath and Parker, 1964). 실제 자연에서 암석권은 온도와 압력에 의존하는 강도를 갖기 때문에, 깊이에 따라 취성-연성 전이대(brittle-ductile transition zone)가 존재하여, 유동학적 층상 구조를 보인다(Gleason and Tullis, 1995; Burov, 2011). 취성-연성 전이대를 경계로 기계적 강도의 깊이에 따른 변화 양상이 반전되기 때문에 취성-연성 전이대 근처가 가장 높은 강도를 가지고 있다. 일반적으로 해양 암석권의 경우 1개, 대륙 암석권의 경우 2개 이상의 취성-연성 전이대가 있다(McAdoo and Sandwell, 1985; Burov and Diament, 1995; Lu et al., 2011). 결과적으로 지각은 강도가 약한 부분과 강한 부분이 반복적으로 층구조를 이루며 쌓여 있는 샌드위치 구조를 보인다. 대부분의 암석권에는 압축력이 작용(예, Bott and Kusznir, 1984; Moorkamp et al., 2019)한다는 점을 고려하면 암석권의 좌굴 구조는 지구에서 빈번하게 발생할 수 밖에 없는 판구조 현상이다. 그뿐만 아니라, 판의 섭입 과정에서 맨틀 심부에서 좌굴 구조를 형성할 수 있다고 알려져 있는데(Ribe et al., 2007; Lee and King, 2011) 이는 기계적 강도가 강한 섭입판이 상대적으로 약한 맨틀을 파고들면서 발생하는 압축력에 의한 불안정으로 해석할 수 있다.
지각과 암석권의 좌굴 구조에 대해서 지난 수십 년간 이론(Biot, 1961; Smith, 1975; Hudleston and Lan, 1993; Schmalholz and Podladchikov, 2001), 상사 모형(Biot et al., 1961; Hudleston, 1973; Martinod and Davy, 1994; Marques and Mandal, 2016), 수치 모사 연구(Dieterich, 1970; Zhang et al., 1996; Mancktelow, 1999; Hobbs et al., 2008)가 활발히 진행되어왔다. 대부분의 기존 연구에서 좌굴 구조의 진폭과 파장이 모암과 그에 포함된 강한 층 사이의 점성도 대비와 강한 층의 두께에 영향을 받는다고 제시하였다. 이론 연구는 순수 점성 물질에 한해서 좌굴 구조의 파장과 진폭이 점성도 대비와 강한 층의 두께에 의존하는 현상을 정량적으로 표현한 상관 관계를 도출하였지만, 비선형적인 점탄성 물질에 대한 진폭과 파장에 대한 방정식을 도출하지 못하였다(Biot, 1961). 또한, 이론적인 연구의 경우 초기 섭동의 존재, 고정된 물성, 일정한 변형률 등 비현실적인 가정이 필요하기 때문에 실제 자연에 대입하기에는 한계가 있다. 암석 대신에 실리콘 퍼티(putty)와 모래 등을 사용하는 상사 모형의 경우 실험실 환경에 실제 지형과 유사한 좌굴 구조를 재현하였다(Hudleston, 1973; Sherkati et al., 2006; Noble and Dixon, 2011). 그러나 상사 모형 경우, 경계 조건과 물성 조절이 어렵고, 실제 암석권에 비해 매우 작은 점성도와 압력 조건만 이용할 수 있으며, 실험을 많이 할 수 없다는 단점이 있다. 이에 비해 수치 모사는 실험 횟수에 제한이 없어 좌굴에 관한 물리적 직관을 얻기에 용이하고, 물성이나 경계 조건을 설정에 제약이 없는 등의 장점이 있어 많은 좌굴 연구에서 도입되었다.
기존 수치 모사 연구의 결과는 이론에 의해 추정된 좌굴의 특성을 성공적으로 재현하였고 이는 수치 모사 기법이 좌굴 연구에 있어 강력한 도구임을 의미한다. 그러나 대부분의 수치 모사 연구는 판구조적 규모에 비해 매우 낮은 기계적 강도와 작은 공간 규모를 대상으로 실험을 하였고, 대부분 수치 모형의 물성 조건을 순수 점성만을 도입해서 실험하였다. 실제 지각과 암석권은 점탄성 물질로 구성되어 있기 때문에, 좌굴에 관한 수치 모사시 점탄성을 반드시 고려하여야만 한다(Goetze and Evans, 1979; Schmalholz and Podladchikov, 1999; Farrington et al., 2014).
본 연구에서는 상용 유한요소 소프트웨어 콤솔 멀티피직스(COMSOL Multiphysics)을 바탕으로 맥스웰 점탄성(Maxwell viscoelastic) 물성을 고려한 판구조론적 규모의 2차원 라그랑지안(Lagrangian) 좌굴 수치 모형을 개발하였다. 우리의 수치 모형은 기본적으로 강도가 강한 층이 약한 모암에 1층만 삽입되어 있는 경우의 좌굴 현상 모사를 목적으로 한다. 우리 모형의 타당성을 확인하기 위해서 기존 연구(Zhang et al., 1996)의 수치 모형을 벤치마크 하였고, 점탄성 물성을 가지는 좌굴 구조에서 나타나는 응력과 변형 분포에 대해 연구하였다. 본 연구에서 제작한 1개의 강한 층을 갖는 수치 모형을 변형하여 서로 다른 기계적 강도를 가진 다수의 층(multilayer)을 갖는 좌굴을 구현하였다. 기존 수치 모사 연구(Schmid and Podladchikov, 2006)와 상사 모형 연구(Currie et al., 1962)에서 나타나는 다층 좌굴 구조의 특징을 본 연구의 수치 모형을 바탕으로 재현 및 비교하였다. 이를 바탕으로, 우리가 고안한 다층 좌굴 수치 모형을 통해서 층간의 응력 교환에 대해서 논의하고자 한다.
2. 실험 방법
2.1 수치 모형의 구성
본 연구에서는 2차원 평면 변형률(plane strain) 가정하에 점탄성 좌굴 구조에 대한 기존 수치 모사 연구(예, Zhang et al., 1996; Mancktelow, 1999)을 바탕으로 1층(single layer)과 다층(multilayer) 좌굴 발생에 관한 수치 모형을 개발하여 맨틀과 해양 암석권 수준의 높은 기계적 강도(즉, 점성도와 탄성 계수)를 도입하였다. 좌굴에 관한 수치 모사 연구 대부분이 지구동역학적 공간( > 100 km2) 규모보다 소규모의 크기( ~100 m2)를 가진 수치 모형을 제작하였고, 강한 층에 적용한 영률과 점성도 역시, 각각 109 Pa와 1020 Pa·s 정도로 상대적으로 낮은 값을 사용하였다(Zhang et al., 1996; Mancktelow, 1999). 그러나 이러한 물성치 값은 맨틀 및 암석권의 일반적인 영률과 점성도인 ~5 × 10¹⁰ Pa과 ~1021 Pa·s (van Wijk and Cloetingh, 2002; Calais et al., 2010; Crameri et al., 2012; Thielmann and Kaus, 2012)에 훨씬 못 미치는 값이다. 본 연구의 수치 모형은 수 백 km2의 넓이의 직사각형 형태이며, 그 가운데에 두께가 h인 강한 층을 포함하고 있다(그림 1a). 강한 층(그림 1a 빨간색 영역)의 점성도 ηs와 영률 Es은 각각 1.0 × 10²³ Pa·s와 7.5 × 10¹⁰ Pa로 설정하였다.
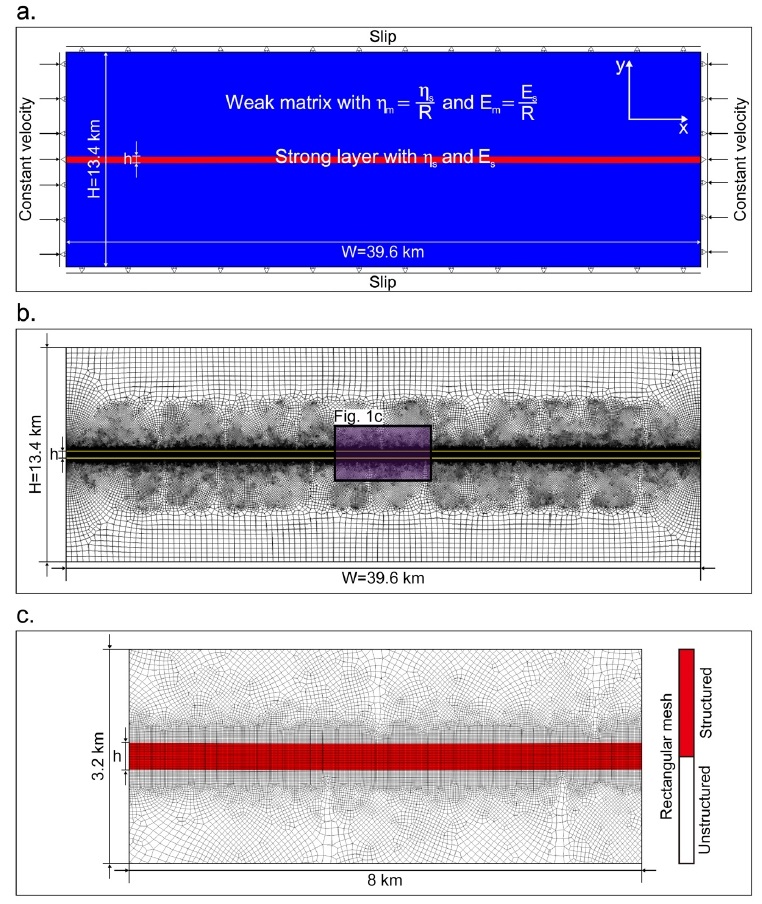
Maxwell viscoelastic model set-up for mechanically strong layer embedded in weak matrix. The blue and red colored regions represent weak matrix and strong layer, respectively. Es, ηs, Em, and ηm respectively, indicate the Young’s modulus and viscosity of the strong layer and weak matrix. R = ηs/ηm = Es/Em is viscoelastic contrast (see Table 1). The boundary condition for the top and bottom of domain is slip condition. The side walls of domain are subjected to lateral compression at strain rate of 10-16 S-1, and are free in vertical movement except the strong layer. Sinusoidal perturbations with small amplitude (i.e., 0.01⋅cos2πnLx, n = number of initial waveforms) are applied to the strong layer for initiating buckling. (b) Finite element grid (mostly rectangles) for model domain. The finer meshes are defined the area around the strong layer (see purple box). Note that Fig. 1c is a magnified figure for the purple box. (c) Part of the finite element grid. The red region (i.e., the strong layer) shows structured mesh grids. The rest is weak matrix that is divided by unstructured meshing techniques.
약한 모암(그림 1a 파란색 영역)의 점성도 ηm와 영률 Em은 점탄성 대비 R를 이용해서 조절하였다(그림 1a). 본 연구에서는 기존 이론 연구와 비교하기 위해서 온도와 압력에 의존하지 않는 점성도를 사용하였다. 수치 모형의 역학적 경계 조건은 직사각형 공간의 네 개 벽에 각각 적용하였다. 모암의 상부와 하부 벽에는 슬립(slip) 경계조건을 적용하였다. 양쪽 측벽에 0.1 mm/yr의 일정 속도 경계조건(constant velocity boundary condition)으로 설정하여 계산 공간을 압축하였다. 계산 공간의 수평 길이를 고려하면 이 속도는 ~10-16 s-1의 변형률 속도(strain-rate)에 해당하며 지질학적으로 합당한 변형 속도이다(Beekman et al., 1996; Gerbault et al., 1999; Guest et al., 2007; Burg and Schmalholz, 2008). 측벽의 y축 방향의 속도는 대부분 자유 상태이지만, 강한 층의 측벽 부분만은 0으로 구속하였다. 이는 좌굴에 의해 나타나는 급격한 격자 변형에 따른 계산의 불안정성과 그로 인해 발생하는 비물리적인 거동을 억제하기 위한 것이다(Zhang et al., 1996).
기존 연구(Biot, 1961; Zhang et al., 1996; Mancktelow, 1999; Schmid and Podladchikov, 2006)에서 좌굴 구조를 유도하기 위해서 주로 사인 함수 형태의 일정한 주기를 갖는 초기 섭동(initial perturbation)을 강한 층에 부가하였다. 본 연구에서도 초기 섭동 부가 방식을 이용해서 좌굴 구조를 유발하였다. 본 연구에서는 초기 섭동 파형을 으로 매개화하여 코사인 함수 형태로 만들었으며, x는 수평 방향 좌표를, 0.01은 초기 섭동의 진폭 (km)를 나타내며, L은 변형 전 수치 모형의 수평 길이다(39.6 km). n은 초기 섭동 파형의 파장 개수를 결정해주는 값이다. 예를 들어, n = 3이면 파장의 개수는 3개이며, 파장(즉, L/3)은 13.2 km이다.
그림 1b는 본 연구에서 사용한 기본적인 격자망을 보여준다. 노란색 직사각형으로 표시한 강한 층의 경우는 구조화된 격자(structured mesh) 방식을, 모암의 경우는 비구조 격자(unstructured mesh) 방식을 이용해서 격자망을 생성하였다. 그림 1c는 그림 1b의 검은색 상자를 확대한 것이다. 빨간색 음영 부분은 구조화된 격자를 사용한 강한 층을 나타내며, 격자의 배열이 규칙적인 특징을 보인다. 반면 모암의 비구조 격자는 불규칙하며, 강한 층에서 멀어질수록 0.02 km에서 0.35 km까지 격자의 크기가 커진다. 이는 변형이 클 것으로 예상되는 지역은 작은 격자를, 변형이 작을 것으로 예상되는 지역은 큰 격자를 사용하는 방식이다. 변형이 작은 지역에 대해서 불필요한 계산을 축소하고, 변형이 큰 지역에 대한 계산의 정확도를 제고할 수 있다는 장점이 있다(Burg and Podladchikov, 1999).
2.2 지배방정식 및 맥스웰 점탄성 응력-변형률 관계
평면 변형률(plane strain) 상태를 가정한 2차원 좌굴의 거동을 수치 모사하기 위해 운동량 보존 방정식(식 1)을 지배방정식으로 도입하였다(예, Toth and Gunis, 1998).
| (1-1) |
| (1-2) |
x와 y는 각각 수평과 수직 좌표를 의미하고, σij는 코시 응력 텐서(Cauchy’s stress tensor)이며, i 방향에 수직인 면에 j 방향으로 작용하는 응력을 의미한다. σyx = σxy라고 가정한다. 코시 응력 텐서 편향 응력 텐서(τij)와 압력(P)을 이용하여 표현한다(식 2와 표 1 참조).
| (2-1) |
| (2-2) |
식 (2-1)을 식 (1)에 대입하면 식 (3)과 같이 편향응력과 압력을 분리한 운동량 보존 방정식을 얻는다.
| (3-1) |
| (3-2) |
본 연구에서는 이용한 유한요소법에서는, 계산 영역을 연속적으로 연결된 연속체로 가정하여, 계산 영역 내의 변위장(displacement field)인 (u, v)를 구하는 것이 목표다. u와 v는 각각 x, y방향의 변위를 의미하는 기호다. 식 (1-1)과 (1-2)를 요소 별로 이산화한 후 전체 요소를 대상으로 조립하여 전체 강성 행렬(global stiffness matrix)을 제작하고, 경계조건을 적용해 전체 강성 행렬을 성형한 후 역산하여 변위장을 도출한다. 식 (1-1)과 (1-2)는 응력 텐서 성분에 대한 편미분으로 표현되어 있으므로, τij, P와 u, v 사이의 관계식이 필요하다. 따라서 u와 v와 변형률(strain) 및 변형률 속도(strain rate)의 관계를 점탄성 관점에서 묘사하는 조성 관계(constitutive rela-tion)를 도입하여야 한다(식 2 참조). 본 연구에서는 점탄성 거동 모형 중 대시포트(점성)와 용수철(탄성)의 직렬 연결로 표현된 맥스웰(Maxwell) 점탄성을 이용하였다. 시간이 t일 때 코시 응력 텐서 σij(t)는 볼츠만 중첩 적분(Boltzmann superposition integral, 식 4)로 표현된다(예, Yuen and Peltier, 1982)
| (4) |
δij는 크로넬커 델타(Kronecker delta)로 i = j라면 δij = 1이지만 그 외는 δij = 0이다. 와 는 각각 전단 탄성계수(shear modulus)와 체적 탄성 계수(bulk modulus)에 대한 완화 탄성률(relaxation modulus)다. G, K는 전단 탄성 계수, 체적 탄성 계수다. βG, βK는 각각 η/G와 η/K이며 η는 점성도이다. eij는 편향 변형률, εll은 체적 변형률(volumetric strain-rate)이다(식 5).
| (5) |
εij는 변형률 텐서로 식 (6)과 같다.
| (6) |
점탄성 고체의 변형은 시간 의존성이므로 시간을 이산화하여 n + 1과 n 번째 시간을 각각 tn+1과 tn이라고 하면 시간 간격(time-step)은 Δt = tn+1 - tn이다. 식 (4)를 정리하여 τij(tn+1)과 τij(tn)사이의 점화식을 구할 수 있다(식 7). 같은 방식으로 P(tn+1)과 P(tn) 사이의 점화식을 구할 수 있다(식 8).
| (7) |
| (8) |
선형 탄성 이론에서 0.5ㆍdτij/deij와 -dP/dεll는 각각 전단과 체적 탄성 계수다(Turcotte and Schubert, 2002). 이 개념을 식 (7)과 (8)에 적용하면 시간 tn에서의 전단과 체적 탄성계수는 각각 와 로 설정할 수 있다. 이를 바탕을 매시간 단계마다 응력 텐서의 값을 갱신하는 방식을 사용한다.
3. 결 과
그림 2a는 R = 400, h = 0.4 km인 강한 층과 n = 3인 초기 섭동을 적용한 수치 모형을 수평 방향으로 20% 압축하였을 때의 변형된 격자망이다. 강한 층에서 가까운 모암 부분의 격자의 가로 세로 비율은 변형 전에는 1:1이었으나, 변형 후 1:0.4로 대변형이 일어났음을 확인할 수 있다(그림 2a의 초록색 상자 안 파란색 상자). 반면 모암의 상부 및 하부 경계면의 격자는 가로 세로 비가 변형 전과 후 모두 1:1이며, 이는 강한 층에서 먼 지역은 변형이 매우 작음을 의미한다(그림 2a의 노란색 상자). 그림 2b는 그림 2a의 검은색 사각형 확대한 그림으로 빨간색 음영 부분은 점탄성 강도가 강한 층을 의미한다. 강한 층에서 멀어질 수록 격자의 크기가 큰 것을 확인할 수 있다. 그림 2c는 폰 미세스 응력(σv = von Mises stress)의 공간적 분포를 보여준다. 모암의 응력 수준은 ~1 GPa 이하지만, 강한 층에는 ~2 - 9 GPa로 더 높은 응력이 집중 되는 것을 관찰할 수 있다. 이는 강한 층이 기계적인 강도가 높기 때문에 같은 배경 변형 속도 환경에서 더 큰 응력을 축적하기 때문이다. 강한 층의 힌지(hinge) 부분과 날개(limb) 부분을 비교하였을 때, 힌지 부분(~7 GPa)이 날개 부분(~2 GPa)보다 더 큰 응력 집중을 보인다. 이는 이전 연구(Schmalholzand Mancktelow, 2016)에서 강한 층의 힌지와 날개 부분에 응력 분포 결과와 유사한 경향을 보인다. 그림 2d는 그림 2c의 검은색 상자를 확대하여, 수평 응력(σxx = horizontal stress)의 분포를 보여준다. 수평 응력의 부호는 인장력(양수)과 압축력(음수)을 의미한다. 힌지의 내측 부분과 외측 부분을 비교해보면, 내측 부분은 파란색(압축)을, 외측 부분은 빨간색(인장)을 띈다. 이는 이전 연구(Dieterich and Carter, 1969; Liu et al., 2016)에서 나타난 힌지의 수평 응력 분포와 유사하다.
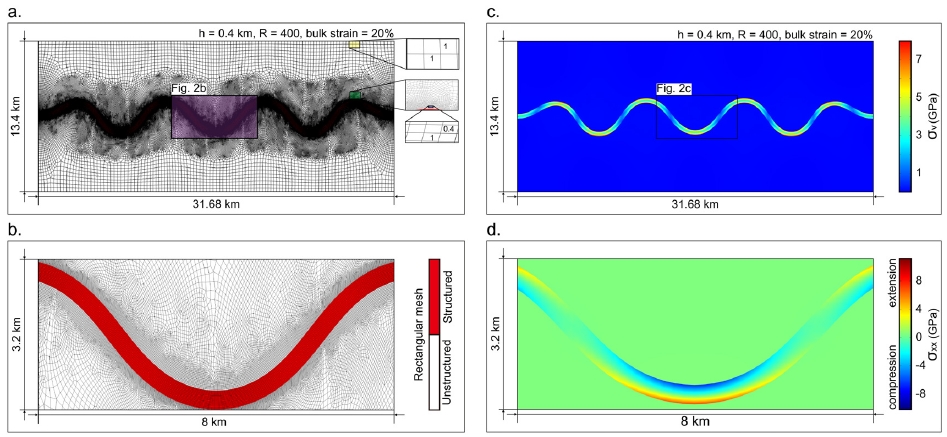
(a) Deformed mesh of the domain after 20% shortening for the case of h = 0.4 km, R = 400, and n = 3. Severely deformed (aspect ratio of 1:0.4 in green box) and intact (aspect ratio of 1:1 in yellow box) meshes are emerged depending on distance from the buckling structure. The blue box inside the green one provides the magnified view. (b) Part of the deformed finite element grid. The red colored region is divided by structured meshes with smaller size. (c) Distribution of von Mises stress (σv) for the case of h = 0.4 km, R = 400, n = 3, and bulk strain = 20%. (d) Distribution of horizontal stress (σxx). The sign of σxx indicates extension (positive) and compression (negative) along the inside and outside of hinge, respectively.
그림 3a와 3b는 R = 400, h = 0.4 km, n = 3인 초기 섭동을 부가한 수치 모형을 수평 방향으로 20% 압축하였을 때의 수직 변형률(vertical strain)과 수평 변형률(horizontal strain)의 분포이다. 변형률의 부호는 변형률의 방향을 의미하며, 음수(파란색)와 양수(빨간색)는 각각 해당 방향으로의 압축과 인장을 의미한다. 그림 3a에서 빨간색과 파란색 영역을 관찰하면 수직 변형률이 인장의 경우 최대 40% 이상, 압축의 경우 최대 50% 이상임을 파악할 수 있다. 힌지를 기준으로 힌지의 내측 부분은 원래 위치보다 인장되고, 외측 부분은 압축되는 것을 확인할 수 있다. 그림 3b에서 인장과 압축 변형률의 최대는 ~5%와 ~40% 이다. 따라서 좌굴 구조가 생성되면서, 힌지의 내측 부분은 수평 방향으로 압축된 것을, 외측 부분은 인장된 것을 알 수 있다. 수치 모형은 수평 압축을 받기 때문에, 수평축에 대한 변형은 대부분 압축이지만, 힌지 외측 부분에서 국지적으로 인장 변형이 발생하게 된다.
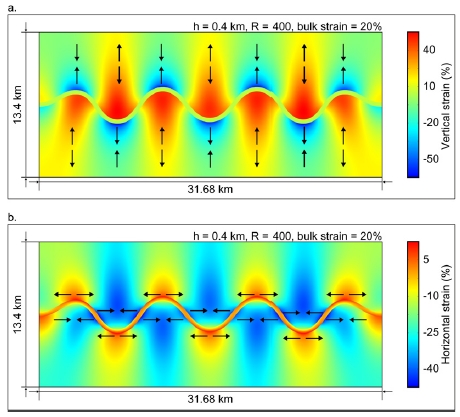
Distribution of (a) vertical and (b) horizontal strain (%) for the case of h = 0.4 km, R = 400, and n = 3 at bulk strain of 20%. The black arrows show direction of strain (i.e., compression or extension).
그림 4는 R = 50과 n = 3인 초기 섭동을 부가한 수치 모형을 h 값을 0.14 km에서 0.4 km까지 변화시키면서 수평 방향 압축을 약 7.92 km (20% 변형률) 가하였을 때 발생한 좌굴 구조로, 높이 5.2 km, 폭 31.68 km의 직사각형으로 좌굴 구조가 관찰되는 강한 층과 그 주변부를 확대한 결과이다. 색은 편향응력의 크기(σv)를 의미하며 모든 경우에 강한 층에 응력이 집중됨을 지시하고 있다. h = 0.14 km (그림 4a) 와 h = 0.4 km (그림 4c)를 비교하면, h 값이 증가할수록 진폭이 0.21 km에서 0.51 km로 커지고, 파장도 1.68 km에서 4.00 km로 길어진다. 같은 점성도 대비(R)가 설정된 경우, 강한 층의 두께가 두꺼울 수록 더 큰 진폭과 더 긴 파장의 좌굴 구조를 생성되는 것을 파악할 수 있으며 이는 기존 이론 연구(Biot, 1961)에서 도출된 경향성과 유사하다.
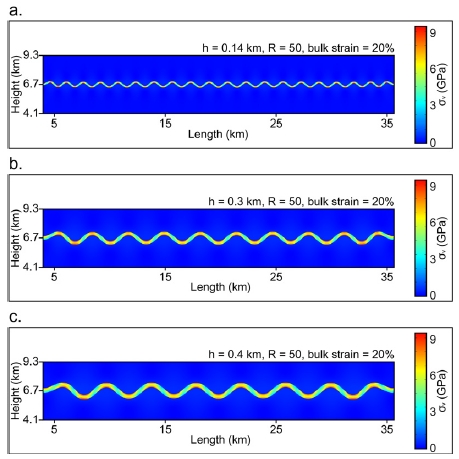
Shapes of buckling structures with (a) h = 0.14 km, (b) h = 0.3 km, and (c) h = 0.4 km for the cases of the fixed R = 50, n = 3, and bulk strain 20%. The larger h leads to the longer wavelength of buckling structures. σv means the von Mises stress.
그림 5는 n = 3인 초기 섭동을 부가하고 h = 0.2 km일 때 R 값을 변화시키면서 수평 방향 압축을 20% 변형률 가하였을 때 발생한 좌굴 구조이며, 강한 층과 그 주변부를 높이 5.2 km, 폭 31.68 km의 직사각형의 형태로 확대한 결과이다. 색은 편향응력의 크기(σv)를 의미한다. 그림 5a (R = 50)와 5c (R = 400)의 좌굴 구조를 비교하면, 진폭은 0.28 km에서 0.64 km로 파장은 2.44 km에서 4.06 km로 증가한다. 이전 연구(Hudleston and Lan, 1993)에서와 유사하게, 강한 층의 두께의 변화 없이도, 점탄성 대비의 증가에 따라 파장과 진폭이 증가하는 것을 관찰 수 있다.
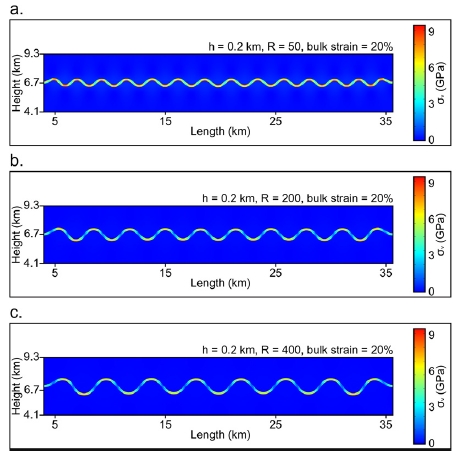
Stress distribution with (a) R = 50, (b) R = 200, and (c) R = 400 with the fixed values of n = 3, h = 0.2 km, and bulk strain = 20%. The larger value of R induces the longer buckling wavelength. σv means the von Mises stress.
그림 6은 n = 3인 초기 섭동을 부가한 h = 0.2 km인 강한 층이 정의된 수치 모사 결과로 좌굴 구조의 진폭과 변형률의 상관관계를 보여주며, 색깔은 서로 다른 점탄성 대비(R = 50, 100, 200, 400)을 가진 모형을 의미한다. 본 연구에서는 모형을 양쪽 방향에서 등속 압축시키기 때문에, 변형률과 변형 시간은 비례한다. R 값이 더 큰 모형의 경우 더 큰 좌굴 진폭이 생성된다. 예를 들어, 변형률이 20%인 시점에서 좌굴 구조의 최대 진폭은 R = 50 (그림 6의 빨간색 선)과 400 (그림 6의 하늘색 선)인 경우 각각 ~0.25 km와 ~0.6 km이다. 검은색 화살표는 계속된 변형에 따른 좌굴 구조의 진폭이 급격하게 증가하는 시점을 표시하며, 이는 좌굴 시작(buckling initiation)으로 하나의 주된 파장을 갖는 좌굴 구조가 급격하게 만들어지기 시작하는 현상을 의미한다. 좌굴 시작은 R 값이 클수록 빠르다는 것을 확인하였다. 예를 들어 R = 50 (그림 6의 빨간색 선)과 400 (그림 6의 하늘색 선)인 모형은 각각 ~9%와 ~3%의 변형률에서 좌굴 시작이 발생하였다. Zhang et al. (1996)의 연구에서도 R = 50과 100인 모형에서 본 연구와 유사한 변형률에서 좌굴 시작이 발생한다.
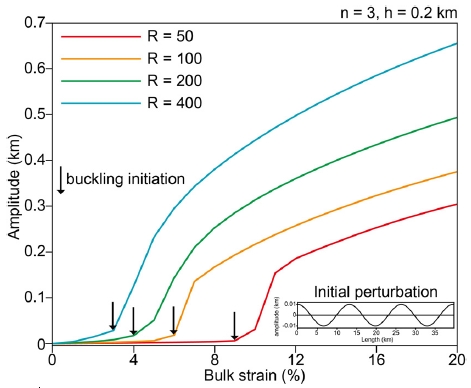
Buckling amplitude vs. bulk strain for the buckled strong layers. The different values of R = 50, 100, 200, and 400 (see red, orange, green, sky blue lines) show different evolution of buckling. The black arrows indicate the moment of buckling initiation, which means that the rate of buckling growth abruptly increases. The inset figure is a predefined initial perturbation (n = 3).
그림 7은 초기 섭동이 최종적인 좌굴 구조에 어떤 영향을 주는지 평가하기 위해 고안된 수치 실험 결과이다. h = 0.2 km로 고정하고, n = 2 (파장 19.8 km)과 18 (파장 2.2 km)의 초기 섭동을 부가한 수치 모형을 R 값을 50에서 400까지 변경하며 실험하였다. 그림 7의 최상단은 초기 섭동의 파형으로 n = 2인 경우는 점선으로, n = 18인 경우는 실선으로 표시하였다. 좌측의 회색 음영 처리된 화살표는 R 값의 증가를 나타내며, 색은 각각 다른 R 값이 설정된 모형을 의미한다. R 값이 작을 때는 n 값이 큰 경우와 작은 경우가 상이한 결과를 보인다. 예를 들어, R = 50 (빨간색)일 때 n = 18 (실선)과 n = 2 (점선)의 경우를 비교해보면, 각각 평균 파장은 1.81 km와 2.18 km, 진폭은 0.22 km와 0.28 km이다. 반면, R 값이 클 때는 n 값이 큰 경우와 작은 경우 모두 유사한 크기의 좌굴의 진폭과 파장이 만들어졌다. 예를 들어 R = 400 (그림 7의 하늘색)일 때 n = 18과 n = 2인 경우를 비교하면 두 경우 모두 파장과 진폭이 각각 ~4 km와 ~0.64 km로 일치하였다. 그림 7의 실험을 통해서 R 값이 작을수록 초기 섭동 파형에 영향을 크게 받고, R 값이 클수록 초기 섭동 파형에 영향보다 R 값에 주로 의존하여 좌굴 구조가 발생한다는 것을 알 수 있다.
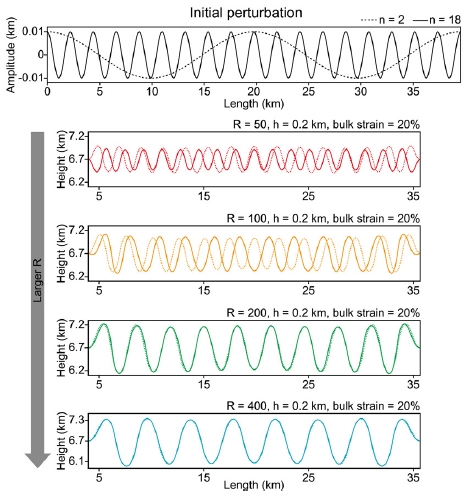
The effect of initial perturbation wavelength on buckling structure with different values of R. The top figure means the initial perturbation. The dashed and solid lines represent longer (n = 2) and shorter (n = 18) wavelength of initial perturbation. The bottom figures show the amplitude and wavelength of strong layer after 20% compression with different R (different color) and the wavelength (dashed and solid lines). When the values of R is small, the shape of buckling highly depends on initial perturbation.
h = 0.14 km로 설정된 모형에서 초기 섭동의 파형과 R 값이 좌굴 구조에 미치는 상대적인 영향을 파악하였다(그림 8a와 8b). 초기 섭동의 파장이 짧은 모형(그림 8a)이 파장이 긴 모형(그림 8b)보다 빠르게 좌굴 시작이 발생하였다. R = 50 (그림 8a의 빨간색 선)과 R = 200 (그림 8a의 초록색 선) 일 때, 초기 섭동의 파장이 짧은 경우(즉, n = 18) 각각 ~6%와 ~2%의 변형률에서 좌굴 시작이 발생하였다. 반면 초기 섭동 파장이 긴 경우(즉, n = 3)에는 R = 50과 200인 경우 각각 10%와 6%에서 발생하였다(그림 8b). h = 0.14 km인 경우, 초기 섭동의 파장이 짧을 때와 길 때, 좌굴 구조의 진폭 진화 양상이 상이함을 파악할 수 있는데, 이는 강한 층의 두께가 충분히 두껍지 않다면 좌굴 구조가 초기 섭동의 파형에 크게 영향을 받음을 지시한다.
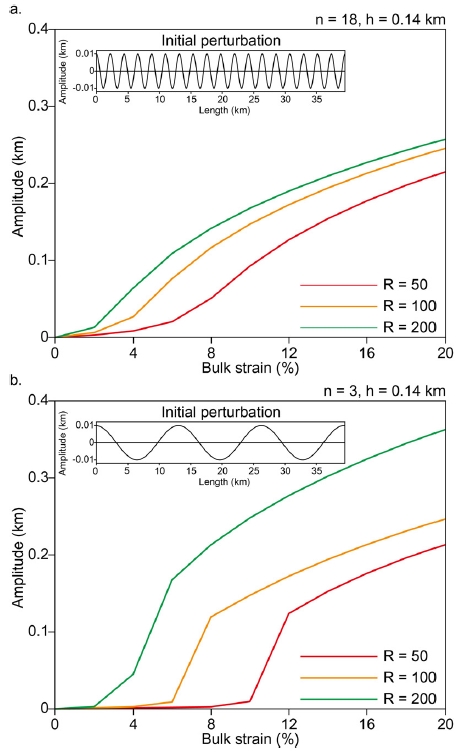
Buckling amplitude evolution of thin strong layer (h = 0.14 km) initiated by initial perturbations with (a) shorter (n = 18) and (b) longer (n = 3) wavelength. Different colors indicate the different values of R. The inset figures represent initial perturbations.
두께가 0.4 km로 두꺼운 층으로 제작한 수치 모형을 초기 섭동을 각각 n = 18 (그림 9a)과 n = 3 (그림 9b)으로 하여, 두께가 두꺼운 층일 경우 초기 섭동의 영향을 평가하였다. n = 18과 n = 3 일 때 R = 50 (그림 9의 하늘색 선)과 R = 200 (그림 9의 연두색 선)을 보면, 두 결과 모두 각각 ~10%와 ~4%의 변형률에서 좌굴 시작이 발생하였다. 다른 R 값에서도 n 값과 상관없이 좌굴 구조의 진화 양상이 유사하였다. 즉 강한 층의 두께가 충분히 두꺼워지면 R 값에만 의존하며 초기 섭동의 형태에 무관하게 좌굴이 생성되는 것을 파악할 수 있다.
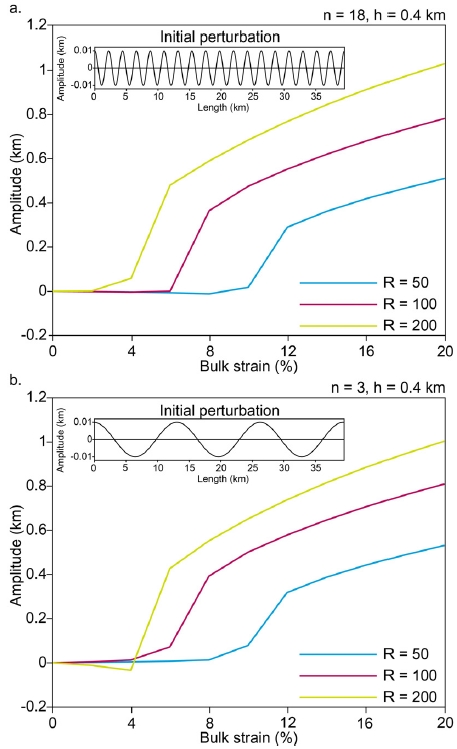
Buckling evolution of thick strong layer (h = 0.4 km) with different values of R (different colors) for the cases of (a) shorter (n = 18) and (b) longer (n = 3) wavelength. The inset figures represent initial perturbations.
모암에 강한 층이 여러 개 삽입된 다층 모형 연구(Schmid and Podladchikov, 2006)에서는 층 간의 응력 상호작용에 의해 복잡한 좌굴 구조가 나타날 수 있으며, 층 사이의 거리에 따라 크게 세가지 형태의 좌굴 구조가 다층 모형에서 발생할 수 있다고 제시하였다. 첫 번째는 층간 거리가 매우 멀어서 각각의 강한 층이 완전히 독립적으로 각각의 좌굴 구조를 생성하는 실제 1층(Real single layer) 좌굴, 두 번째는 층간의 거리가 가까워 층 사이의 응력 교환이 가능하여 발생하는 복잡한 형상의 진 다층(True multilayer) 좌굴, 마지막은, 층간의 거리가 매우 가까워 여러 개의 강한 층이 마치 하나의 층처럼 작동하는 유효 1층(Effective single layer) 좌굴 구조이다.
본 연구에서 기계적 강도가 일정한 층을 두 개 포함시키고, 두 층 사이의 거리 d를 변수로 설정하여 두 층 간의 응력 상호작용을 관찰하였다. d 값은 S1과 S2 층의 중앙을 기준으로 하여 측정한다. 그림 9a는 2층 구조를 갖는 수치 모형에 대한 모식도이다. 노란색 영역은 기계적 강도가 약한 모암, 파란색과 빨간색 영역은 기계적 강도가 강한 층을 의미하며, 각각 S1과 S2로 설정하였다. 모암의 크기는 이전 1개 층을 갖는 수치 모형과 동일하게 13.4 km × 39.6 km로 강한 층의 두께를 각각 h1 = 0.14 km, h2 = 0.4 km로 설정하였다. S1과 S2에는 n = 3으로 동일한 형태의 초기 섭동 파형을 적용하였다. S1과 S2의 점성도(ηs)와 영률(Es)은 1.0 × 10²³ Pa·s와 7.5 × 10¹⁰ Pa 동일하게 설정하였고, 모암의 점성도(ηm)와 영률(Em)은 R = 400일 때의 점성도와 영률로 설정하였다(그림 10a). 경계 조건은 1층으로 제작한 수치 모사와 같은 방식으로, 모암의 상부와 하부 벽에는 슬립 경계조건이 작용하게 하였다. 모암의 측벽의 x축 방향 경계조건은 일정 속도 경계조건(0.1 mm/yr, 즉 ~10-16 s-1의 변형률 속도)으로 설정하였다. y축 방향에 대해서는, S1과 S2의 측벽을 y축 방향 속도만 0으로 고정하였고, 그 외 부분은 자유 상태로 설정하였다.
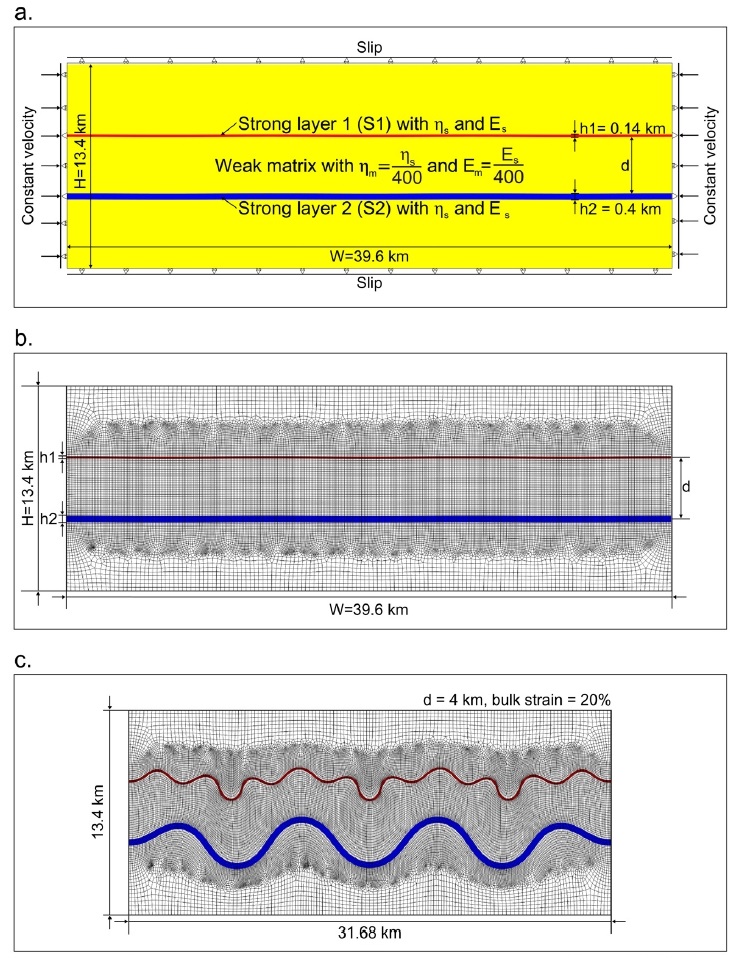
(a) Multilayer model set-up. The two mechanically strong layers S1 (red) and S2 (blue) are embedded in weak matrix (yellow). The same values of parameters (n = 3, Es, and ηs) are applied except the thickness of the S1 (h1 = 0.14 km ) and S2 (h2 = 0.4 km). The value of d represents the distance between S1 and S2. The viscoelastic contrast (R) is fixed at 400. The same boundary condition with single layer model is assigned. (b) Finite element grid for the multilayer model. The S1 (red) and S2 (blue) are divided structured meshes. The rest uses unstructured mesh. (c) Deformed mesh of multilayer model after 20% shortening.
S1과 S2, 그 사이의 모암은 큰 변형을 할 것으로 예상되므로, 작은 크기의 구조화된 격자를 사용하였고, 그 외 모암 부분은 작은 변형을 할 것으로 예상되어 격자의 개수를 줄여 계산의 효율성을 제공할 수 있는 비구조화 격자을 사용하였다(그림 10b). 실제로 이 수치 모형을 20% 수평 압축하였을 때 나타나는 격자망을 관찰해보면 S1과 S2, 강한 층 사이의 모암의 격자가 그 외 모암의 격자에 비해 큰 변형된 것을 확인할 수 있다(그림 10c).
그림 11a, 11b, 11c 순으로 d = 6 km, 4 km, 1 km로 설정하여 실험한 결과이다. S1과 S2의 점탄성 강도가 동일하다고 해도 두께가 다르기 때문에, 1층에 대해 수치 모사를 할 경우 서로 다른 파장을 갖는 좌굴 구조를 만든다(Biot, 1961). d에 변화에 따른 결과는 이전 연구(Schmid and Podladchikov, 2006)에서 설명한 다층 구조에서의 좌굴 유형 세가지를 명료하게 보여주고 있다. d = 6 km로 두 강한 층간의 거리가 가장 먼 경우, 층 간에 상호작용이 발생하지 않고, 각각의 층들이 실제 1층 구조의 좌굴 구조를 보여준다(그림 11a). d = 4 km인 경우 S1과 S2가 서로 긴밀한 영향을 주기 때문에, S1의 좌굴 구조가 두께가 두꺼운 S2의 좌굴 구조에 영향을 받아서 두 개 이상의 파장이 융합된 진 다층 구조를 이룬다(그림 11b). d가 매우 작은 경우(d = 1 km) 두께가 두꺼운 S2를 따라 S1이 단일 층처럼 작용하게 되는 유효 1층 구조의 좌굴 구조를 보여준다(그림 11c).
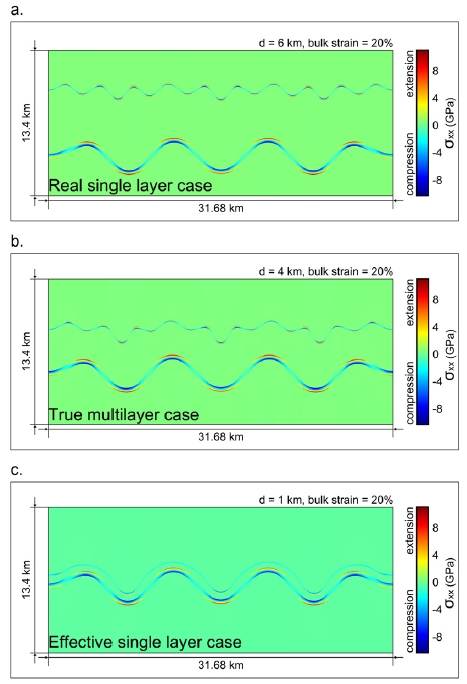
Distribution of horizontal stress for multilayer buckling structures. The patterns of multilayer buckling were compared based on the distance (a) d = 6, (b) d = 4, and (c) d = 1 km between S1 and S2. Real single layer (a), true multilayer (b), and effective single layer (c) are emerged depending the distance d.
4. 토 론
우리는 상용 유한요소 소프트웨어 콤솔 멀티피직스를 활용하여, 강도가 강한 층과 약한 모암으로 구성된 샌드위치 형태의 맥스웰 점탄성 지각과 맨틀에서 발생하는 좌굴에 관한 라그랑지안 유한요소 수치 모형을 판구조 현상 탐구에 합당한 기계적 강도와 공간적 규모를 반영하여 개발하였다. 본 연구에서는 강한 층과 모암의 점탄성 강도 대비가 클수록, 강한 층의 두께가 두꺼울수록, 좌굴 구조의 진폭과 파장이 커진다는 결과를 도출하였으며 이는 기존 이론, 수치, 상사 모형 좌굴 연구 결과와 일치한다. 좌굴 구조는 압축 변형이 가해짐에 따라 점진적으로 생성되는 것이 아니라 특정 변형률을 초과하면 급격하게 생성하는 성질을 보인다. 우리는 점탄성 대비가 클수록 더 작은 변형률에서 좌굴이 시작될 수 있음을 확인하였다. 본 연구의 좌굴 수치 모형이 제시한 좌굴 진화 경향은 기존 연구(Biot, 1961; Zhang et al., 1996; Mancktelow, 1999; Hobbs et al., 2008)의 결과와 유사하여 본 연구가 기존 연구를 성공적으로 벤치마크 하였음을 시사한다.
실제 암석권은 지각과 맨틀 등의 다양한 강도를 가진 물질의 다상체이며, 따라서 다층 구조의 좌굴은 자연에서 흔히 발견된다(Fossen, 2016). 이에 따라 다층 구조를 적용한 수치 모형을 통해 좌굴 구조를 재현하는 것은 실제 자연의 좌굴 구조를 연구하는 데 중요하다. 우리가 개발한 좌굴 수치 모형에 2개의 강한 층을 삽입하였을 때에도 강한 층 주변에 큰 변형이 집중되어 격자의 대변형이 발생하였으나, 안정적으로 계산이 진행되었고 수치적 결과가 일정한 값에 수렴하였다. 본 연구에서 시험한 모형에서는 두 강한 층은 점성도와 영률을 동일하게 설정하였으나 두께에 차이를 두었다. 이 두께 차이에 의해 두 층은 총 강도(integrated strength)가 달라진다. 수치 모사 결과, 층과 층 사이의 거리가 매우 멀 경우에는 각 층이 서로 독립적인 파장과 진폭을 좌굴 구조를 형성한다. 층과 층 사이의 거리가 가까워 지면 각 층이 서로 응력을 교환하여 각 층의 고유 파장이 섞인 좌굴 구조, 혹은 한 층이 자신의 고유 파장을 완전히 상실하고 다른 층의 파장을 따르는 좌굴 구조를 보인다. 이는 기존 연구(Currie et al., 1962; Schmid and Podladchikov, 2006)와 부합하는 결과이며, 콤솔 멀티피직스는 유동학적 성질이 상이한 다수의 층으로 구성된 지각과 맨틀의 좌굴 구조 연구에 적합함을 지시한다. 본 연구를 활용하여 암석권 규모에서 얇은 고강도 층이 삽입된 지구조체의 좌굴 구조를 재현할 수 있고, 강도가 각기 다른 상부 지각, 하부 지각, 상부 맨틀로 구성된 샌드위치 형태를 갖는 암석권의 좌굴 구조에 대한 연구로 발전시킬 수 있을 것으로 기대된다. 본 연구를 토대로 암석권의 좌굴 구조를 수치 모사하여 실제 자연 현상을 구속하면 변형 시간과 변형률 등을 역산할 수 있어, 이를 바탕으로 지구조 진화 과정을 재구성할 수 있을 것으로 생각된다.
지난 수 십 년간 다수의 기존 연구에서 다양한 수치적 기법(예, 유한요소, 유한차분, 유한체적)을 바탕으로 라그랑지안(Lagrangian)과 오일러리안(Eulerian) 접근법을 이용해서 지구동역학적 현상(예, 섭입, 열개, 지진 및 좌굴 등)을 모사하였다(Dieterich, 1970; Huang et al., 1998; Toth and Gunis, 1998; Mancktelow 2002; Choi and Petersen, 2015). 본 연구에서는 라그랑지안 접근에 바탕을 둔 유한요소 모형을 개발하였다. 유한요소법에서는 지배 방정식(즉, 운동량 보존 방정식)을 각 요소에 대해 이산화(discretization)하여 국부 강성 행렬(local stiffness matrix)을 유도한다. 국부 강성 행렬을 모든 요소에 대해서 조립해서 전체 강성 행렬(global stiffness matrix)을 구성한다. 중력 등의 체적력(body force)과 경계조건을 반영하여 새로운 벡터를 구성하고 기존 전체 강성 행렬을 성형한 후, 역산을 진행하여 변위를 계산한다. 강성 행렬은 물성(본 연구의 경우 점성과 탄성) 및 요소를 이루는 절점의 좌표나 요소의 크기 등에 의해서 결정된다. 급격한 물성과 격자의 변형은 강성 행렬 내 성분 값 사이에 큰 차이를 유발해 역산을 어렵게 한다. 따라서 좌굴과 같이 격자의 크기가 급격하게 바뀌는 현상을 유한요소 수치 모사함에 있어서 역산 솔버(solver)의 능력은 매우 중요하다. 그뿐만 아니라, 본 연구에서는 시간 의존성 모형을 구성하였으므로 격자의 위치가 시간에 따라 변하기 때문에 매 시간 단계(time-step)마다 요소의 형태가 급격하게 변하고 매 시간 단계 마다 강성 행렬을 새로 구성하여야만 하므로, 효율적인 강성 행렬 성분 계산과 조립 방법이 필수적이다. 현존하는 다양한 역산 솔버(즉, MUMPS, PARDISO, SPOOLES 등)와 다양한 고차원 요소(8-node quadrilateral element 등)을 두루 도입한 콤솔 멀티피직스는 본 연구에서 설정한 좌굴 모형을 성공적으로 모사하였으며, 이는 콤솔 멀티피직스가 차후 더 복잡한 대변형을 수반하는 지구동역학적 문제를 라그랑지안 접근으로 다루기에 적합함을 의미한다.
실제 자연에서 암석권과 맨틀의 점성은 온도와 압력에 지수적으로 의존한다. 다수의 암석 실험(예, Ranalli, 1995)을 통해서 지각과 맨틀 암석의 물성에 전위 크리프(dislocation creep) 또는 확산 크리프(diffusion creep) 등의 온도와 압력에 의존하는 점성도를 사용하여야 실제 자연에서의 암석의 점성도를 현실적으로 매개화할 수 있음을 알아냈다. 본 연구에서는 기존 연구(Schmalholz et al., 2014)와 같은 방식을 도입하여, 온도와 압력에 대해 의존하지 않는 점성도를 사용하였다. 상세한 공간 규모를 설명하기 위해서는 온도와 압력에 민감한 물성을 고려하여야 하지만, 섭입대, 지각평형, 암석권의 융기 등 큰 스케일 (수 백 km 단위)로 지구물리 자료는 단순한 점성도를 사용해도 충분히 설명할 수 있었다 (Capitanio et al., 2007; Bischoff and Flesch, 2018). 우리 실험에서는 점성도가 온도와 압력에 의존하지 않기 때문에 일정한 파장을 보이는 좌굴 구조가 발생한다. 실제 자연에서는 큰 공간적 규모에서 주된 좌굴이 존재하고 작은 좌굴이 그 위에 중첩되는 현상이 관찰되는데 이러한 복잡한 좌굴 구조의 재현하기 위해서는 차후 온도와 압력에 의존하는 점성도를 도입하여야 할 것으로 판단된다. Hobbs et al. (2008)은 온도-압력 의존성 점성도를 적용한 수치 모형을 개발해 여러 파장이 합성된 불규칙한 모양을 갖는 좌굴 구조를 재현하였다. 그러나, 수치 모형을 판구조적 공간적 규모와 기계적 강도에 훨씬 못 미치게 제작하였다. 본 연구를 기존 연구와 조합하면, 자연에서 나타나는 다양한 규모와 다중 파장을 보이는 좌굴 구조를 재현할 수 있을 것으로 예상된다.
본 연구에서는 최대 ~9 GPa 정도의 폰 미세스 응력이 도출되었는데, 이는 기존의 연구(Funiciello et al., 2003; Capitanio et al., 2009; Jarosinski, 2012)에서 나타난 암석권 규모에서의 폰 미세스 응력 값에 비해 매우 높은 수준이다. 본 연구에서 기존 연구에서 사용한 기계적 강도보다 10배 이상 강한 현실적인 기계적 강도를 사용하였기 때문에 나타나는 현상으로 판단되지만, 그럼에도 불구하고 Hanks and Raleigh (1980) 등이 제시한 100 - 200 MPa의 좌굴 구조 내 응력을 설명하기에는 부족하다. 우리가 벤치마크 대상으로 설정한 Zhang et al. (1996)과 Mancktelow (1999)의 연구에서는 응력을 수평 편차 응력(horizontal deviatoric stress, )으로 계산하였다. 기존 계산 방식을 이용해서 우리의 수치 모형을 계산하면, 약한 모암과 강한 층의 수평 편차 응력은 각각 최대 ~2.5 MPa과 ~70 MPa정도로 기존 연구에서 제시한 범위 내에 놓여있다. 본 연구의 모형은 지구의 심부에서 생기는 좌굴 현상까지 감안하여 개발하였다. 최근 심발지진의 발생 가능성을 암석역학적으로 실험한 연구에서 ~600 km 깊이의 심발지진 발생을 위해서는 ~2 GPa 이상의 편향 응력이 필요함을 제시하고 있다(Schubnel et al., 2013). 중발지진(약 70 - 300 km 깊이에서 발생) 시 동반되는 전단열에 의해서 생성된 슈도타킬라이트(pseudotachylyte)에 관한 현장 연구(Andersen et al., 2008)에서도 해당 깊이의 응력이 적어도 1.5 GPa에 이른다고 주장하고 있다. 그뿐만 아니라, 해양 암석권보다 상대적으로 기계적 강도가 약한 것으로 알려진 대륙 암석권에서 발생한 진원 깊이 75 km인 지진의 응력 강하(stress drop)을 추정해보면 > 300 MPa 이며(Prieto et al., 2017) 이는 대륙 암석권의 응력이 GPa 단위임을 지시한다. 기존 연구 결과를 종합해보면 수평 응력만을 고려하는 것이 아니라, 본 연구와 같이 응력 텐서의 모든 성분을 반영한 폰 미세스 응력을 이용해 좌굴 구조의 응력을 추정하는 것이 더 타당함을 의미한다.
암석권에 작용하는 지구조 응력의 방향과 크기는 같은 지역에서도 시간에 따라 회전할 수도 있고(Otofuji et al., 1985), 압축과 인장이 반전되기도 한다(Uyeda and Kanamori, 1979). 좌굴에 관한 수치 모형에도 모암과 강한 층에 작용하는 힘의 방향 변화를 도입하고 시험해 볼 필요가 있다. 점탄성 물성을 지구동역학적 수치 모사에 적용하였음은 곧 시간 의존성 기계적 강도를 고려하였음을 의미한다. 즉, 지구조체에 가해지는 변형의 역사가 중요하다. 예를 들어, 같은 양의 변형이 발생하더라도 압축만이 가해진 경우와 압축과 인장이 반복적으로 가해진 경우는 서로 다른 형태의 좌굴 구조 형태를 보일 수 있다. 가역적 물성인 탄성이 점탄성의 일부를 지배하고 있음을 감안하면 압축력이 가해진 시기에 생긴 좌굴이 인장 시기에는 복원될 수 있기 때문이다. 그 뿐만 아니라 지구조 응력의 반전 없이 같은 방향으로 전단력이 일정하게 작용해도 강한 층에 좌굴이 발생하고 복원되는 것이 가능함을 수치 모사로 확인하였으며 실제 자연에서 발견된 좌굴 구조를 설명하였다(Llorens et al., 2013). 즉, 지구의 좌굴 구조는 수평 압축력 외에도 전단 응력에 의해서도 발생할 수 있다. 따라서 실제 지형에 나타난 좌굴 구조를 수치 모사할 때, 그 지역의 지구조 응력의 방향과 변형의 역사를 모두 반영하여야만 하며, 이를 위해 상세한 현장 조사의 뒷받침이 필요하다.
한반도와 그 일원은 백악기의 고태평양판에 섭입에 따른 압축과 태평양판의 슬랩 롤백(slab rollback)으로 인한 확장(Kim et al., 2016), 신생대 제4기의 인도판과 아시아판 사이 충돌(Park et al., 2006)과 섭입하는 태평양 판(Choi et al., 2012)으로 인한 응력으로 동북동-서남서 방향으로 압축까지 다양한 응력장의 변화를 겪었다. 한반도의 응력장의 시간에 따른 변화는 동해의 지각에 도미노 모양의 단층, 지루와 지구, 좌굴 구조 등의 다양한 지형을 형성하였다(Kim, H.J. et al., 2018). 그뿐만 아니라 최근 한반도의 동쪽 주변부에서 발견된 좌굴 구조는 한반도가 동서방향으로 압축을 받고 있음을 지시한다(Kim, G.-B. et al., 2018). 본 연구를 활용하여 한반도 동쪽 주변부에서 발견된 좌굴 구조를 진폭과 파장을 수치 모사할 수 있다면, 동해의 지각 구조 및 강도, 응력의 크기를 역산할 수 있을 것으로 사료된다.
5. 결 론
우리는 상용 유한요소 소프트웨어 콤솔 멀티피직스를 활용하여, 맥스웰 점탄성 물성을 갖는 판구조 규모의 좌굴 수치 모형을 2차원 라그랑지안 방법으로 개발하였다. 약한 모암에 강한 층 하나가 샌드위치 형태로 삽입된 모형에 대한 좌굴 수치 모사 결과 기존 연구와 매우 유사한 경향을 보였다. 즉, 강한 층과 약한 모암의 점탄성 대비가 클수록 파장이 길어지고, 진폭이 커진다. 강한 층의 두께가 두꺼울수록 파장이 길어지고, 진폭이 커진다. 점탄성 대비가 클수록 더 낮은 변형률에서 좌굴 구조의 생성이 시작된다. 본 연구에서는 초기 섭동의 파장에 따른 좌굴 구조가 생성되는 시작하는 시점을 확인하였다. 강한 층의 두께가 얇은 경우는 초기 섭동에 영향을 많이 받으나, 점탄성 대비가 클 경우에는 점탄성 대비에 영향을 많이 받아 좌굴 구조가 형성된다. 층을 갖는 좌굴 수치 모사를 통해 층간의 거리에 따른 응력 교환 양상을 비교하여, 기존 다층 좌굴에 대한 연구의 결과와 유사한 결과를 얻었다. 층간의 거리가 매우 멀 경우는 실제 1층 좌굴 구조를, 중간의 경우는 진 다층 좌굴 구조를, 매우 가까운 경우는 유효 1층 좌굴 구조를 형성하였다.
좌굴 구조 수치 모사에는 급격한 물성의 공간적 변화와 급격한 격자 변형을 감당할 수 있는 솔버가 필수적이다. 또한, 기존 연구에서는 매우 작은 공간적 규모(수백 m 단위)와 낮은 기계적 점탄성도(탄성 영률은 109 Pa, 점성도는 1020 Pa·s)를 적용하였지만, 본 연구에서는 좌굴 구조가 지구의 심부에서도 발생할 수 있으며 대규모로 발생할 수 있다는 점을 고려해 큰 공간적 규모(수십 km 단위)와 강한 기계적 강도(영률과 점성도가 각각 7.5 × 10¹⁰ Pa과 1.0 × 10²³ Pa·s 이상)를 도입하였다. 그 결과 안정적인 계산 수렴 양상을 보였다. 이는 본 연구에서 콤솔 멀티피직스를 이용한 개발한 좌굴 모형이 복잡한 물성과 대변형을 효율적으로 계산함을 의미한다. 우리의 연구는 대규모(즉, 해양과 대륙 암석권 수준)의 좌굴 구조 수치 모사 연구에 적극적으로 활용할 수 있을 것으로 기대된다.
Acknowledgments
본 연구는 한국연구재단의 대통령POST_DOC펠로우쉽(NRF-2014R1A6A3A04055841), 행정안전부 ‘지진방재분야 전문인력 양성’ 사업과 기상청 기상·지진 See-At기술개발사업(KMI2018-02110), 신진연구지원 사업(NRF-2019R1C1C1010804)의 지원으로 수행되었습니다. 본 논문에 대하여 세심한 조언을 주신 익명의 심사위원과 김기범 박사님께 감사드립니다.
References
-
Andersen, T.B., Mair, K., Austrheim, H., Podladchikov, Y. Y., and Vrijmoed, J.C., (2008), Stress release in exhumed intermediate and deep earthquakes determined from ultramafic pseudotachylyte, Geology, 36, p995-998.
[https://doi.org/10.1130/g25230a.1]

-
Beekman, F., Bull, J.M., Cloetingh, S., and Scrutton, R.A., (1996), Crustal fault reactivation facilitating lithospheric folding/buckling in the central Indian Ocean, Geological Society, London, Special Publications, 99, p251-263.
[https://doi.org/10.1144/gsl.sp.1996.099.01.19]

-
Biot, M.A., (1961), Theory of Folding of Stratified Viscoelastic Media and Its Implications in Tectonics and Orogenesis1, Geological Society of America bulletin, 72, p1595-1620.
[https://doi.org/10.1130/0016-7606(1961)72[1595:tofosv]2.0.co;2]

-
Biot, M.A., ODÉ, H., and Roever, W., (1961), Experimental verification of the theory of folding of stratified viscoelastic media, Geological Society of America bulletin, 72, p1621-1631.
[https://doi.org/10.1130/0016-7606(1961)72[1621:evotto]2.0.co;2]

- Bischoff, S., and Flesch, L., (2018), Impact of Lithospheric Strength Distribution on India-Eurasia Deformation From 3-D Geodynamic Models, Journal of Geophysical Research: Solid Earth, 124, p1084-1105.
-
Bordenave, M.L., and Hegre, J.A., (2005), The influence of tectonics on the entrapment of oil in the dezful embayment, zagros foldbelt, iran, Journal of Petroleum Geology, 28, p339-368.
[https://doi.org/10.1111/j.1747-5457.2005.tb00087.x]

-
Bott, M.H.P., and Kusznir, N.J., (1984), The origin of tectonic stress in the lithosphere, Tectonophysics, 105, p1-13.
[https://doi.org/10.1016/0040-1951(84)90190-2]

-
Burg, J.-P., and Podladchikov, Y., (1999), Lithospheric scale folding: Numerical modelling and application to the Himalayan syntaxes, International Journal of Earth Sciences, 88, p190-200.
[https://doi.org/10.1007/s005310050259]

-
Burg, J.-P., and Schmalholz, S.M., (2008), Viscous heating allows thrusting to overcome crustal-scale buckling: Numerical investigation with application to the Himalayan syntaxes, Earth and Planetary Science Letters, 274, p189-203.
[https://doi.org/10.1016/j.epsl.2008.07.022]

-
Burov, E.B., (2011), Rheology and strength of the lithosphere, Marine and Petroleum Geology, 28, p1402-1443.
[https://doi.org/10.1016/j.marpetgeo.2011.05.008]

-
Burov, E.B., and Diament, M., (1995), The effective elastic thickness (Te) of continental lithosphere: What does it really mean?, Journal of Geophysical Research: Solid Earth, 100, p3905-3927.
[https://doi.org/10.1029/94jb02770]

-
Calais, E., Freed, A.M., Van Arsdale, R., and Stein, S., (2010), Triggering of New Madrid seismicity by late-Pleistocene erosion, Nature, 466, p608-611.
[https://doi.org/10.1038/nature09258]

-
Capitanio, F.A., Morra, G., and Goes, S., (2007), Dynamic models of downgoing plate-buoyancy driven subduction: Subduction motions and energy dissipation, Earth and Planetary Science Letters, 262, p284-297.
[https://doi.org/10.1016/j.epsl.2007.07.039]

-
Capitanio, F.A., Morra, G., and Goes, S., (2009), Dynamics of plate bending at the trench and slab-plate coupling, Geochemistry, Geophysics, Geosystems, 10, p1-15.
[https://doi.org/10.1029/2008gc002348]

-
Caporali, A., (2000), Buckling of the lithosphere in western Himalaya: Constraints from gravity and topography data, Journal of Geophysical Research: Solid Earth, 105, p3103-3113.
[https://doi.org/10.1029/1999jb900389]

-
Choi, E., and Petersen, K.D., (2015), Making Coulomb angle-oriented shear bands in numerical tectonic models, Tectonophysics, 657, p94-101.
[https://doi.org/10.1016/j.tecto.2015.06.026]

- Choi, H., Hong, T.-K., He, X., and Baag, C.-E., (2012), Seismic evidence for reverse activation of a paleo-rifting system in the East Sea (Sea of Japan), Tectonophysics, 572-573, p123-133.
- Cloetingh, S., and Burov, E., (2010), Lithospheric folding and sedimentary basin evolution: A review and analysis of formation mechanisms, Basin Research, 23, p257-290.
-
Cloetingh, S., Burov, E., Beekman, F., Andeweg, B., Andriessen, P.A.M., Garcia-Castellanos, D., de Vicente, G., and Vegas, R., (2002), Lithospheric folding in Iberia, Tectonics, 21, p1-26.
[https://doi.org/10.1029/2001tc901031]

-
Crameri, F., Schmeling, H., Golabek, G.J., Duretz, T., Orendt, R., Buiter, S.J.H., May, D.A., Kaus, B.J.P., Gerya, T.V., and Tackley, P.J., (2012), A comparison of numerical surface topography calculations in geodynamic modelling: An evaluation of the ‘sticky air’ method, Geophysical Journal International, 189, p38-54.
[https://doi.org/10.1111/j.1365-246x.2012.05388.x]

- Crutchley, G.J., Kroeger, K.F., Pecher, I.A., and Gorman, A.R., (2018), How tectonic folding influences gas hydrate formation: New Zealand’s Hikurangi subduction margin, Geology, 47, p39-42.
- Curi, F., (1993), Oil Generation and Accumulation in the Albanide Ionian Basin, Generation, Accumulation and Production of Europe’s Hydrocarbons, 3, p281-293.
-
Currie, J.B., Patnode, H.W., and Trump, R.P., (1962), Development of folds in sedimentary strata, Geological Society of America bulletin, 73, p655-673.
[https://doi.org/10.1130/0016-7606(1962)73[655:dofiss]2.0.co;2]

-
Dieterich, J.H., and Carter, N.L., (1969), Stress-History of Folding, American Journal of Science, 267, p129-154.
[https://doi.org/10.2475/ajs.267.2.129]

-
Dieterich, J.H., (1970), Computer experiments on mechanics of finite amplitude folds, Canadian Journal of Earth Sciences, 7, p467-476.
[https://doi.org/10.1139/e70-039]

- Donath, F.A., and Parker, R.B., (1964), folds and folding, Geological Society of America bulletin, 75, p45-62.
-
Farrington, R.J., Moresi, L.-N., and Capitanio, F.A., (2014), The role of viscoelasticity in subducting plates, Geochemistry, Geophysics, Geosystems, 15, p4291-4304.
[https://doi.org/10.1002/2014gc005507]

- Fossen, H., (2016), Structural geology, Cambridge University Press, Cambridge, p257.
- Funiciello, F., Morra, G., Regenauer-Lieb, K., and Giardini, D., (2003), Dynamics of retreating slabs: 1. Insights from two-dimensional numerical experiments, Journal of Geophysical Research: Solid Earth, 108, p1-17.
-
Geller, C.A., Weissel, J.K., and Anderson, R.N., (1983), Heat transfer and intraplate deformation in the central Indian Ocean, Journal of Geophysical Research, 88, p1018.
[https://doi.org/10.1029/jb088ib02p01018]

-
Gerbault, M., (2000), At what stress level is the central Indian Ocean lithosphere buckling?, Earth and Planetary Science Letters, 178, p165-181.
[https://doi.org/10.1016/s0012-821x(00)00054-6]

-
Gerbault, M., Burov, E.B., Poliakov, A.N.B., and Daignières, M., (1999), Do faults trigger folding in the lithosphere?, Geophysical Research Letters, 26, p271-274.
[https://doi.org/10.1029/1998gl900293]

-
Gleason, G.C., and Tullis, J., (1995), A flow law for dislocation creep of quartz aggregates determined with the molten salt cell, Tectonophysics, 247, p1-23.
[https://doi.org/10.1016/0040-1951(95)00011-b]

-
Goetze, C., and Evans, B., (1979), Stress and temperature in the bending lithosphere as constrained by experimental rock mechanics, Geophysical Journal International, 59, p463-478.
[https://doi.org/10.1111/j.1365-246x.1979.tb02567.x]

-
Guest, B., Guest, A., and Axen, G., (2007), Late Tertiary tectonic evolution of northern Iran: A case for simple crustal folding, Global and Planetary Change, 58, p435-453.
[https://doi.org/10.1016/j.gloplacha.2007.02.014]

-
Hanks, T.C., and Raleigh, C.B., (1980), The conference on magnitude of deviatoric stresses in the earth’s crust and uppermost mantle, Journal of Geophysical Research, 85, p6083-6085.
[https://doi.org/10.1029/jb085ib11p06083]

-
Hobbs, B., Regenauer-Lieb, K., and Ord, A., (2008), Folding with thermal-mechanical feedback, Journal of Structural Geology, 30, p1572-1592.
[https://doi.org/10.1016/j.jsg.2008.09.002]

-
Huang, S., Sacks, I.S., and Snoke, J.A., (1998), Compressional deformation of island-arc lithosphere in northeastern Japan resulting from long-term subduction-related tectonic forces: finite-element modeling, Tectonophysics, 287, p43-58.
[https://doi.org/10.1016/s0040-1951(98)80060-7]

-
Hudleston, P.J., (1973), An analysis of ‘Single-layer’ folds developed experimentally in viscous media, Tectonophysics, 16, p189-214.
[https://doi.org/10.1016/0040-1951(73)90012-7]

-
Hudleston, P.J., and Lan, L., (1993), Information from fold shapes, Journal of Structural Geology, 15, p253-264.
[https://doi.org/10.1016/0191-8141(93)90124-s]

- Jarosinski, M., (2012), Compressive deformations and stress propagation in intracontinental lithosphere: Finite element modeling along the Dinarides-East European Craton profile, Tectonophysics, 526-529, p24-41.
-
Kim, G.-B., Yoon, S.-H., Kim, S.-S., and So, B.-D., (2018), Transition from buckling to subduction on strike-slip continental margins: Evidence from the East Sea (Japan Sea), Geology, 46, p603-606.
[https://doi.org/10.1130/g40305.1]

-
Kim, H.-J., Jou, H.-T., and Lee, G.H., (2018), Neotectonics of the Eastern Korean Margin Inferred from Back-arc Rifting Structure, Ocean Science Journal, 53, p601-609.
[https://doi.org/10.1007/s12601-018-0036-9]

-
Kim, S.W., Kwon, S., Park, S.I., Lee, C., Cho, D.L., Lee, H.J., Ko, K., and Kim, S.J., (2016), SHRIMP U-Pb dating and geochemistry of the Cretaceous plutonic rocks in the Korean Peninsula: a new tectonic model of the Cretaceous Korean Peninsula, Lithos, 262, p88-106.
[https://doi.org/10.1016/j.lithos.2016.06.027]

-
Lee, C., and King, S.D., (2011), Dynamic buckling of subducting slabs reconciles geological and geophysical observations, Earth and Planetary Science Letters, 312, p360-370.
[https://doi.org/10.1016/j.epsl.2011.10.033]

-
Liu, X., Eckert, A., and Connolly, P., (2016), Stress evolution during 3D single-layer visco-elastic buckle folding: Implications for the initiation of fractures, Tectonophysics, 679, p140-155.
[https://doi.org/10.1016/j.tecto.2016.04.042]

-
Llorens, M.-G., Bons, P.D., Griera, A., and Gomez-Rivas, E., (2013), When do folds unfold during progressive shear?, Geology, 41, p563-566.
[https://doi.org/10.1130/g33973.1]

-
Lu, G., Kaus, B.J.P., and Zhao, L., (2011), Thermal localization as a potential mechanism to rift cratons, Physics of the Earth and Planetary Interiors, 186, p125-137.
[https://doi.org/10.1016/j.pepi.2011.04.006]

-
Mancktelow, N.S., (1999), Finite-element modelling of single-layer folding in elasto-viscous materials: The effect of initial perturbation geometry, Journal of Structural Geology, 21, p161-177.
[https://doi.org/10.1016/s0191-8141(98)00102-3]

-
Mancktelow, N.S., (2002), Finite-element modelling of shear zone development in viscoelastic materials and its implications for localisation of partial melting, Journal of Structural Geology, 24, p1045-1053.
[https://doi.org/10.1016/s0191-8141(01)00090-6]

- Marques, F.O., and Mandal, N., (2016), Post-buckling relaxation of an elastic layer and its geological relevance: Insights from analogue experiments in pure shear, Tectonophysics, 668-669, p82-91.
-
Martinod, J., and Davy, P., (1994), Periodic instabilities during compression of the lithosphere: 2. Analogue experiments, Journal of Geophysical Research: Solid Earth, 99, p12057-12069.
[https://doi.org/10.1029/93jb03599]

-
McAdoo, D.C., and Sandwell, D.T., (1985), Folding of oceanic lithosphere, Journal of Geophysical Research: Solid Earth, 90, p8563-8569.
[https://doi.org/10.1029/jb090ib10p08563]

-
Moorkamp, M., Fishwick, S., Walker, R.J., and Jones, A.G, (2019), Geophysical evidence for crustal and mantle weak zones controlling intra-plate seismicity - the 2017 Botswana earthquake sequence, Earth and Planetary Science Letters, 506, p175-183.
[https://doi.org/10.1016/j.epsl.2018.10.048]

-
Noble, T.E., and Dixon, J.M., (2011), Structural evolution of fold-thrust structures in analog models deformed in a large geotechnical centrifuge, Journal of Structural Geology, 33, p62-77.
[https://doi.org/10.1016/j.jsg.2010.12.007]

-
Otofuji, Y.-I., Matsuda, T., and Nohda, S., (1985), Opening mode of the Japan Sea inferred from the palaeomagnetism of the Japan Arc, Nature, 317, p603-604.
[https://doi.org/10.1038/317603a0]

-
Park, Y., Ree, J.-H., and Yoo, S.-H., (2006), Fault slip analysis of Quaternary faults in southeastern Korea, Gondwana Research, 9, p118-125.
[https://doi.org/10.1016/j.gr.2005.06.007]

-
Prieto, G.A., Froment, B., Yu, C., Poli, P., and Abercrombie, R., (2017), Earthquake rupture below the brittle-ductile transition in continental lithospheric mantle, Science Advances, 3, e1602642.
[https://doi.org/10.1126/sciadv.1602642]

- Ranalli, G., (1995), Rheology of the Earth, 2nd edn., Chapman and Hall, London, p413.
-
Ribe, N.M., Stutzmann, E., Ren, Y., and van der Hilst, R., (2007), Buckling instabilities of subducted lithosphere beneath the transition zone, Earth and Planetary Science Letters, 254, p173-179.
[https://doi.org/10.1016/j.epsl.2006.11.028]

-
Schubnel, A., Brunet, F., Hilairet, N., Gasc, J., Wang, Y., and Green II, H.W., (2013), Deep-Focus Earthquake Analogs Recorded at High Pressure and Temperature in the Laboratory, Science, 341, p1377-1380.
[https://doi.org/10.1126/science.1240206]

-
Schmalholz, S.M., and Mancktelow, N.S., (2016), Folding and necking across the scales: a review of theoretical and experimental results and their applications, Solid Earth Discusiions, 7, p1417-1465.
[https://doi.org/10.5194/se-7-1417-2016]

-
Schmalholz, S.M., Medvedev, S., Lechmann, S.M., and Podladchikov, Y., (2014), Relationship between tectonic overpressure, deviatoric stress, driving force, isostasy and gravitational potential energy, Geophysical Journal International, 197, p680-696.
[https://doi.org/10.1093/gji/ggu040]

-
Schmalholz, S.M., and Podladchikov, Y.Y., (1999), Buckling versus Folding: Importance of Viscoelasticity, Geophysical Research Letters, 26, p2641-2644.
[https://doi.org/10.1029/1999gl900412]

-
Schmalholz, S.M., and Podladchikov, Y.Y., (2001), Viscoelastic folding: Maxwell versus Kelvin Rheology, Geophysical Research Letters, 28, p1835-1838.
[https://doi.org/10.1029/2000gl012158]

-
Schmalholz, S.M., Podladchikov, Y.Y., and Burg, J.-P., (2002), Control of folding by gravity and matrix thickness: Implications for large-scale folding, Journal of Geophysical Research: Solid Earth, 107, p1-16.
[https://doi.org/10.1029/2001jb000355]

-
Schmid, D.W., and Podladchikov, Y.Y., (2006), Fold amplification rates and dominant wavelength selection in multilayer stacks, Philosophical Magazine, 86, p3409-3423.
[https://doi.org/10.1080/14786430500380175]

-
Sherkati, S., Letouzey, J., and Frizon de Lamotte, D., (2006), Central Zagros fold-thrust belt (Iran): New insights from seismic data, field observation, and sandbox modeling, Tectonics, 25, p1-27.
[https://doi.org/10.1029/2004tc001766]

-
Shin, Y.H., Shum, C.K., Braitenberg, C., Lee, S.M., Na, S.-H., Choi, K.S., Hsu, H., Park, Y.S., and Lim, M., (2015), Moho topography, ranges and folds of Tibet by analysis of global gravity models and GOCE data, Scientific Reports, 5, p1-7.
[https://doi.org/10.1038/srep11681]

-
Shin, Y.H., Shum, C.K., Braitenberg, C., Lee, S.M., Xu, H., Choi, K.S., Baek, J.H., and Park, J.U., (2009), Three-dimensional fold structure of the Tibetan Moho from GRACE gravity data, Geophysical Research Letters, 36, p1-5.
[https://doi.org/10.1029/2008gl036068]

- Shipley, T.H., Houston, M.H., Buffler, R.T., Shaub, F.J., McMillen, K.J., Ladd, J.W., and Worzel, J.L., (1979), Seismic Evidence for Widespread Possible Gas Hydrate Horizons on Continental Slopes and Rises, American Association of Petroleum Geologists Bulletin, 63, p2204-2213.
-
Smith, R.B., (1975), Unified theory of the onset of folding, boudinage, and mullion structure, Geological Society of America bulletin, 86, p1601-1609.
[https://doi.org/10.1130/0016-7606(1975)86<1601:utotoo>2.0.co;2]

-
Stephenson, R.A., and Cloetingh, S.A.P.L., (1991), Some examples and mechanical aspects of continental lithospheric folding, Tectonophysics, 188, p27-37.
[https://doi.org/10.1016/0040-1951(91)90312-g]

- Thielmann, M., and Kaus, B.J.P., (2012), Shear heating induced lithospheric-scale localization: Does it result in subduction?, Earth and Planetary Science Letters, 359-360, p1-13.
-
Toth, J., and Gurnis, M., (1998), Dynamics of subduction initiation at preexisting fault zones, Journal of Geophysical Research: Solid Earth, 103, p18053-18067.
[https://doi.org/10.1029/98jb01076]

- Turcotte, D.L., and Schubert, G., (2002), Geodynamics, (second ed.), Cambridge University Press, Cambridge, p187.
-
Uyeda, S., and Kanamori, H., (1979), Back-arc opening and the mode of subduction, Journal of Geophysical Research, 84, p1049-1061.
[https://doi.org/10.1029/jb084ib03p01049]

-
van Wijk, J.W., and Cloetingh, S.A.P.L., (2002), Basin migration caused by slow lithospheric extension, Earth and Planetary Science Letters, 198, p275-288.
[https://doi.org/10.1016/s0012-821x(02)00560-5]

-
Yuen, D.A., and Peltier, W.R., (1982), Normal modes of the viscoelastic earth, Geophysical Journal International, 69, p495-526.
[https://doi.org/10.1111/j.1365-246x.1982.tb04962.x]

-
Zhang, Y., Hobbs, B.E., Ord, A., and Mühlhaus, H.B., (1996), Computer simulation of single-layer buckling, Journal of Structural Geology, 18, p643-655.
[https://doi.org/10.1016/s0191-8141(96)80030-7]


