지질정보 데이터베이스 구축 및 자동화 알고리즘 개발
초록
현재 지리정보시스템은 컴퓨터 하드웨어의 처리속도, 기억/저장용량, 출력장치 등이 급속한 발달에 힘입어 지리정보를 필요로 하는 많은 분야에서 활용되고 있다. 그러나, 지질관련 자료를 포함한 모든 분야에서 기존 상용화된 GIS 소프트웨어를 사용할 경우, 다중속성자료의 일괄적 통합관리, 정보의 교환 및 활용, 작업의 자동화에 있어서 매우 불리하며, 자료처리에도 한계성을 갖는다. 이 연구에서는 지질관련 자료에 대한 기존 GIS S/W의 한계성을 극복하고, 목적에 따른 주제도 생성의 모든 과정이 하나의 S/W 환경 하에서 선택적으로 이루어질 수 있도록 지질정보 데이터베이스를 구축하는 선택적 알고리즘이 설계되었다. 지질정보의 정규화와 수집, 가공 자료를 저장한 2진파일 자료의 구축은 다중속성지질자료의 통합적인 관리를 가능케 하며, 다른 자료형식의 소프트웨어들의 경우에도 표준 형식의 자료교환이 가능하다. 설계된 알고리즘의 가공작업은 지질정보의 소분류별 모듈화를 기본으로 채택하기 때문에 다중속성자료를 갖는 다른 분야로의 확장도 가능하다. 개발된 알고리즘은 자동화 응용 프로그램(SaSo)에서 모듈 기반으로 되어 있으며, MS 윈도 운영체제 환경에서 주제도를 생성할 수 있도록 개발되었다. 이 자동화 응용 프로그램은 프로그래밍의 용이성 및 주제도 생성에 있어서 그 효율성이 검증되었다.
Abstract
At the present time, the geographic information system (GIS) is a widely used in many fields of geographic information since processing speed, memory and disk memory capacities, and output devices of computing hardwares are rapidly enhanced. If the data obtained from various relevant fields, including geological materials, have multiple attributes, existing commercial GIS softwares generally show definite limitations on integrated data management, exchange, utilization, and automatic processing. In this study, the geological information database of selective programming algorithm is constructed and designed so as to overcome the limitations of existing GIS S/W as well as to process all instructions with a single S/W in the creation of thematic maps. By normalizing geological information and constructing data format in the binary file for the collected and processed data, the constructed database can integrally manage the geological data with multiple properties and provide a standard format for data exchange, regardless of the individual S/W data format. The designed algorithm is basically to adopt the modular for the processing operation in the algorithm SaSo (smart sounding object) S/W and is developed to automatically generate thematic map in MS Window operating system. The SaSo S/W was verified in term of the efficiency of the constructed databases in term of the map creation and the easy programming of the designed algorithm.
Keywords:
Geological information, thematic map, data base, geographic information system (GIS), smart sounding object (SaSo)키워드:
지질정보, 주제도, 데이터베이스, 지리정보시스템, 자동화 응용 프로그램1. 서 론
지질정보 자료의 통합관리, 정보의 교환 및 활용, 작업의 자동화를 위한 데이터베이스 구축은 매우 중요하다. 종합적이고 체계적인 자료 관리와 효율적이고 자동화된 해석·분석·처리를 위해서, 컴퓨터 하드웨어(hardware: H/W)의 처리속도, 기억/저장용량, 출력장치 등의 급속한 발달로 지리정보시스템(Geographic information system: GIS)이 최근 많은 분야에서 활용되고 있다(Lee et al., 2008; Kang and Kim, 2009; Lee et al., 2009; Kang and Lee, 2012). GIS는 지리적으로 참조 가능한 모든 형태의 정보를 효과적으로 수집, 저장, 갱신, 조정, 분석, 표현할 수 있도록 설계된 컴퓨터의 하드웨어와 소프트웨어 및 지리적 자료, 인적자원의 통합체를 말하며, 협의적으로는 지표면의 위치 또는 장소를 설명하는 자료를 모으고, 이를 이용할 수 있게 하는 컴퓨터 S/W라고 할 수 있다. 대부분 활용분야에서 GIS 기법은 목적에 따라 자료를 수집하고, 수집자료에 대한 주제도(thematic map)를 생성한 후, 마지막으로 주제도를 대상으로 도형처리, 통계적 분석 및 해석 등의 일반적인 절차로 진행된다.
GIS 기법은 토지정보시스템(Land information system: LIS), 도시정보시스템(Urban information system: UIS), 교통정보시스템(Transport information system: TIS), 환경정보시스템(Environment information system: EIS) 등 많은 분야에 이용되고 있다. Jang and Jo (2011)는 시공간데이터모델(Spatiotemporal Data Model: STDM)을 활용하여 토지정보에 적합한 토지-STDM의 개념적 설명제시와 모델을 설계하였고 Kim et al. (2008)은 도시하수관거 및 도시지형 정보를 포함하는 UIS를 기반으로 도시침수분석을 위한 시스템을 개발하였으며, Jeong et al. (2002)은 읍·면 단위에서 수집한 수질오염원에 대한 정보를 이용하여 소유역의 환경정보체계(EIS) 구축, 오염원의 체계적 관리 방향을 제시하였다. 그러나, 목적에 따라 수집된 자료들은 자료자체의 의미, 즉 하나의 의미만을 갖는다(Kim et al., 2005). GIS에서 사용되는 일반적인 단일속성(하나의 의미만을 갖는 속성) 자료에는 토지이용 현황자료, 상수도 현황자료, 교통량자료, 수질측정자료 등이 있다. 그러나, 지질관련 분야에서는 일부 단일속성 자료(예, 수위측정자료, 단층주향/경사, 암석분포 등)뿐만 아니라, 많은 자료들이 수집자료 자체의 의미와 더불어 여러 다른 차원의 정보를 갖는 다중속성을 내포하고 있다. 예로서, 전기비저항탐사에서 현장에서 측정한 외견비저항값은 ‘상대적으로 이 지역은 전기를 잘 통한다 또는 상대적으로 통하지 않는다’와 같은 지질매체에 대한 일차적 정성적인 정보와 함께 차원변환(domain transformation), 즉 역산을 통하여 산출한 정량적 정보로서 지질매체의 구성매질의 실제 전기비저항값과 각 구성매질의 위치정보를 내포하고 있다. 이와 같이 차원변환을 통하여 생산된 자료를 가공자료, 차원변환 작업을 가공작업으로 정의한다.
다중속성의 자료를 GIS 기법을 활용하기 위해서는 최우선적으로 수집자료에 대하여 가공작업 후 산출된 여러 가공자료 중 주제도의 목적에 따라 주제값(이 연구에서는 P-value라 칭함)을 추출하여야 한다. 그러나 현재 개발·상용화하고 있는 GIS S/W들은 여러 분야에서 범용적 사용을 목적으로 개발되었기 때문에 다중속성을 갖는 수집자료에 대한 가공작업과 산출된 가공자료로부터 주제값을 추출하는 기능은 포함하지 않으며, 사용자 자신이 별도의 소프트웨어를 사용하여 작업해야 한다. 따라서 기존 GIS S/W를 사용하여 지질관련 다중속성 자료의 목적에 맞는주제도를 생성하기 위해서는 각 수집자료 별로 독립적이고 전문적으로 개발·상용화된 S/W를 사용하여 가공자료를 산출한 후, MS Excel과 같은 자료편집 S/W를 사용하여 여러 가공자료 중에서 목적에 적합한 주제값을 추출해야 한다. 그러므로 지질분야를 포함한 모든 분야에서 GIS S/W를 사용하는 것은 다중속성 자료 의 형식(수집자료 및 가공자료의 형식)이 사용한 S/W에 종속적이며, 자료의 통합관리, 정보의 교환 및 활용, 작업의 자동화 측면에서도 매우 불리하다.
이 연구에서는 기존 GIS S/W의 한계성을 극복하고, 목적에 따른 주제도 생성과 관련한 모든 과정이 하나의 S/W 환경 하에서 선택적으로 이루어지고, 또한 자료형식의 통일성을 위하여 지질정보 데이터베이스를 구축하였으며, 프로그래밍 알고리즘을 설계하였다. 주제도 생성에 있어서 구축된 데이터베이스와 알고리즘의 효율성 검증을 위한 응용 프로그램 SaSo (Smart sounding object) S/W를 MS 윈도 운영체제(operating system, OS)에서 개발하였으며, 전기비저항 1차원탐사자료를 사용하여 SaSo S/W 환경 하에서 주제도 생성의 사례를 예시하였다.
2. 연구방법
2.1 데이터베이스 구축 및 알고리즘 개발 방법론
수집된 지질관련 다중속성 자료의 주제도(이 연구에서는 프로파일 레이어라 칭함)를 생성하기 위해서는, 먼저 지질정보의 정규화를 통하여 수집자료와 및 수집자료로 부터 산출된 가공자료를 통합적으로 관리할 레이어(이 연구에서는 프로젝트 레이어라 칭함)를 생성하여야 한다. 지질관련 모든 자료를 대분류, 중분류, 소분류로 분류하였고, 각 분류의 코드형식은 6자리 문자열(12 byte)로 정의하였다(표 1). 대분류는 6자리 코드 중 처음 2자리 문자열(예, 물리탐사는 030000, 수리지질은 04000, 지표지질은 05000 등)로 정의하고, 중분류 코드는 대분류 코드 다음의 2자리 문자열(예, 전기비저항탐사는 030100, 전자탐사는 030200 등)로 정의하였다. 소분류의 코드는 중분류 코드 다음의 마지막 2자리 문자열(예, 1차원탐사는 030101, 2차원탐사는 030102, 1차원탐사 TEM는 030201, 1차원탐사 MT는 030202 등)로 정의하였다.
프로젝트 레이어 및 주제별 프로파일 레이어에 포함된 수집자료 및 가공자료, 생성된 모든 레이어의 속성 그리고 과업정보를 통합적이며 효율적으로 관리하기 위해서는 3개의 데이터베이스(SaSoMother, SaSoProject, PR“FileID”)로 구성된 관계형 데이터베이스인 MS Access 로 구축하였다. 그림 1은구축된 각 데이터베이스 간의 관계를 보여준다.
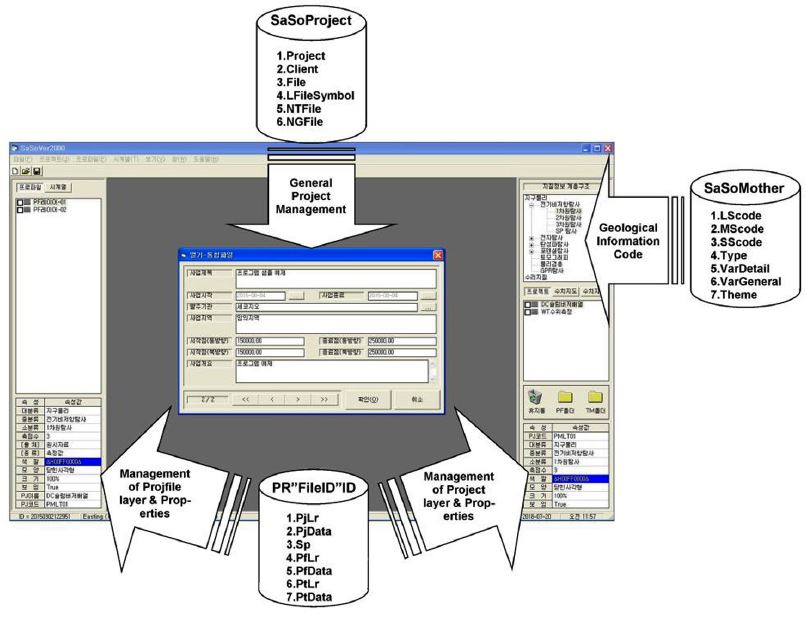
SaSo S/W based on three databases (SaSoMother, SaSoProject, and PR“FileID”). SaSoMother consists of seven tables, and manages the classified geological information. SaSoProject consists of six tables and manages all information related to the project which are title, starting and ending dates, coordinates of survey area, numerical topographical and geological files, and the name of MS Access and binary files. PR“FileID” consists of seven tables and manages the collected and processed data and the positioning information of all survey points contained in project, profile, and time-series layers).
2.2 주제도 생성 알고리즘
기존 GIS S/W를 사용하여 다중속성으로 분류되는 자료에 대한 주제도(주제별 프로파일 레이어)를 생성할 때는 많은 작업들(수집자료에 대한 차원변환, 수집자료가 시계열이면 사용할 시계열 선택, 주제선정에 따른 가공자료 선택 등)이 기존 GIS S/W 환경을 떠나 독립적이며 분야별로 전문적인 별도의 S/W를 선행적으로 사용하여야 한다. 그러므로 선행작업을 수행하는 동안 자료형식의 일관성을 유지할 수 없으므로 수집 및 가공자료에 대한 통합적 자동관리를 할 수 없으며, 또한 주제값을 수작업으로 선택하여야 한다.
그림 2는 주제도 생성과 관련한 모든 과정이 하나의 S/W 환경 하에서 선택적으로 이루어지도록 설계한 SaSo S/W의 알고리즘의 흐름도이다. 이 알고리즘의 주요 과정은 첫째, 수집한 자료로부터 소분류별 프로젝트 레이어를 생성하고, 둘째 만약 수집자료가 다중속성자료이면 차원변환을 통한 가공자료를 산출하고, 셋째 사용자가 분석·평가를 원하는 주제에 따라 프로파일 레이어를 생성하고, 넷째 수집/가공자료가 시계열자료이면 “어떤 시간의 자료를 사용할 것인가?”를 결정·선택하고, 마지막 과정에는 생성한 프로파일 레이어를 구성하는 모든 측점에서 해당 레이어의 주제에 따라 P-value값을 선정하여 주제도를 작성한다.
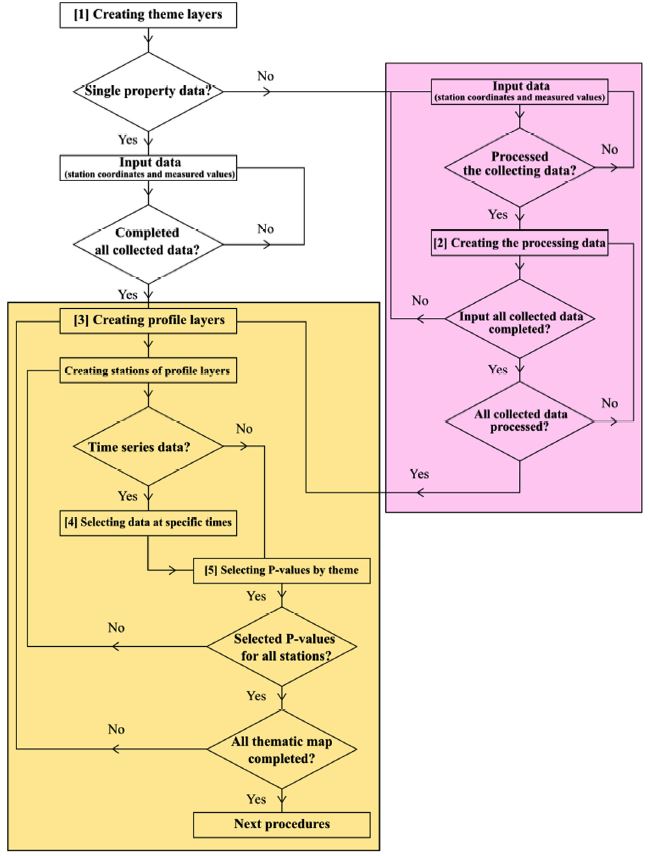
Procedures for creating theme layers of geological information (The pink- colored area is related to the domain transformation of multi-property data while the yellow-colored area to the creation of theme layers and the choice of P-value from the collected or the processed data produced from the pink-colored area).
3. 데이터베이스 구축 및 알고리즘 개발
3.1 SaSoMother 데이터베이스
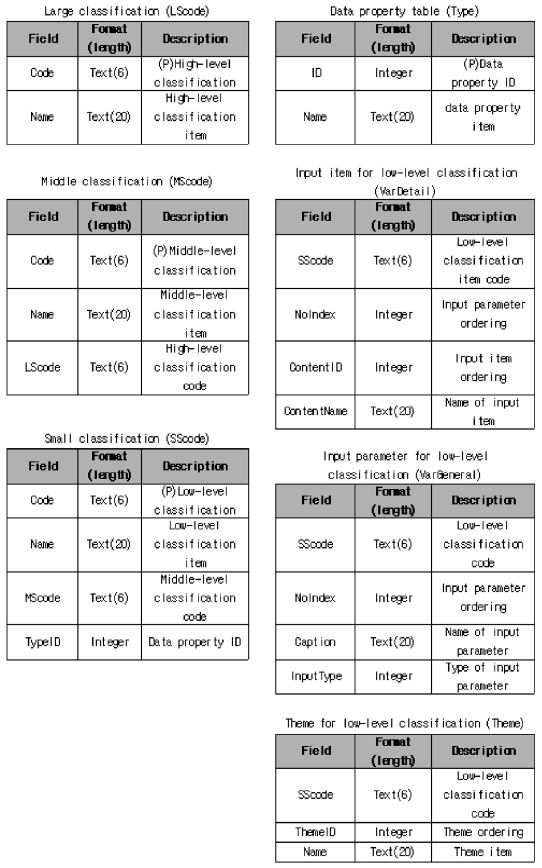
SaSoMother는 프로젝트 레이어의 생성에 직접적으로 관여하는 데이터베이스로서, 수집자료에 대한 표 1에서 정의한 지질정보의 대분류, 중분류, 소분류에 대한 코드와 항목, 대/중/소분류 간의 관계를 관리하며, 또한 소분류별 수집한 자료의 측정일시 및 측정변수에 대한 설정된 모든 값도 관리한다. SaSoMother 데이터베이스는 총 7개 테이블 LScode, MScode, SScode, Type, VarDetail, VarGeneral, Theme로 구성되었다. 각 테이블의 필드와 형식은 그림 3와 같다.
지질정보의 정규화를 기초로 구축된 LScode, MScode, SScode 테이블은 응용 프로그램인 SaSo S/W의 주 프레임(main flame)에서 “지질정보 계층구조” 영역의 트리구조(tree structure)를 형성한다(그림 1의 우측 최상단 폼). LScode, MScode, SScode 테이블에서 6자리 문자열로 선언한 코드 필드는 표 1에서 분류한 대분류, 중분류, 소분류에 대한 코드를 위한 필드이며, Name 필드는 대분류, 중분류, 소분류에 대한 항목명을 위한 필드이다. 각 테이블에서 “P”로 표시한 필드는 해당 테이블의 primary key로 정의한 것으로 하나의 테이블에서 중복 선언할 수 없는 유일한(unique) 필드이며, 다른 테이블에 의한 참조에 사용되는 필드이다.
수집자료에 대한 자료속성을 관리하는 Type 테이블은 2개의 필드, ID (정수로 나타냄)와 Name (문자열 형식) 필드로 구성되었다. 이 연구에서 자료속성을 4가지 항목, 첫째 점-단일속성(ID: 0, Name: 점-단일속성자료), 둘째 선-단일속성(ID: 1, Name: 선-단일속성자료), 셋째 점-다중속성(ID: 2, Name: 점-다중속성자료), 넷째 선-다중속성(ID: 3, Name: 선-다중속성자료)으로 분류했다. 여기서, “점(point)”은 측점 별로 그리고 “선(Line)”은 측선 별로 자료를 수집했다는 의미이다.
소분류별 수집자료의 측정일시와 측정변수에 대한 설정값을 관리하는 SaSoMother 데이터베이스의 테이블은 VarGeneral과 VarDetail 테이블이다(표 2, 3). 각 테이블에서 SScode 필드는 소분류 코드를 위한 필드이고, Integer로 선언한 NoIndex 필드는 소분류별 측정변수의 인덱스를 위한 필드이다. VarGeneral 테이블에서 Caption 필드는 입력변수명 그리고 InputType 필드는 입력변수에 대한 입력형식을 정의한 필드로서, 사용자가 직접 입력하는 변수는 0, 그리고 주어진 목록에서 선택하는 변수는 1의 필드값을 갖는다. 예로서 소분류로 전기비저항탐사의 1차원탐사, 2차원탐사, 수리지질, 수위측정에 대한 VarGeneral의 레코드는 표 2에 예시하였으며, VarGeneral 테이블은 하나의 소분류가 입력변수의 수에 따라 여러 개의 레코드를 포함할 수 있다. 여기서 1차원 전기비저항탐사의 경우, Caption 필드값이 전극배열인 입력변수는 선택형으로 설정되었다. 그 이유는 현장에서 1차원 탐사는 조사목적 및 조사환경에 따라 일반적으로 3가지 배열법, 즉 슐럼버져배열, 웨너배열, 임의배열 중 한 가지 배열법을 선택하기 때문이다.
VarDetail 테이블은 VarGeneral 테이블의 InputType 필드에서 설정한 변수의 입력형태 중 선택형에 대한 목록을 관리하는 테이블이다. 여기서 NoIndex 필드는 VarGeneral 테이블에서 소분류별 정의한 입력변수의 순서, ContentIndex 필드는 선택형 입력변수별 목록순서, ContentName 필드는 선택형 입력변수별 목록명을 위한 필드이다. 표 3은 1차원과 2차원 전기비저항탐사 그리고 수리지질의 수위측정으로부터 획득된 자료에 대한 VarDetail 테이블의 예제 레코드를 보여준다.
프로젝트 레이어로부터 주제별 프로파일 레이어를 생성할 때 참조하는 SaSoMother 데이터베이스의 Theme 테이블은 소분류별 주제항목을 관리한다. Theme 테이블의 SScode 필드는 소분류 코드를, 정수로 선언한 ThemeID 필드는 소분류별 주제항목의 순서를, 20자리 문자열 형식을 갖는 Name 필드는 소분류별 주제명을 위한 필드이다. 수집자료 중 단일속성을 갖는 자료는 단 하나의 주제(수집자료 자체)만을 가지나, 다중속성의 수집자료에는 수집자료 자체 주제와 더불어 가공작업으로 산출된 가공자료에 대한 여러 주제들이 존재한다. 예로서, 전기비저항 1차원탐사자료의 주제는 수집자료(현장 측정자료 자체)인 외견비저항 그리고 수집자료를 역산하여 산출한 각 지층의 두께(또는 깊이), 각 지층의 실제 전기비저항 등 총 3개의 주제가 존재한다. “해수침투에 의한 오염영역 평가 및 침투경로 파악”을 위하여 소분류 전기비저항 1차원탐사와 수리지질의 수위 및 수질측정에 대한 주제도를 생성한다고 가정할 경우, Theme 테이블의 레코드와 주제에 따라 생성한 주제도는 표 4와 같다. 여기서, 주제가 “외견비저항”인 수집자료로부터 심도에 따른 매질의 정성적 전기적 특성을 파악하기 위하여 주제도 1을 생성한다. 가공자료에서 주제 “층의 두께”에 대한 주제도 2는 지하수위 또는 해수침투경로에 대한 정보를, 주제도 3은 해수침투경로에 대한 정보를, 주제도 4는 해수침투경로에 대한 정보를 제공한다. 주제도 5는 가공자료에서 주제 “층의 전기비저항”에 대한 주제도로 해수침투에 의한 오염영역에 대한 정보를 제공한다. 수리지질의 소분류인 수위측정과 수질측정의 수집자료로부터 각각 주제도 6과 7이 생성한다. 그러므로 각 소분류에서 정의한 주제에서 분석목적에 따라 여러 주제도가 생성된다.
3.2 SaSoProject 데이터베이스
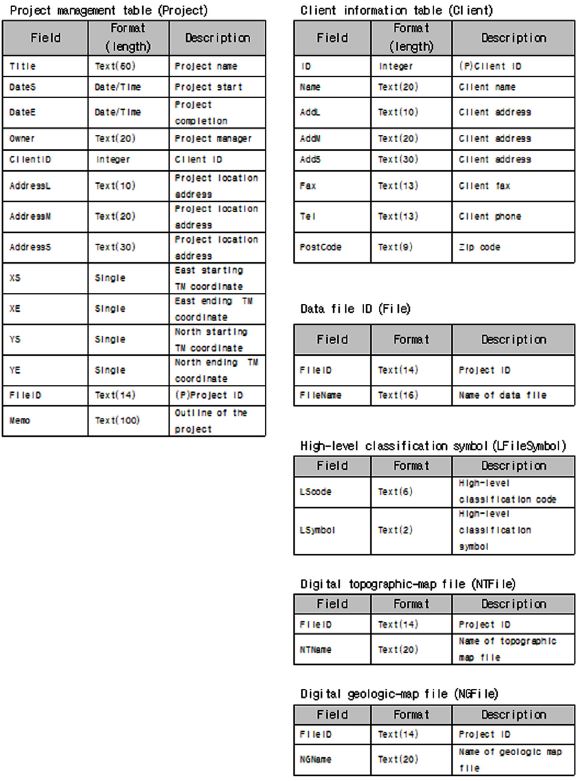
SaSoProject D/B는 신규과업 등록 및 기존과업 검색을 위한 모든 관련정보 그리고 과업별로 생성하고 업로드한 자료파일명의 유일코드를 총괄적으로 관리하는 데이터베이스이다(그림 1). SaSoProject D/B는 총 6개 테이블(Project, Client, File, LFileSymbol, NTFile, NGFile)로 구성되며, 각 테이블에 대한 필드와 형식은 그림 4와 같다.
Project 테이블은 14개 필드로 구성한다. 14개 문자열(yyyymmddhhmmss)의 형식을 갖는 FileID 필드를 Project 테이블의 Primary Key로 정의하였다. 여기서, yyyy, mm, dd와 hh, mm, ss는 각각 과업의 등록 년, 월, 일과 시, 분, 초를 의미한다. FileID 필드의 값은 등록된 과업에서 생성한 프로젝트, 프로파일, 시계열 레이어의 속성정보, 각 레이어에 포함된 측점의 속성 및 위치정보 등을 저장한 데이터베이스(PR“FileID”)와 모든 수집/가공자료를 저장한 2진파일의 이름에 유일성을 제공하기 위하여 사용된다.
Primary Key가 ID 필드인 Client 테이블은 Project 테이블의 ClientID 필드에 의해 참조되는 Look-up 테이블의 역할을 한다. Client 테이블은 총 10개 필드로 구성되며, 과업 의뢰기관 또는 의뢰인에 대한 모든 사무적 정보를 관리한다. File 테이블은 등록된 과업과 연관되어 SaSo S/W에 의해 생성된 모든 2진파일 및 MS Access 파일을 관리하는 테이블이다. LFileSymbol 테이블은 표 1의 대분류에 대한 기호를 저장한 테이블로서, SaSo S/W에 의해 생성된 모든 파일이름의 첫 2자리 문자열을 제공한다.
예로서 2015년 8월 15일 오전 9시 00분 00초에 SaSo S/W에 신규과업을 등록하고, 과업지역에서 전기비저항 1차원탐사와 수위측정을 수행한 후 각 소분류에 해당하는 프로젝트 레이어를 생성했다고 가정하자. SaSo S/W는 FileID 필드값으로 “20150815090000” 코드를 생성하고, 생성된 FileID 필드값과 표 1에서 프로젝트 레이어의 해당 소분류가 속한 대분류에 대한 기호를 사용하여 D/B 파일인 PR20150815090000.mdb를, 소분류인 전기비저항 1차원탐사의 수집자료 및 가공자료를 저장할 2진파일인 GP20150815090000.bin을 그리고 소분류인 수리지질의 수위측정 자료를 저장할 2진파일인 WT20150815090000.bin을 생성한다.
과업과 관련하여 SaSo S/W에 의해 업로드한 수치지형도와 수치지질도 파일을 각각 관리하는 NTFile과 NGFile 테이블은 각각 2개의 필드로 구성되어 있다. 각 테이블에서 FileID 필드는 테이블 Project의 Primary key인 과업별 FileID 필드값을 참조하며, NTFile 과 NGFile 필드는 각각 해당 과업에서 업로드한 수치지형도와 수치지질도의 파일명을 위한 필드이다.
3.3 PR“FileID” 데이터베이스
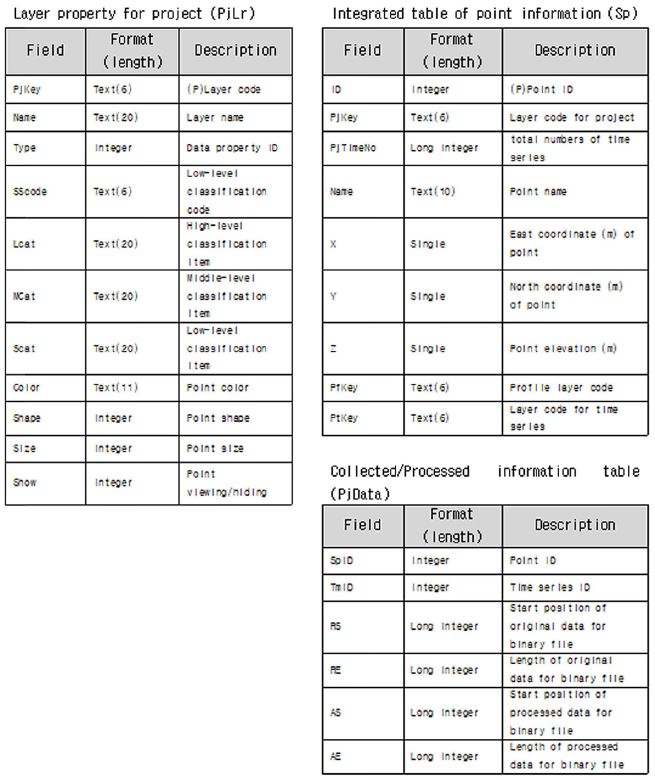
PR“FileID” 데이터베이스는 등록한 과업에서 생성된 프로젝트, 프로파일, 시계열 레이어의 속성(예, 고유코드, 레이어명, 자료속성, 대분류, 중분류, 소분류), 각 레이어에 포함된 측점속성(예, 색깔, 크기, 모양 등) 및 위치정보, 수집 또는 가공자료에서 주제별로 추출된 P-value (프로파일 레이어 또는 시계열 레이어의 주제와 직접적으로 관계한 값)를 관리하는 데이터베이스이다. PR“FileID” 데이터베이스를 구성하는 테이블 중 프로젝트 레이어에 연관된 테이블은 Sp, PjLr, PjData이다(그림 5). 여기서 Sp 테이블은 프로젝트, 프로파일 및 시계열 레이어에서 각 레이어에 포함된 측점의 좌표와 각 측점에서 측정한 자료 수에 대한 정보를 관리한다. 프로젝트 레이어에 대한 속성정보를 관리하는 PjLr 테이블은 11개의 필드로 구성되며, 그 중 Primary key인 PjKey 필드의 형식은 6자리 문자열로 정의하였다. PjKey 필드의 6자리 문자열 중 처음 4자리는 수집자료의 자료속성에 대한 인덱스값을 갖는 Type 필드에 의해 결정된다. 여기서 Type 필드는 그림 3에서 정의한 Type 테이블의 ID 필드값을 참조한다. Type 필드값이 0이면 수집자료는 점-단일속성자료이고 PjKey값의 처음 4자리 문자는 “PSNG”이며, Type 필드값이 1이면 수집자료는 선-단일속성자료이고 PjKey값의 처음 4자리 문자는 “LSNG”이다. Type 필드값이 2이면 수집자료는 점-다중속성자료이고 PjKey값의 처음 4자리 문자는 “PMLT”, Type 필드값이 3이면 수집자료는 선-다중속성자료이고 PjKey값의 처음 4자리 문자는 “LMLT”로 설정되고, PjKey값의 나머지 2자리 문자열은 레이어의 생성순서를 나타낸다. 예로서, 소분류 전기비저항 1차원탐사와 소분류 수위측정의 프로젝트 레이어에 대한 PjLr 테이블의 레코드는 표 5와 같다.
과업에서 생성된 모든 측점의 이름, 좌표와 각 측점이 포함된 레이어의 고유코드를 통합 관리하는 Sp 테이블은 9개 필드로 구성되었다. Primary key로 정의한 필드 ID는 측점의 생성순서로 수집/가공자료가 저장된 파일정보를 관리하는 PjData 테이블의 SpID 필드에 의해 참조된다. 만약 측점이 프로젝트 레이어에 포함될 경우에는 Sp 테이블의 PjKey 필드는 PjLr 테이블의 PjKey 필드값을 참조하고, 해당 측점을 포함한 레이어의 모든 정보를 참조한다. 만약 측점이 프로젝트 레이어에 포함되지 않으면 Sp 테이블의 PjKey 필드값은 “N/A” 값을 갖는다. PjTimeNo 필드는 각 측점에서 시간에 따라 반복적으로 수집된 자료의 총수를, X, Y, Z 필드는 측점의 동방향과 북방향 좌표와 고도를 위한 필드이다. PfKey, PtKey 필드값은 각각 프로파일 레이어와 시계열 레이어에 대한 고유코드(그림 6, 7)로서, PjKey 필드와 같이 측점이 각 레이어에 포함되면 각 레이어에 대한 테이블의 고유코드값을 참조한다.
프로젝트 레이어에 포함된 측점에서 수집된 자료와 수집자료로부터 산출한 가공자료가 저장된 2진파일 내의 시작위치와 자료길이에 대한 정보를 관리하는 PjData 테이블은 6개의 필드(SpID, TmID, RS, RE, AS, AR)로 구성된다. SpID 필드는 Sp 테이블의 Primary key이고 측점 생성순서인 ID 필드값을 참조하고, 해당 측점에 대한 정보를 참조한다. TmID 필드는 각 측점에서 시간에 따라 수집된 자료의 순서, 즉 시계열자료의 순서를 위한 필드이다. RS, RE 필드의 형식은 Long Integer로 정의하였으며, 각각의 필드값은 2진파일에 저장된 수집자료의 시작위치와 자료길이를 나타낸다. AS, AR 필드의 형식은 RS, RE와 같으며, AS, AR 필드값은 2진파일에 저장된 가공자료의 시작위치와 자료길이를 나타낸다. 그러므로 RS, RE, AS, AR 필드값은 2진파일에 저장된 수집자료와 가공자료를 업로드할 때 쓰는 값이다.
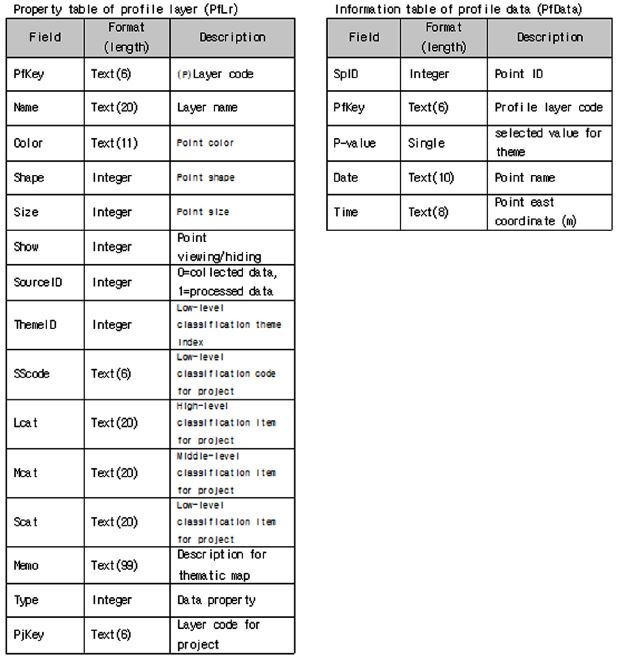
그림 6의 PfLr와 PfData 테이블은 주제별로 생성된 프로파일 레이어의 속성정보와 프로젝트 레이어의 수집/가공자료로부터 추출한 P-value값에 대한 정보를 관리한다. PfLr 테이블의 필드 중 Source 필드는 “해당 프로파일 레이어가 프로젝트 레이어의 수집자료와 가공자료 정수 형식으로 정의된 ThemeID 필드는 그림 3의 Theme 테이블의 ThemeID 필드값을 참조하고, Source 필드와 함께 “해당 프로파일 레이어가 어떤 자료의 어떤 주제로 생성된 프로파일 레이어인가?”를 알려준다. Memo 필드는 99자 문자열 형식으로 정의하고 생성한 프로파일 레이어에 대한 필요한 설명을 위한 필드이다. PjKey 필드는 PjLr 테이블의 PjKey를 참조하고, 해당 프로파일 레이어가 “어떤 프로젝트 레이어로부터 생성되었나?”하는 정보를 알려준다. 표 5의 레코드 중 PjKey값이 “PMLT01”인 프로젝트 레이어(샘플PJ-01)로부터 3개의 주제(층의 두께, 층의 전기비저항, 외견비저항)에 따라 생성된 프로파일 레이어에 대한 PfLr 테이블의 레코드를 표 6에 예시하였다.
프로젝트 레이어의 수집/가공자료로부터 추출한 P-value값에 대한 정보는 PfData 테이블이 관리하며, 이 테이블은 총 5개의 필드로 구성되었다. SpID 필드는 그림 6의 Sp 테이블의 측점 생성순서인 ID 필드를, PfKey 필드는 PfLr 테이블의 PfKey를 각각 참조한다. P-value 필드는 프로젝트 레이어의 자료 중 PfLr 테이블의 Source 필드값을 갖는 자료에서 ThemeID 필드값을 갖는 주제에 따라 추출한 주제값을 위한 필드이다. Date, Time 필드는 자료를 수집한 날짜와 시간에 대한 정보를 위한 필드이다.
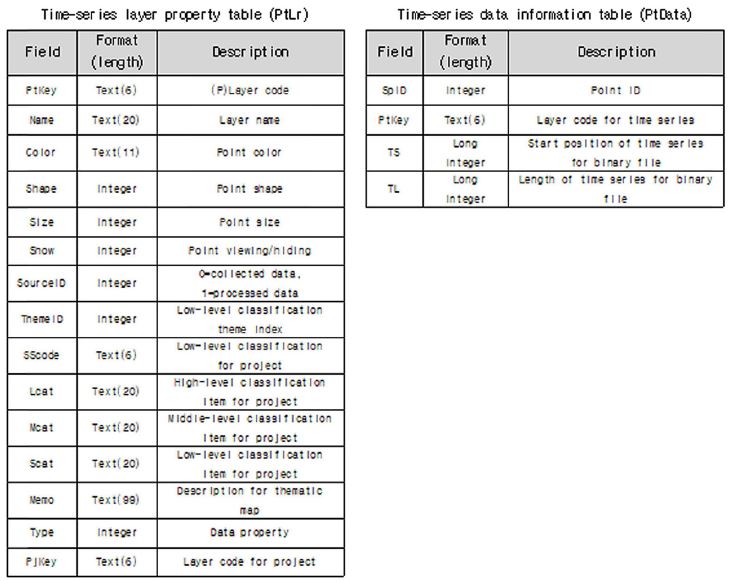
그림 7의 PtLr와 PtData 테이블은 주제별 생성된 시계열 레이어의 속성정보와 레이어에 포함된 측점의 시계열자료가 저장된 파일에 대한 정보를 관리한다. PtLr 테이블의 필드 중 Source 필드는 PfLr 테이블에서와 같이 시계열 레이어가 “프로젝트 레이어의 어떤 자료로부터 생성되었나?”하는 정보를 나타내는 필드이며, ThemeID 필드는 Integer 형식으로 그림 3의 Theme 테이블의 ThemeID 필드값을 참조하고, Source 필드와 함께 “해당 시계열 레이어가 어떤 자료의 어떤 주제로 생성된 레이어인가?”를 알려준다. Memo 필드는 99자 문자열 형식이며, 생성한 시계열 레이어에 대한 필요한 설명을 위한 필드이다.
4개의 필드로 구성한 PtData 테이블의 SpID 필드는 그림 3의 Sp 테이블의 측점 생성순서인 ID 필드를, PtKey 필드는 PtLr 테이블의 PtKey를 각각 참조한다. TS와 TE 필드의 형식은 Long Integer이며, 각각의 필드는 2진파일 내에 시계열자료가 저장된 시작위치와 저장자료의 길이를 위한 필드이다.
3.4 SaSo 실행
SaSo S/W는 MS Visual Basic (VB)로 만들어졌으며, MS Window XP 이상의 운영체제에서 실행된다. VB는 저급레벨 프로그래밍언어(Low level programming language)인 C++과 비교하여 메모리 할당 및 제거 그리고 D/B 접근이 상대적으로 용이하다. 다중속성 자료에 대한 차원변환(예, 전기비저항 1차원 역산, TEM 1차원 역산, 자력 및 중력탐사 자료보정 등)은 수치적 계산문제이므로 이미 개발된 Fortran 소스코드를 동적-링크 라이브러리(Dynamic-Link Library: DLL)로 컴파일-링크한 후 SaSo에 연결하였다.
프로젝트 영역에서, SaSo 프로그램의 좌표체계는 동방향과 북방향의 TM 좌표를 사용하였고, 각 레이어를 구성하는 측점들은 TM좌표에 따라 “좌표창”에 각 레이어에 설정된 측점의 모양과 색에 따라 도시된다. 측점과 자료 “편집창”은 각 레이어를 구성하는 측점들의 좌표(동좌표, 북좌표, 고도)와 수집된 자료값을 입력·편집하는 폼으로 대부분의 편집 기능은 MS Excel과 동일하다. 프로젝트 “자료처리창”은 가공자료 생산을 위해 수집된 원시자료에 대한 자료속성에 따른 가공작업을 수행하는 폼이다. 그림 8은 점-단일속성자료인 지하수위에 대한 SaSo 프로그램의 실행 예이며, 그림 9는 점-다중속성자료인 전기비저항 수직탐사 자료에 대한 SaSo 프로그램의 실행 예이다. 점-다중속성자료인 슐럼버져배열 전기비저항 수직탐사에 대한 층모델 역산을 수행하기 위한 “자료처리창”은 그림 9에 보여주고 있다.
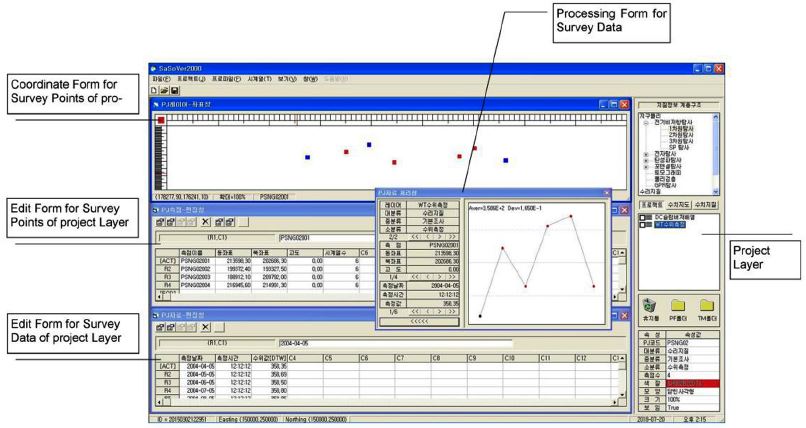
An example of SaSo execution with groundwater level data in project mode. The project layer named as “WT water level data” consists of single-property data (The top child-window called as “PJ layer coordinate window” shows all survey stations colored as red where groundwater levels are measured. The middle child-window called as “PJ point editing window”shows X, Y, and Z-coordinates of survey points and the number of measurements with time at each survey point. The bottom child-window called as “PJ data editing window” shows the water level values measured at survey station PSNG02001 with measured time and date. The child-window called as “PJ data processing window” shows classification codes, the time series, coordinates of PSNG02001.
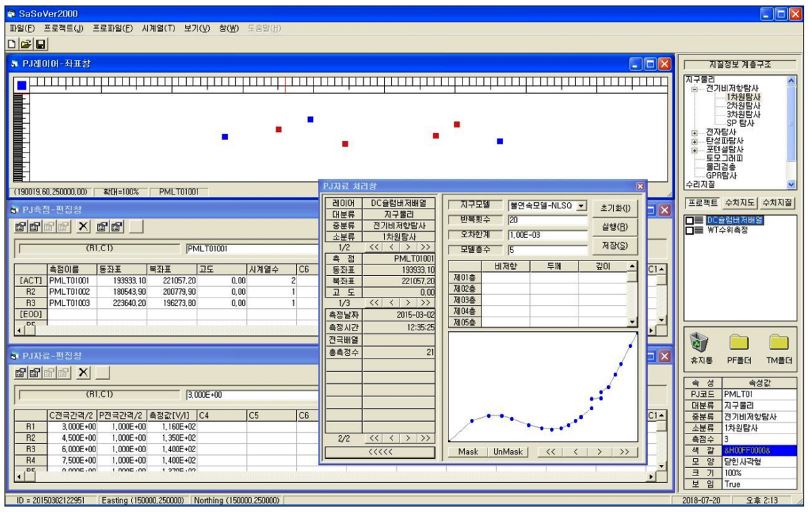
An example of SaSo execution with geophysical data in Project mode. The project layer named as “DC Schlumberger array” consists of multi-property data. The top child-window called as “PJ layer coordinate window” shows all survey stations colored as blue where DC resistivities are measured. The middle child-window called as “PJ point editing window” shows X, Y, and Z-coordinates of survey points and the number of measurements with time at each survey point. The bottom child-window called as “PJ data editing window” shows the DC resistivity values measured at survey station PMLT01001 with electrode spaces. The child-window called as “PJ data processing window” shows the apparent resistivity curve, measured date, coordinates, and number of resistivity measurements of PMLT01001. And in this window resistivity inversion can be processed to produce true resistivities and thicknesses of the earth layered models.
프로파일 영역에서 단일속성 및 다중속성에 대한 SaSo 프로그램의 실행은 각각 그림 10과 그림 11에 도시하였다. 프로파일 레이어 “PF레이어-01”과 “PF레이어-02”는 그림 8과 그림 9의 프로젝트 레이어인 “DC슐럼버져배열”과 “WT수위측정”으로부터 각각 생성하였다. 각 프로파일 레이어들을 구성하는 측점들은 프로젝트 모드에서와 같이 프로파일 “좌표창”에 각 레이어에 설정된 측점의 모양과 색에 따라 도시(“PF레이어-01”의 측점들은 파랑색-사각형, “PF레이어-02“ 레이어의 측점은 빨강-사각형)하였다. 활성화한 현재 프로파일 레이어에 대한 속성을 관할하는 영역은 그림 10과 11의 좌측 하단에 위치한다. 이 영역은 활성화된 프로파일의 대분류, 중분류, 소분류와 활성된 프로파일 레이어의 생성에 사용한 프로젝트 레이어의 이름, 코드 등의 정보를 갖고 있다. 또한 각 측점에서 P-value 선택을 위해 사용된 자료가 원시자료인지 또는 가공자료인지에 대한 정보와 주제의 종류에 대한 정보도 갖고 있다. 그림 10에서는 점-단일속성자료인 수위자료이므로 P-value 선택을 위한 자료출처는 원시자료이며, 주제는 지하수위(그림에서는 WTL)이다. 그림 11은 점-다중속성자료인 슐럼버져배열 수직전기탐사 자료의 경우로서, 주제도 작성에 사용된 자료의 출처는 가공자료(역산을 수행하여 생성된 지전기적 층모델 자료)이며, P-val-ue 추출을 위한 주제는 각 측점의 지전기적 층서구조에서 가장 낮은 전기비저항 값을 갖는 층에 대한 전기비저항 값이다. P-value는 “PF자료 처리창”에서 추출하며(그림 12 상부그림), 이 추출된 값은 추출시간, 측점좌표와 함께 “PF자료 편집창”를 자동적으로 갱신한다(그림 12 하부그림). 그러므로 그림 10에서 생성된 프로파일 레이어 “PF레이어-02”는 조사지역의 자연 지하수위 분포도fh 해석할 수 있고, 그림 11에 생성된 프로파일 레이어 “PF레이어-01”은 조사지역을 구성하는 지전기적 층서구조에서 가장 낮은 전기비저항값을 갖는 층의 전기비저항 분포도로 해석할 수 있다.
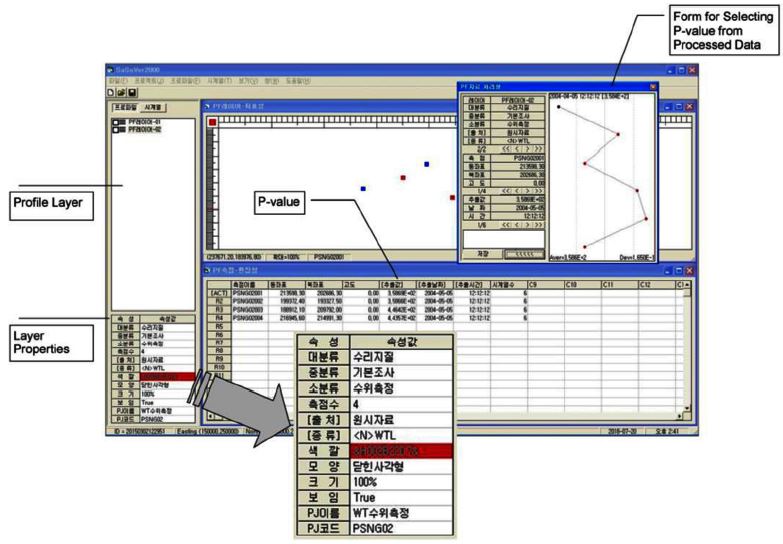
An example of SaSo execution with hydrological data in profile mode. The profile layer named as “PF layer-02” produced from project layer named as “WT water level data” The top child-window called as “PF layer coordinate window” shows all survey stations colored as red where groundwater levels are measured. The bottom child-window called as “PF point editing window” shows X, Y, and Z-coordinates of survey points, P-values, and the extracting time and date at each survey point consisted of the profile layer (“PF layer-02”. The P-values are extracted from the raw data without any processing, since the groundwater level is defined as single-property data.
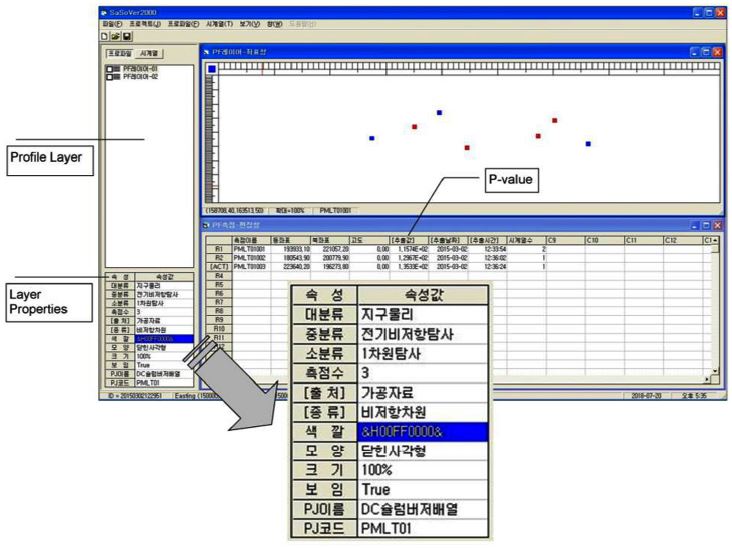
An example of SaSo execution with geophysical data in profile mode. The profile layer named as “PF layer-01” produced from project layer named as “DC Schlumberger array” The top child-window called as “PF layer coordinate window” shows all survey stations colored as blue where DC resistivities are measured. The bottom child-window called as “PF point editing window” shows X, Y, and Z-coordinates of survey points, P-values, and the extracting time and date at each survey point consisted of the profile layer (“PF layer-01”. The P-values are extracted from true resistivity values of the electrical layered model produced with resistivity inversion.
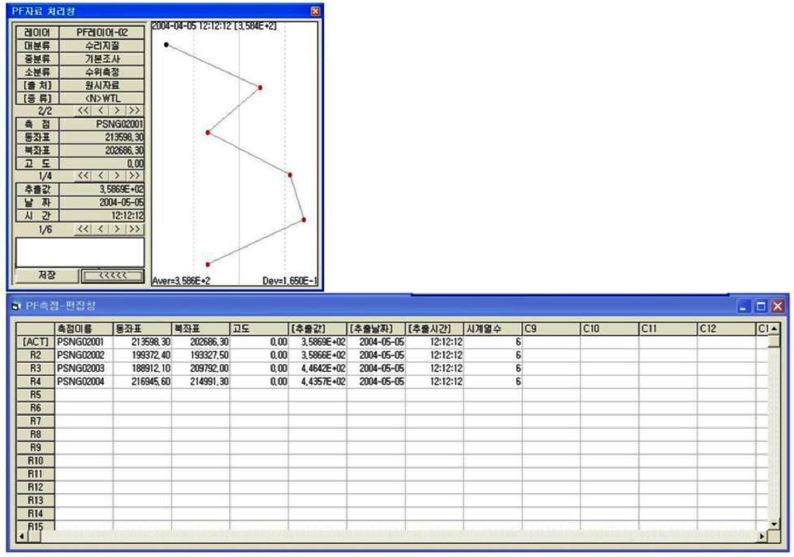
“PF data processing window” and “PF point editing window” composed of SaSo S/W shown in Fig. 10. The top form (“PF data processing window” consist of two parts. On the top form, the left part deals with all the information about the data used with selecting P-value while the right part is the graph for selecting P-value value. The bottom form (“PF point editing window” represents the extracted theme value, the extracting time, and coordinates of the points constituting the active profile layer.
4. 결 론
이 연구에서는 지질관련 자료들을 단일속성과 다중속성으로 분류하고, 각각의 분류한 자료들에 대한 정형화를 통한 통합적이며, 데이터베이스 서버구축까지 확장이 용이한 지질정보 데이터베이스를 구축하였다. 이 연구를 통하여 현재 연구그룹간의 한정적이며 지엽적으로 관리되어온 지질관련 자료에 대하여 효율적인 통합관리와 정보의 상호교환 및 활용측면에서 자료형식의 기준을 제시하였다.
또한, 기존 GIS S/W의 한계성을 극복하고, 목적에 따른 주제도 생성을 포함한 모든 작업 과정이 하나의 S/W 환경 하에서 선택적으로 이루어지도록 프로그래밍 알고리즘을 설계하였다. 알고리즘의 효율적 실행을 검증하기 위하여 응용 프로그램인 SaSo 소프트웨어를 MS 윈도 운영체제에서 개발하고, 단일속성자료인 지하수위자료와 다중속성자료인 슐럼버져배열 전기비저항 1차원탐사자료를 사용하여 시계열자료를 포함한 프로젝트 레이어를 생성하였다. 다중속성자료의 경우, 프로젝트 레이어로부터 프로파일 레이어, 즉 SaSo 소프트웨어 상에서 주제에 따른 주제도 생성을 위한 가공작업(차원변환)과 P-value 추출을 효율적으로 수행할 수 있었다.
Acknowledgments
이 연구는 과학기술정보통신부의 한국연구재단 중견연구사업(NRF-2017R1A2B2009033)으로 수행되었습니다.
References
-
Jang, S.O., and Jo, M.H., (2011), A study on the application of spatiotemporal data model for land information, Journal of the Korean Association of Geographic Information Studies, 14(2), p162-169, (in Korean with English abstract).
[https://doi.org/10.11108/kagis.2011.14.2.162]

- Jeong, H.J., Hwang, D.H., Bang, S.S., Park, S.Y., and Lee, H.K., (2002), Development of Environmental Information System of Small Watershed Using Geographic Information System, Korean Journal of Environmental Health Sciences, 28(1), p1-10, (in Korean with English abstract).
-
Kang, J.E., and Lee, M.J., (2012), Assessment of Flood Vulnerability to Climate Change Using Fuzzy Model and GIS in Seoul, Journal of the Korean Association of Geographic Information Studies, 15, p119-136, (in Korean with English abstract).
[https://doi.org/10.11108/kagis.2012.15.3.119]

- Kang, S.Y., and Kim, K.H., (2009), A Case Study of GIS-Based Site Classification in the Gyeongsang Province Constrained by Geologic and Topographic Information, Journal of the Korean Association of Geographic Information Studies, 12, p136-145, (in Korean with English abstract).
- Kim, K.U., Lee, J.E., Hwang, H.S., and Kim, C.S., (2008), The Development of a Input Data Automatic Generation System for the Storm Management Simulation based on UIS, Journal of Korea Multimedia Society, 11, p247-256, (in Korean with English abstract).
-
Kim, S.H., Chi, J.H., and Ryu, K.H., (2005), Extension of OpenGIS Model for Four Dimensional Spatiotemporal Data, The KIPS Transactions: Part D, 12(3), p375-384, (in Korean with English abstract).
[https://doi.org/10.3745/kipstd.2005.12d.3.375]

- Lee, S., Kim, Y.S., Kim, N.J., and Ahn, K.H., (2008), Analysis of relationships between topography/geology and groundwater yield properties at Pohang using GIS, Economic and Environmental Geology, 41, p115-131, (in Korean with English abstract).
- Lee, S.J., Noh, J.W., Ahn, J.M., and Kim, J.C., (2009), Analysis of Hydrologic Geo-Spatial Information Using Runoff-Management Model, Journal of Korea Spatial Information System Society, 11, p60-70, (in Korean with English abstract).


